MUFG Americas Holdings Corporation - Investor Presentation for the Quarter Ended March 31, 2019 - Union Bank

Page created by Roberto Richardson
 
CONTINUE READING
MUFG Americas Holdings Corporation - Investor Presentation for the Quarter Ended March 31, 2019 - Union Bank
MUFG Americas Holdings
                                     Corporation

                                     Investor Presentation for the Quarter Ended

                                     March 31, 2019

MUFG Americas Holdings Corporation
MUFG Americas Holdings Corporation - Investor Presentation for the Quarter Ended March 31, 2019 - Union Bank
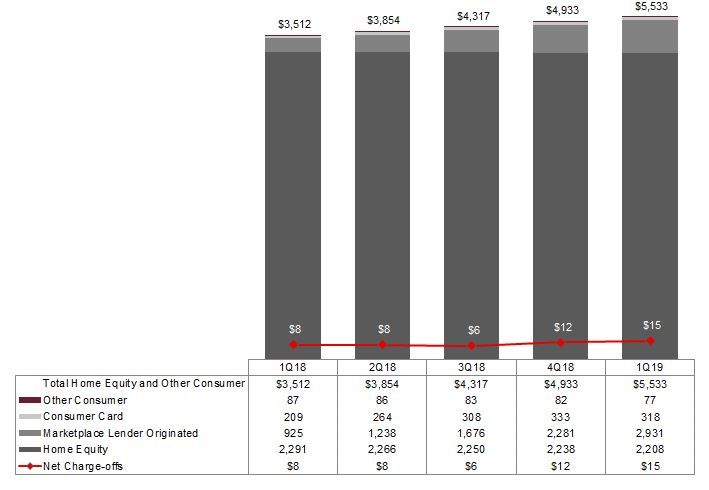
Forward-Looking Statements and Non-GAAP Financial Measures

This presentation describes activities of MUFG Americas Holdings Corporation and its consolidated subsidiaries (the Company) unless otherwise
specified. This presentation should be read in conjunction with the financial statements, notes and other information contained in the Company’s
most recent annual report on Form 10-K and Quarterly Reports on Forms 10-Q and in any subsequent filings with the Securities and Exchange
Commission (SEC).

The following appears in accordance with the Private Securities Litigation Reform Act. This presentation includes forward-looking statements that
involve risks and uncertainties. Forward-looking statements can be identified by the fact that they do not relate strictly to historical or current facts.
Often, they include the words “believe,” “expect," “target,” “anticipate,” “intend,” “plan,” “seek," "estimate,” “potential,” “project,” "forecast," "outlook,"
or words of similar meaning, or future or conditional verbs such as “will,” “would,” “should,” “could,” "might," or “may.” They may also consist of
annualized amounts based on historical interim period results. There are numerous risks and uncertainties that could and will cause actual results
to differ materially from those discussed in the Company’s forward-looking statements. Many of these factors are beyond the Company’s ability to
control or predict and could have a material adverse effect on the Company’s financial condition, and results of operations or prospects. For more
information about factors that could cause actual results to differ materially from our expectations, refer to our reports filed with the SEC, including
the discussions under “Management’s Discussion & Analysis of Financial Condition and Results of Operations” and “Risk Factors” in the
Company’s most recent Annual Report on Form 10-K and Quarterly Reports on Forms 10-Q and in any subsequent filings with the SEC and
available on the SEC’s website at www.sec.gov. Any factor described above, in this presentation, or in our SEC reports could, by itself or together
with one or more other factors, adversely affect our financial condition, results of operations and prospects. All forward-looking statements
contained herein are based on information available at the time of this presentation, and the Company assumes no obligation to update any
forward-looking statements.

This investor presentation includes the tangible common equity capital ratio to facilitate the understanding of the Company’s capital structure and
for use in assessing and comparing the quality and composition of the Company's capital structure to other financial institutions. This presentation
should not be viewed as a substitute for results determined in accordance with GAAP, nor is it necessarily comparable to non-GAAP financial
measures presented by other companies. Please refer to our separate reconciliation of non-GAAP financial measures in our 10-Q for the quarter
ended March 31, 2019.
                                                                                                MUFG Americas Holdings Corporation Investor Presentation, 1Q19    2
MUFG Americas Holdings Corporation - Investor Presentation for the Quarter Ended March 31, 2019 - Union Bank
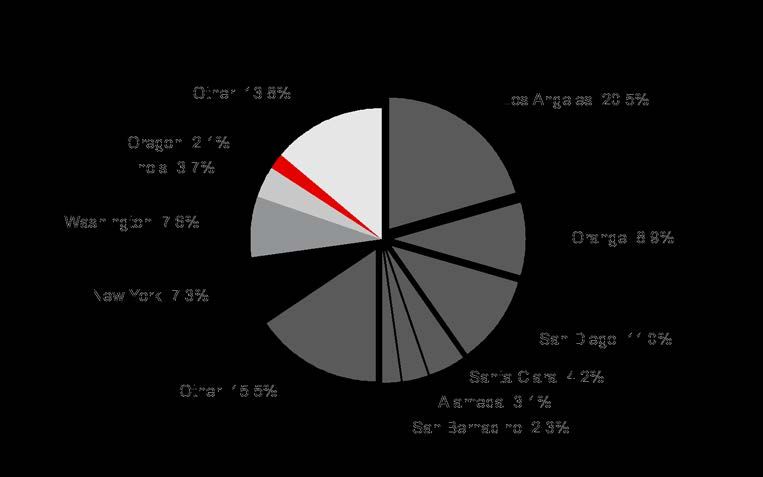
Overview of U.S. Presence

     •       Mitsubishi UFJ Financial Group (MUFG) U.S. franchise is the 11th largest among U.S. banks with combined total assets
             of $337 billion1 as of 12/31/2018

     •       Strong footprint in affluent West Coast markets complemented by national reach via Wholesale & Investment Banking
             and PurePoint

     •       Experienced local management team and a majority of independent board members

     •       High quality loan portfolio with historically strong credit performance – non-performing assets and net charge-offs
             generally below peer group

     •       Strong credit ratings and benefit from ownership by MUFG, one of the world’s largest financial organizations

     •       Strong balance sheet with high-quality capital base and strong liquidity – Tier 1 risk-based capital ratio of 13.95% (vs.
             11.61% reference banks2 average)

                                                                                                                                   Chicago (4)
                                                                                                                                                                 New York (3)

                                                                                                                    Texas (7):                    Florida (8):
                                                                                                                    Dallas (3)                    Miami (5)
                                                                                                                    Houston (4)                   Tampa (3)

1.   Source: 12/31/18 FR Y-7Q
2.   Reference banks consist of 13 CCAR-filing public regional banks (BBT, CFG, CMA, COF, FITB, HBAN, KEY, MTB, PNC, RF, STI, USB, ZION)
     plus the four largest U.S. money center banks (BAC, C, JPM, WFC).                                                                     MUFG Americas Holdings Corporation Investor Presentation, 1Q19   3
MUFG Americas Holdings Corporation - Investor Presentation for the Quarter Ended March 31, 2019 - Union Bank
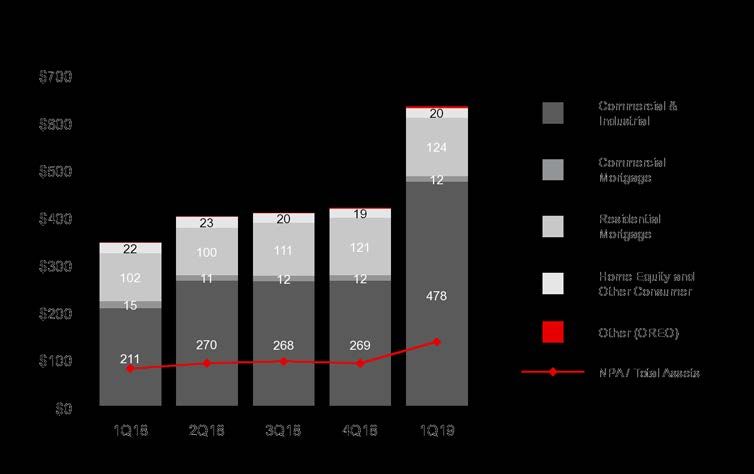
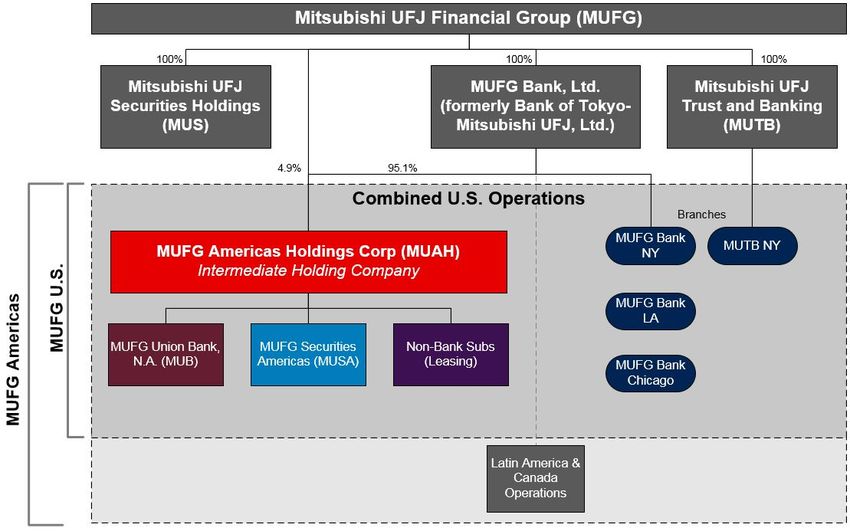
MUFG has a Significant Presence in the U.S.

           Significant presence in the United States through MUFG Americas Holding Corp. (MUAH), its Intermediate Holding
           Company, as well as through MUFG branches, collectively referred to as Combined U.S. Operations (CUSO)

                                                                                                                                                                                                                          MUFG2
                                                                                                                                                                                                     • Total Assets: $2.8 trillion,
                                                                                                                                                                                                       5th largest globally
                                                                                                                                                                                                     • Loans: $1.0 trillion
                                                                                                                                                                                                     • Locations: ~1,800
                                                                                                                                                                                                     • Employees: ~150,000
                                                                                                                                                                                                       across 50+ countries
                                                                                                                                                                                                     • Deposits: $1.6 trillion, 6th
                                                                                                                                                                                                       largest globally

                                                                                                                                          3/31/19 assets:        3/31/19 assets:                                     MUFG U.S.
                                                                                                                                             $140.4B                 $16.2B

                                                                                                                                                                                                     • Total Assets: $337
                                                                                                                                          3/31/19 assets:
                                                                                                                                                                                                       billion3
                                                                                                                                               $9.9B                                                 • Loans: $192 billion, 8th
                                                                                                                                                                                                       largest among U.S.
                        3/31/19 assets:                  3/31/19 assets:                  3/31/19 assets:                                 3/31/19 assets:                                              Banks3
                           $133.4B                           $33.9B                           $3.4B1                                           $3.9B
                                                                                                                                                                                                     • Locations: 377 branches
                                                                                                                                                                                                       (incl. PurePoint)4
                                                                                                                                                                                                     • Employees: ~13,250
                                                                                                                                                                                                       FTE5
                                                                                                                                                                                                     • Deposits: $167 billion3

1.   Net of intercompany eliminations
2.   MUFG: Total Assets, Loans, and Deposits as of 12/31/2018 using an exchange rate of USD 1.00 = JPY 111.00; global rankings for Total Assets and Deposits are as of 12/31/2017; locations, employees, and countries are as of 9/30/2018
3.   MUFG U.S.: Total Assets of $337 billion, Loans of $192 billion, and Deposits of $167 billion; including intercompany adjustments as of December 31, 2018
4.   Includes all U.S. branches and PurePoint financial centers
5.   Source: MUAH's 12/31/2018 10-K filing, number of full-time equivalent (FTE) employees for MUAH only
                                                                                                                                                          MUFG Americas Holdings Corporation Investor Presentation, 1Q19                     4
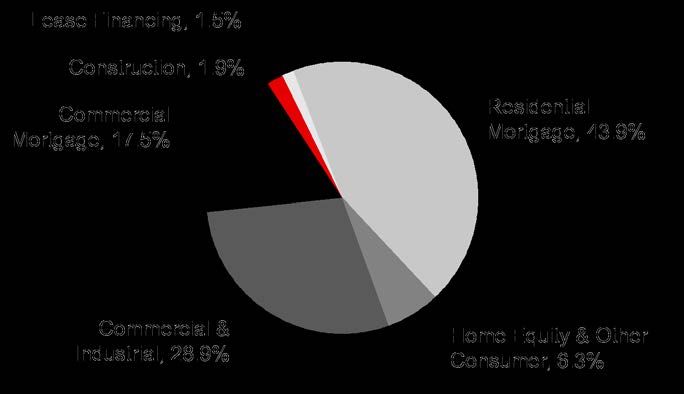
MUFG Americas Holdings Corporation - Investor Presentation for the Quarter Ended March 31, 2019 - Union Bank
Who We Are

   MUFG has grown to become                                                                                   MUFG Americas serves our
         one of the largest                                                                                     individual, corporate, and
  comprehensive financial groups                                                                            institutional clients in the United
   in the world, building on over                                                                              States, Canada, and Latin
  360 years of financial expertise                                                                                        America

                                        Mitsubishi UFJ Financial Group
                                                    (MUFG)

                                               MUFG Americas

                                                   MUFG U.S.

                                                  MUFG Americas
                                                Holdings Corporation
                                                      (MUAH)

MUFG U.S. includes MUAH, as well                                                                         MUAH is a U.S. financial and bank
as our MUFG Bank and MUTB U.S.                                                                             holding company that includes
branches, collectively referred to as                                                                     MUFG Union Bank N.A., MUFG
Combined U.S. Operations (CUSO)                                                                          Securities Americas and all MUFG's
                                                                                                            non-branch U.S. subsidiaries

                                                                       MUFG Americas Holdings Corporation Investor Presentation, 1Q19             5
MUFG Americas Holdings Corporation - Investor Presentation for the Quarter Ended March 31, 2019 - Union Bank
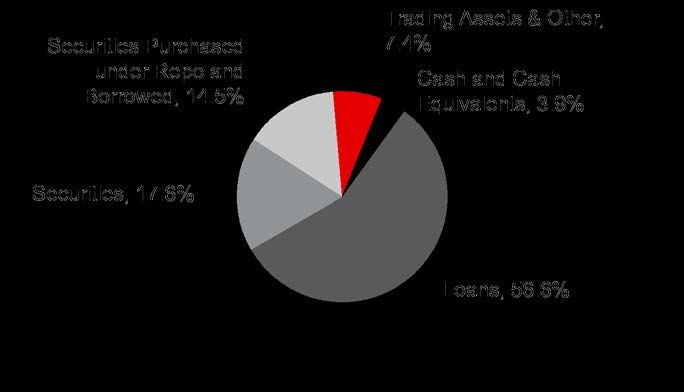
MUFG's Journey in the Americas

                                                                                                                                                                             We serve our corporate
                                                                                                                                                                             and investment banking
                                                                                                                                                                             clients under the MUFG
                                                                                                                                                                             Brand; our consumer,
                                                    Corporate and Investment            Integration                                                                          wealth, and commercial
                        MUFG builds global          banking formed                      of U.S. Banking                                                                      banking clients under the
                        network of overseas                                             Operations                                                                           Union Bank brand;
Union Bank, formerly    bases comparable to         Union Bank becomes                  under                                                                                and our direct banking
known as Bank of        major banks of              wholly owned subsidiary of          MUAH/MUFG         Stephen Cummings is named                                          business under the
California, is formed   Europe and U.S.             MUFG                                Union Bank        CEO for the Americas                                               PurePoint brand

1864                    1970s                       2008                                2014              2015                                            2017                     Today

   1880                             1988                       2010 - 2013                                                       2016                                         2019
   MUFG, formerly known             MUFG acquires              Acquired:                                  Formation of           MUAH as Intermediate                         Acquired Intrepid
   as Yokohama Specie               Union Bank                 • Tamalpais Bancorp (2010)                 Regional Bank          Holding Company                              Investment Bankers
   Bank, Bank of Tokyo, is                                       ~$600 million assets                     under Single           Consolidates MUFG U.S.
   formed                                                                                                 Leadership             Subsidiaries, including                      Acquired Trade
                                                               • Frontier Bank (2010)                                            MUFG Securities Americas                     Payable Services
                                                                 ~$3 billion assets                                              (Enhanced Prudential                         (TPS), a leading
                                                                                                                                 Standards Implementation)                    supply chain
                                                               • Pacific Capital Bancorp (2012)                                                                               finance platform,
                                                                 ~$6 billion assets                                                                                           from GE Capital

                                                               • Smartstreet (2012)
                                                                 ~$1 billion assets

                                                               • First Bank (2013)
                                                                 ~$550 million assets

                                                               • PB Capital (2013)
                                                                 ~$3.5 billion assets

                                                                                                            MUFG Americas Holdings Corporation Investor Presentation, 1Q19                         6
MUFG Americas Holdings Corporation - Investor Presentation for the Quarter Ended March 31, 2019 - Union Bank
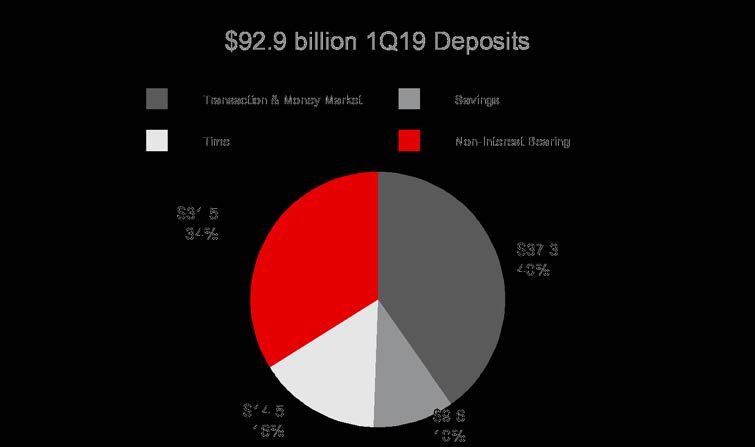
Evolution of Strategic Plan

                 FY2015 ~ FY2017                                                FY2018 ~ FY2020
 Organizational Change                                     Business Strategy
 • Integrated Retail and Commercial Banking units          • Expand and diversify Regional Banking business
    under single leadership                                   model and balance sheet (unsecured consumer
 • Enhanced Prudential Standards implementation               lending, PurePoint, mortgage servicing rights)
    (Intermediate Holding Company formation in             • Product / market expansion in Wholesale and
    2016)                                                     Investment Banking (e.g., leveraged finance,
                                                              securitized products, supply chain finance)
 Business Strategy                                         • Balance sheet optimization (e.g., liquidity and
 • Launched PurePoint Financial                               capital management)
 • Entered into unsecured consumer lending and
    credit card businesses                                 Regulatory Compliance
 • Built MUFG capital markets platform                     • Further development of operational risk capabilities
 • Initiated balance sheet optimization
                                                           Operational Efficiency
 Regulatory Compliance                                     • Expand expense reduction initiatives
 • Enhanced liquidity & compliance areas                   • Launch of Technology Transformation program
 • Invested in operational risk capabilities in areas of      (core banking, data, cloud)
    liquidity, IT risk, and compliance                     • Customer journey-based digitalization
                                                           • Optimize capital efficiency (including capital
 Operational Efficiency                                       distributions)
 • Implemented expense initiatives including spans
    and layers, and organizational simplification to       Inorganic Opportunity
    fund above initiatives                                 • Seek opportunities having high strategic alignment
                                                               and return on equity contribution (e.g., Trade
                                                               Payable Services and Intrepid Investment Bankers)

                                                                   MUFG Americas Holdings Corporation Investor Presentation, 1Q19   7
MUFG Americas Holdings Corporation - Investor Presentation for the Quarter Ended March 31, 2019 - Union Bank
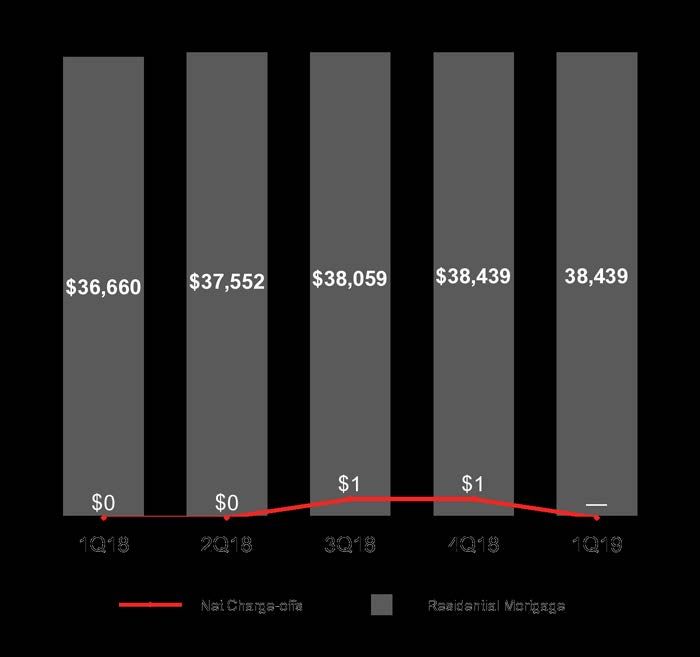
Key Strategic Initiatives

                             Business Strategic Imperatives

                   Acquire and Deepen Customer
                                                               Optimize Balance Sheet
                           Relationships

  Manage Risk & Compliance                                                                  Enhance Profitability & Create
                                      Digitalize & Enhance Infrastructure
   Effectively and Efficiently                                                              Paradigm Shift in Productivity

                                 Organic and through opportunistic acquisitions

                                    Select Priority Initiatives

       Enterprise                           Wholesale Bank                                             Regional Bank
                                              Financial Sponsors /
                                               Leveraged Finance                              Unsecured Consumer Finance
   Transformation Program
                                           Working Capital Solutions
                                                                                                            Digital Banking
                                      Securitized & Warehoused Products
     Deposit Gathering
                                                                                                 Mortgage Servicing Rights
                                             Equity Margin Lending
                                                                     MUFG Americas Holdings Corporation Investor Presentation, 1Q19   8
MUFG Americas Holdings Corporation - Investor Presentation for the Quarter Ended March 31, 2019 - Union Bank
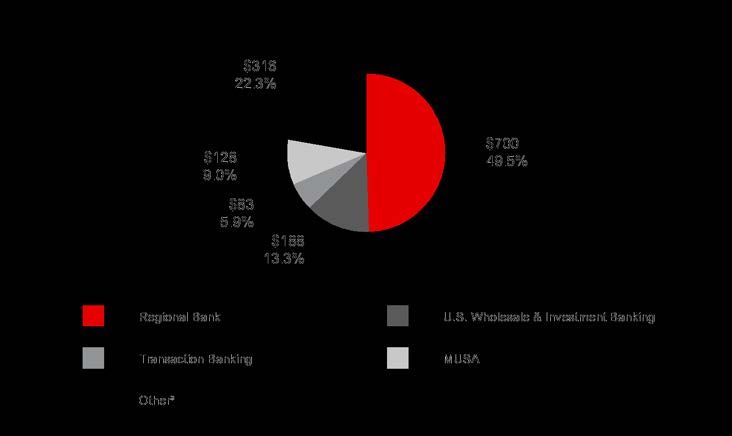
Regional Banking Overview

     One of the largest regional bank holding companies in the United States, serving customers
     nationally through PurePoint Financial and in the West Coast leveraging the 150-year history
     and brand of Union Bank

                                        $70 Billion Loans1                                                                                                     $59 Billion Deposits1

                                                                                                                                                                   Full-service branches in
                                         Jumbo mortgage portfolio in the
                    6th                  U.S.2
                                                                                                                                             342                   California, Oregon and
                                                                                                                                                                   Washington1

                TOP16                    Commercial Real Estate                                                                                                    Retail deposit market share in
                                         portfolio in the U.S.3
                                                                                                                                              5th                  California (4.0%)5

                                         Commercial & Industrial loans                                                                                             Total deposit market share in the
                  $9B                    as of 3/31/2019                                                                                     17th                  U.S.6

                                                                                                                                                                   PurePoint deposits as of
                                         Mid-market commercial west
                 ~7%                     coast share4
                                                                                                                                         $6.8B                     03/31/2019 (vs. $3.6 billion as of
                                                                                                                                                                   03/31/2018)

1.   As of 3/31/2019
2.   Source: Data as of 12/31/18, sourced from Inside Mortgage Finance newsletter from 3/29/19
3.   Source: Commercial Mortgage Alert as of 12/31/17
4.   Source: Based on % of lead relationships as a % of the total market, 2018 Greenwich Associates Market Tracking Program (Union Bank - CA/OR/WA - $20MM - 2B - Full Year 2018)
5.   Source: SNL Financial as of 6/30/18, Pro Forma ownership which captures any known M&A or branch closure activity up to the current date, $500M deposit cap applied as a proxy for Retail deposits
6.   Source: SNL Financial as of 6/30/18, Pro Forma ownership which captures any known M&A or branch closure activity up to the current date, no deposit cap applied

                                                                                                                                               MUFG Americas Holdings Corporation Investor Presentation, 1Q19   9
MUFG Americas Holdings Corporation - Investor Presentation for the Quarter Ended March 31, 2019 - Union Bank
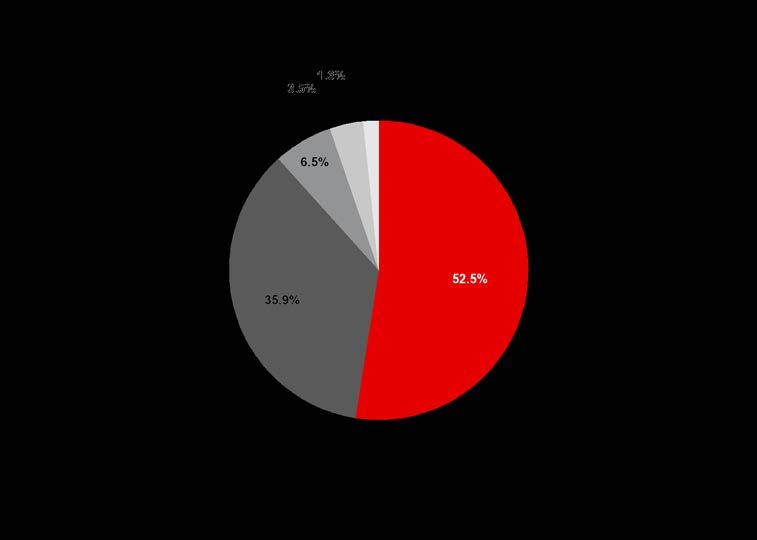
MUAH Key Business Segments

         Diversification across segments and products as illustrated through revenue and earnings mix. Key MUAH business
         segments1 consist of:
                Regional                                                 U.S. Wholesale &                                        Transaction Banking                                          MUFG Securities
                Banking                                                Investment Banking2                                                                                                      Americas
 Provides banking products and                                  Delivers a full suite of products                                  Offers working capital                                Engages in capital markets
   services to individual and                                    and services to large and mid-                              management and asset servicing                         origination activities, domestic and
business customers in California,                               corporate customers based on                                 solutions, including deposits and                       foreign debt and equity securities
Washington, and Oregon through                                industry-focused coverage teams,                                 treasury management, trade                            transactions, private placements,
   five major business lines:                                  including credit as well as global                            finance, and institutional trust and                       collateralized financings, and
Consumer Banking, Commercial                                     treasury management, capital                                      custody to customers                              securities borrowing and lending
Banking, Real Estate Industries,                                     market solutions, foreign                                                                                                      transactions
Wealth Markets, and PurePoint                                   exchange, and interest rate risk
  Financial which is a national                                                   products
 platform for non-footprint areas

               1Q 2019 Revenues by Segment ($MM)                                                                                    1Q 2019 Net Income by Segment ($MM)

    1.    Source: Form 10-Q for quarter end March 31, 2019
    2.    Marketed as Japanese Corporate and Investment Banking for Japanese corporate customers
    3.    Other includes Corporate Treasury, fees from affiliates and noninterest expenses associated with MUFG Bank, Ltd.
          branch banking operations
                                                                                                                                        MUFG Americas Holdings Corporation Investor Presentation, 1Q19                   10
Regional Banking Lines of Business

           Consumer                                           Commercial                                          Real Estate                                             Wealth
                                                                                                                                                                                                                  PurePoint Financial
            Banking                                            Banking                                            Industries                                              Markets

                                                                                                                                                                AUM/AUA: $31B
    Loans:    $44.2B                                    Loans:    $9.8B                                     Loans:    $14.2B
                                                                                                                                                                Loans:    $1.8B                                      Deposits: $6.8B
    Deposits: $37.1B                                    Deposits: $9.2B                                     Deposits: $2.4B
                                                                                                                                                                Deposits: $3.4B                                      Revenue: $10MM
    Revenue: $446MM                                     Revenue: $110MM                                     Revenue: $81MM
                                                                                                                                                                Revenue: $43MM

•   Branch Banking                                 • Middle Market                                      • Institutional Markets                             • Private Wealth                                    • National Digital
•   Private Banking                                • Business Banking                                   • Regional Markets                                    Management                                          Bank
•   Mortgage Banking                               • Specialty Niches                                   • Community                                         • TES                                               • Financial Centers
•   Unsecured Lending                              • Professional                                         Development                                       • Investment                                          (22 Financial
•   Small Business                                   Services                                             Finance                                             Management                                          Centers across 6
•   Digital Channels                               • SBA Lending                                        • Commercial                                        • Brokerage                                           markets)
                                                                                                          Mortgage

                                                                 Regional Bank Strategic Objectives
                                                      Deepen Existing                                                                                      Enhance Operational
 Diversify and Grow
                                                         Customer                                                                                         Capabilities to Achieve
Revenue Streams on                                                                                         Grow Deposits to
                                                     Relationships and                                                                                        Customer and                                          Improve ROE and
  West Coast and                                                                                           Fund Assets at an
                                                    Increase Acquisition                                                                                   Revenue Objectives                                        Efficiency Ratio
Select Products on a                                                                                         Optimal Cost
                                                      of Customers in                                                                                       while Preparing the
   National Scale
                                                      Target Segment                                                                                        Bank for the Future

Financials as of or for period ending 3/31/2019. Line of business revenue totals do not add up to total Regional Bank revenue due to allocation and rounding differences.
                                                                                                                                                            MUFG Americas Holdings Corporation Investor Presentation, 1Q19              11
Wholesale and Investment Banking Franchise
                                          Key Products

               Corporate            Loan                              Leasing & Tax
                                                  Project Finance                                 •     Covers wholesale and investment
                Loans            Syndications                            Equity
                                                                                                        banking customer loans across the
                                                                                                        United States included in MUAH's
                                                                                                        total commercial loan portfolio of
                                 Asset-based       Equity Margin      Supply Chain                      over $40 billion1
           Funds Finance
                                    Loans            Lending            Finance                   •     Consists of industry segments
                                                                                                        across MUAH, which are served by
                                                                                                        a broad suite of products across
                                                    Treasury                                            MUAH, including credit, Transaction
          Capital Markets         M&A/Event
                                                   Management         Rates and FX                      Banking and securities products
          (Debt & Equity)          Finance
                                                    Services

                                                              Key Market Segments
                      U.S.:                Core Businesses: Strong        Core Markets: Deeply                              Growth Business: New
                Key Market Globally              Momentum                      Entrenched                                        Investment
         • Strategy – Continue            • Corporate Loans             • Financial Institutions                        • Leveraged Finance
                Progression, “Up and to   • Project Finance             • Diversified Industrials                       • Supply Chain Finance
                the Left”                 • Leasing & Tax Equity        • Power & Utilities                             • Equity Margin Lending
         • Objective – Trusted            • Funds Finance               • TMT
               Advisor                    • Asset-based Loans           • Oil & Gas
         • Balance Sheet &                • Capital Markets (IG Bonds) • Public Finance
                Investment Supports       • Treasury Mgmt. Services     • Entertainment Finance
                Strategy                                                • Retail
                                                                        • Healthcare
1. As of March 31, 2019                                                               MUFG Americas Holdings Corporation Investor Presentation, 1Q19   12
Multi-Year Transformation Focuses on Five Key Goals

Client Experience           Business Agility             Effective Controls               Collaboration                                            Growth

A differentiated user      The ability for our          An effective control        A modern,                                       A growth-oriented,
experience for our         businesses to move           environment                 collaborative                                   efficient enterprise for
clients                    fast                          ◦ Improve and              workplace for our                               our shareholder
                                                                                    colleagues
◦ Delight clients with     ◦ Pivot to an agile             integrate controls                                                        ◦ Enable growth
  a seamless product         operating model               throughout the data       ◦ Empower rich                                    goals of our
  suite enabling their       that allows more              lifecycle                   knowledge sharing                               businesses
  financial goals            rapid development           ◦ Enhance straight-           via new technology
                                                                                                                                     ◦ Support inorganic
◦ Provide effortless         and launch                    through                   ◦ Streamline                                      growth aspirations
  access to the bank       ◦ Deliver a flexible,           processing to               processes with an                             ◦ Deliver committed
  across channels            secure, and                   reduce operational          end-to-end customer
                                                           risk                                                                        cost savings
◦ Anticipate client          scalable                                                  view
  needs                      technology                  ◦ Leverage
                             platform to capture           automation to
◦ Worry about                opportunities faster          strengthen
  protecting our
                                                           monitoring and risk
  clients, so they don’t
                                                           management
  have to

                                                    Leading to the Four Pillars of the
                                                       Transformation Program

                                         Data Analytics                       Technology                                                Agile
         Core Banking
                                              and                            Modernization                                               and
        Transformation
                                         Functionality                      (API, Cloud, etc.)                                   Talent Optimization
                                                                                  MUFG Americas Holdings Corporation Investor Presentation, 1Q19               13
Digitalization Roadmap: Journey Based Organization

 1 CUSTOMER-CENTRIC OBJECTIVES

                                                                                             Consumers

                  “Make it safe “Make it          “Make it    “Do for “Think
                   and secure” easy to do”         faster”     Me” for Me”                Small Business

 2 CUSTOMER-CENTRIC ORGANIZATION                                                                                                          Leverage technology to enable
Commu
nication
                       Educati
                         on                                                                                 UI/UX
                                                                                                                                          and innovate digital customers’
             DIGITAL
                                                                                             DIGITAL
                                                                                            CUSTOMER
                                                                                                                                                banking experience
           AWARENESS                                                                       EXPERIENCE

Coordin                   DIGITAL                                                                          Research
 ation                    PRODUCTS & INNOVATION   Enable &
                                                  Innovate                                                                                     Chatbot       Voice Banking     Wearable      IoT

                                                                                                                                                                   Technology
                 Acquire           Service         Identify           Pay               Financial                                     Account                                                       Channel
                                                                                        Wellness                                     Aggregation                                                   Integration

 3 UTILIZING DATA & INSIGHTS
                                                                                                                                                                Artificial     Machine
                                                                                                                                             Contactless                                  Blockchain
                                                                                                                                                              Intelligence     Learning

                   -Test                                                           -Define Journeys
                   -Learn        3. Optimize                     1. Discover       -Identify Pain Points
                   -Improve

                                                   Data

                                                  2. Active
                                                  & Engage
                                                              -Target customers
                                                              -Personalize offer

                                                                                                                      MUFG Americas Holdings Corporation Investor Presentation, 1Q19                             14
Leadership Team and Board of Directors
                    Stephen Cummings                                                                              Kazuo Koshi

                             MEO, Regional Executive for the Americas and
           MUFG                                                                                            MUFG         MEO and Deputy Regional Executive for the Americas
                             MEO of Global Corporate & Investment Banking Business Group
                             MEO, Regional Executive for the Americas,
                             Deputy Chief Executive, Global Corporate & Investment Banking
       MUFG Bank                                                                                         MUFG Bank      MEO, Deputy REA and Regional Head for Latin America
                             Business Unit and CEO for MUAH, Global Commercial Banking
                             Business Unit
       MUAH/MUB              President & CEO                                                             MUAH/MUB       PMO (as MUFG/MUFG Bank Deputy REA)

                   NORTH AMERICA WHOLESALE &                       TRANSACTION BANKING                         FINANCE                                                    LEGAL
                   INVESTMENT BANKING

                  Kevin Cronin                                     Ranjana Clark                              Johannes Worsoe                                             Michael Coyne
                  Head of North America Wholesale &                Chief Transformation Officer & Head        Chief Financial Officer                                     General Counsel
                  Investment Banking                               of Transaction Banking

                   REGIONAL BANKING                                MUFG SECURITIES AMERICAS                    RISK                                                       HUMAN RESOURCES
                                                                   (MUSA)

                  Timothy Wennes                                   William Mansfield                          Donna Dellosso                                              Amy Ward
                  West Coast President & Head of                   Regional Head of Global Markets &          Chief Risk Officer                                          Chief Human Resources Officer
                  Regional Banking                                 CEO of MUSA

                   JAPANESE CORPORATE                              CHIEF OF STAFF                              SYSTEMS/OPERATIONS                                         CORPORATE ADMINISTRATIONS
                   BANKING

                  Seiichiro Akita                                  Masatoshi Komoriya                         Christopher Higgins                                         Michael Thom
                  Head of Japanese Corporate                       Chief of Staff                             Chief Information & Operations                              Chief Corporate Administrative
                  Banking for the Americas                                                                    Officer                                                     Officer

                                                                                           Board Members

                                 Independent Board Members                                                                         Shareholder Appointees

       •         Toby S. Myerson                           •     Ann F. Jaedicke                                                        •    Masato Miyachi
       •         Robin Bienfait                            •     Suneel Kamlani                                                         •    Stephen Cummings
       •         Michael D. Fraizer                        •     Barbara L. Rambo                                                       •    Kazuo Koshi
       •         Mohan S. Gyani                            •     Dean A. Yoost                                                          •    Muneaki Tokunari
           MUAH Policy Making Officer (PMO)
MEO:       Managing Executive Officer
REA:       Regional Executive for the Americas
                                                                                                                      MUFG Americas Holdings Corporation Investor Presentation, 1Q19                       15
MUFG takes pride in our Achievements in Banking and
Serving Our Communities
                                                             MUFG Achievements

     2017          Outstanding Rating Community Reinvestment Act
                   Most Recent Performance Evaluation (2012—2014), Office of the Comptroller of the Currency

     2017          Ranjana Clark, Most Powerful Women in Banking
                   American Banker Magazine

     2017          Top Lead Arranger for Clean-Energy and Energy-Smart Technologies Financing
                   Six of Last Eight Years, Bloomberg’s New Energy Finance League Table

     2018          Bloomberg Gender Equality Index

     2019          Corporate Equality Index
                   Earning a perfect score for the sixth consecutive year, Human Rights Campaign Foundation

                                                                                        Corporate Social Responsibility
                        Commitment to Communities
                                                                                         (CRA rating of outstanding)
 46,470 hours                        6,700+                              $41 billion                                       $11.2 billion
 Volunteer      hours3
              completed by           New businesses   created1           In total pledged commitments under                In environmentally sustainable
 MUFG employees in 2018                                                  our 5-year Community Service                      finance2
                                                                         Action Plan

40 million                                                               14%                                               $2.4 billion+
Families      served1                                                    Reduction commitment in                           In lending and investments to
(through access to food / other programs)                                greenhouse gas emissions                          support affordable housing2

1. As of 12/31/2016
2. As of 12/31/2018
3. Source: VolunteerMatch.com                                                         MUFG Americas Holdings Corporation Investor Presentation, 1Q19        16
Financial Summary for MUAH
This section only includes financials and other disclosures for MUAH and excludes
MUFG Americas operations outside of MUAH

                                                                                    17
2019 First Quarter MUAH Results

                                                                                                                                                              For the Three Months Ended
                                                                                                                                             March 31,                    December 31,                           March 31,
                             (Dollars in millions)                                                                                                2019                            2018                              2018
                             Results of operations:
                             Net interest income                                                                                           $                 783           $                  825            $                   825
                             Noninterest income                                                                                                              632                              573                                382
                             Total revenue                                                                                                                1,415                            1,398                              1,207
                             Noninterest expense                                                                                                          1,170                            1,051                              1,084
                             Pre-tax, pre-provision income                     1                                                                             245                              347                                123
                             (Reversal of) provision for credit losses                                                                                         38                               63                                  (2)
                             Income before income taxes and including noncontrolling
                             interests                                                                                                                       207                              284                                125
                             Income tax expense (benefit)                                                                                                      28                               31                                (42)
                             Net income including noncontrolling interests                                                                                   179                              253                                167
                             Deduct: Net (income) loss from noncontrolling interests                                                                             5                                4                                 (1)
                             Net income attributable to MUAH                                                                               $                 184           $                  257            $                   166

      Compared to the first quarter of 2018, net income increased by $18 million

      •     Total revenue was $1.4 billion, up $208 million or 17.2% from the first quarter of 2018 largely due to a $250 million increase in
            noninterest income, offset by a $42 million decrease in net interest income due to a decline in the net interest margin offset by
            an increase in earning assets.
      •     Noninterest income increased as a result of a nonrecurring loss on certain renewable energy investments of $164 million
            recorded in the first quarter of 2018 as a result of the TCJA and an increase in fees from affiliates from services provided to
            MUFG Bank, Ltd. under the master services agreement.
      •     Net interest margin decreased primarily due to an increase in funding costs partially offset by the favorable effect of noninterest
            bearing deposits in a rising rate environment.
      •     Earning assets increased largely due to increases in interest bearing deposits in banks, and residential mortgage, commercial
            and industrial, and home equity and other consumer loans.

1. Pre-tax, pre-provision income is total revenue less noninterest expense. Management believes that this is a useful financial measure because it enables investors and others to assess the Company's ability to generate capital to cover credit
   losses through a credit cycle
                                                                                                                                                    MUFG Americas Holdings Corporation Investor Presentation, 1Q19                                    18
MUAH Balance Sheet and Profitability Highlights as of Period End

•         $170.7 billion in total assets, of which MUB has $133.4 billion and MUSA has $33.9 billion
           • Assets comprised of high-quality mortgage / C&I loans ($88 billion) and highly liquid securities ($28 billion), among
               others
•         Strong deposit base ($93 billion) supported with wholesale funding

                                                                                                           As of Period End
                                                                                                                                                                               Compared to the previous quarter:
                                                                                    March 31,                 December 31,                    March 31,                      • Total assets increased $2.6 billion
(Dollars in millions)                                                                 2019                        2018                          2018                           driven by increased loans held for
Balance sheet (end of period)                                                                                                                                                  investment of $1.1 billion,
Total assets                                                                   $          170,707           $         168,100            $         157,310                     securities borrowed or purchased
Total loans held for investment                                                            87,587                      86,507                       81,400
                                                                                                                                                                               under repo of $0.5 billion, and
Total securities                                                                           28,216                      27,215                       27,301
Securities borrowed or purchased under repo                                                22,860                      22,368                       19,902
                                                                                                                                                                               cash and cash equivalents of $0.6
Trading account assets                                                                     10,889                      11,213                       12,565                     billion.
Total deposits                                                                             92,905                      90,979                       83,532
Securities loaned or sold under repo                                                       27,425                      27,285                       26,391
                                                                                                                                                                             • Loans held for investment
Long-term debt                                                                             17,335                      17,918                       14,085                     increased primarily due to growth
Trading account liabilities                                                                 3,896                       4,027                        3,874                     in the commercial and industrial
MUAH stockholders' equity                                                                  16,897                      16,508                       18,193                     and unsecured consumer loan
Performance ratios                                                                                                                                                             portfolios.
Net interest margin 1,2                                                                        2.06%                        2.26%                        2.32%               • Total deposits increased $1.9
Return on average assets 1                                                                     0.44                         0.67                         0.42                  billion substantially due to time
Return on average MUAH stockholders'
equity 1                                                                                       4.41                         5.83                         3.66                  deposits related to brokered
Return on tangible common equity 1,4                                                           5.76                         7.35                         4.69                  deposits and PurePoint Financial.
Efficiency ratio 3                                                                           82.67                        77.98                        89.84
Adjusted efficiency ratio 5                                                                  78.96                        72.47                        75.64
    1.   Annualized based on year to date activity
    2.   Net interest margin is presented on a taxable-equivalent basis using the federal statutory tax rates of 21% for 2018 and 2019
    3.   The efficiency ratio is total noninterest expense as a percentage of total revenue (net interest income and noninterest income)
    4.   Non-GAAP financial measure. Refer to our separate reconciliation of non-GAAP financial measures in our 10-Q for the quarter ended March 31, 2019
    5.   Non-GAAP financial measure. Refer to our separate reconciliation of non-GAAP financial measures in the Appendix for the quarters ended March 31, 2018 and 2019 and in our 10-K for the year ended December 31, 2018

                                                                                                                                                  MUFG Americas Holdings Corporation Investor Presentation, 1Q19               19
Positive Balance Sheet Growth Trends

                                        Earning Asset Mix1                                                                                            Loan Portfolio Composition2

                                       Earning Assets3 ($B)                                                                                                   Deposit Growth4 ($B)
                                                      +6.3%                                                                                                                   +10.7%
                                                         4                     5                     6
             3                     4

1.   Average balance for the quarter ended March 31, 2019. May not total 100% due to rounding
2.   Period-end total loans held for investment, including all nonperforming loans and purchased credit-impaired loans. May not total 100% due to rounding
3.   Average quarterly balances and growth rate may not total due to rounding
4.   Ending quarterly balances and growth rate may not total due to rounding
                                                                                                                                                    MUFG Americas Holdings Corporation Investor Presentation, 1Q19   20
Strong Deposit Base

                                         Regional Banking                                                                                                        Transaction Banking

    • Focus on growing core deposits with innovative new                                                                       • Focus on key customer segments, with improved
      products and promotions                                                                                                    customer segmentation and pricing strategies
    • Target nationwide customers via PurePoint to build                                                                       • Align product and platform build-outs to increase PxV and
      alternative funding source                                                                                                 drive core balance growth
       • Expand deposit and loan product offerings

                                  Deposit Breakdown ($B)                                                                          Major Deposit Share in Key California Locations1,2
                                                                                                                                Metropolitan Statistical Area (MSA) / State                                      Rank     Share (%)
                                                                                                                                Santa Maria-Santa Barbara, CA                                                       2         16.50
                                                                                                                                San Diego-Chula Vista-Carlsbad, CA                                                  3         14.21
                                                                                                                                Salinas, CA                                                                         5          8.97
                                                                                                                                Los Angeles-Long Beach-Anaheim, CA                                                  4          8.17
                                                                                                                                Fresno, CA                                                                          4          6.65
                                                                                                                                Oxnard-Thousand Oaks-Ventura, CA                                                    5          5.70
                                                                                                                                Sacramento-Roseville-Folsom, CA                                                     5          4.43
                                                                                                                                Riverside-San Bernardino-Ontario, CA                                                6          4.03
                                                                                                                                San Francisco-Oakland-Berkeley, CA                                                  7          2.53
                                                                                                                                San Jose-Sunnyvale-Santa Clara, CA                                                 10          2.21

                                                                                                                                Overall California                                                                    4        5.73

1. Source: SNL Financial as of 6/30/18, “Pro Forma” ownership which captures any known M&A or branch closure activity up to the current date, no deposit cap applied
2. The above balances do not include PurePoint deposits which are primarily placed with customers outside MUB's West Coast markets
                                                                                                                                                     MUFG Americas Holdings Corporation Investor Presentation, 1Q19                   21
Consumer Loan Portfolio

Consumer portfolio continues to exhibit strong credit quality

    Residential Mortgage Loan Portfolio                    Home Equity & Other Consumer Portfolio1
Period-end Loan Balances and Net Charge-offs ($MM)          Period-end Loan Balances and Net Charge-offs ($MM)

 1. Quarterly balances may not total due to rounding
                                                                   MUFG Americas Holdings Corporation Investor Presentation, 1Q19   22
Consumer Loans Performed Well Through the Crisis

Residential Mortgage Performance Trends                                                                                             Home Equity and Other Consumer
                  (30 days Past Due + in Foreclosure)                                     3
                                                                                                                                   Total Delinquency (30 Days + Past Due) 3,4

Residential Mortgage Portfolio as of March 31, 2019:
• 36% interest-only (non-amortizing)
       • 65% weighted average LTV1 for the I/O portfolio
 • No subprime programs or option ARM loans
 • Low delinquency rate due to focus on prime loans, high FICO scores, and low LTVs
 • 81% of the consumer portfolio has a refreshed FICO score of 720 and above2
 • 94% has an LTV less than or equal to 80%

1.   At origination
2.   Excluding loans serviced by third-party service providers and loans covered by FDIC loss share agreements, includes PCI loans
3.   Data Source: Consumer Lending Monthly Summary and Key Statistics; Source: Residential – Mortgage Bankers Association, Home Equity-American Bankers Association
4.   National (SA) is seasonally adjusted American Bankers Association data; Benchmark metrics are reported on a one quarter lag
                                                                                                                                          MUFG Americas Holdings Corporation Investor Presentation, 1Q19   23
Commercial Loan Portfolio

Commercial loan balance remains stable in 1Q2019; net charge-offs continue to illustrate strong credit quality

                                Commercial and Corporate Loan Portfolio
                          Period-end Loan Balances and Net Charge-offs (Recoveries) ($MM)

                                                                          MUFG Americas Holdings Corporation Investor Presentation, 1Q19   24
Commercial Real Estate Overview

Largely secured, California-focused commercial real estate-purposed loans1 with strong credit performance

                   Q1 2019 Property Type Breakdown                                                                                              Q1 2019 Geographic Distribution2

                                                                                                                                                                                          California
                                                                                                                                                                                            65%
                                             Secured 94%

                                                                      Commercial Real Estate Statistics
                                                                                                             December 31,                   March 31,                 March 31,
                                                 ($ MM)                                                         2018'                         2018                      2019
                                                 Commitments                                                  $    22,315                    $ 21,119                  $ 22,544
                                                     Commercial and Industrial                                                 3,878                   3,347                      3,835
                                                     Commercial Mortgage                                                     15,594                   14,689                    15,544
                                                     Construction                                                              2,843                   3,082                      3,166
                                                 Outstandings                                                              18,527                   17,851                    18,553
                                                     Commercial and Industrial                                                 1,580                   1,548                      1,580
                                                     Commercial Mortgage                                                     15,334                   14,468                    15,282
                                                     Construction                                                              1,613                   1,835                      1,691
                                                 Nonperforming Loans                                                              12                       16                        12
1. Commercial real estate-purposed loans are comprised of commercial mortgage loans, construction loans and C&I loans to borrowers with real estate-exposed businesses. Does not include CMBS in the investment or trading portfolios
2. Excludes loans not secured by real estate; subsets of California reported by Metropolitan Statistical Area (MSA); may not add to 100% due to rounding
                                                                                                                                              MUFG Americas Holdings Corporation Investor Presentation, 1Q19                            25
Asset Quality Trends

                 Nonaccrual Loans / Total Loans1,2                                                                           Net Charge-offs (Recoveries) / Average Loans1,4

                                                                                                          3                                                                                                                          3

     Criticized5 & Nonaccrual Loans / Total Loans                                                                                  Nonperforming Assets by Loan Type ($MM)

                                                                                                                                                                                                       3

                                                                                                                                                                                          1

                                                                                                                                                                                                     0.37%

                                                                                                                                                             0.25%         0.26%        0.25%
                                                                                                                                                0.22%

1.   Source: SNL Financial and company reports
2.   Total Loans for MUAH is based on Total Loans Held for Investment; Total Loans for Reference Banks' Average is based on gross loans which includes loans held for sale
3.   Reference Banks consist of 13 CCAR-filing public regional banks depicted on slide 3 plus the four largest U.S. money center banks. Reference Banks’ average based on reporting through April 26, 2019 (Source: SNL Financial)
4.   Annualized ratio
5.   Criticized loans held for investment reflect loans in the commercial portfolio segment that are monitored for credit quality based on
     regulatory ratings. Amounts exclude small business loans, which are monitored by business credit score and delinquency status                MUFG Americas Holdings Corporation Investor Presentation, 1Q19                         26
Strong Liquidity Position and Diverse Funding Mix
 • Strong liquidity position – as of quarter ended December 31, 2018, MUAH’s modified LCR ratio was 154% vs. 123% for
     core peers

 • Unpledged securities of $25.8 billion (as of 3/31/2019); ability to meet expected obligations for at least 18 months
   without access to funding

 • Key sources of funding consist primarily of customer deposits ($92.9 billion as of 3/31/2019), supplemented by
   wholesale funding ($26.0 billion as of 3/31/2019)
   • Diversified wholesale funding mix, including borrowings from the parent (Total Loss Absorbing Capacity debt),
      capital markets, and Federal Home Loan Bank (FHLB) of San Francisco
   • Unused FHLB capacity is $18.7 billion (as of March 31, 2019)

     MUAH Liquidity Coverage Ratio (As of 12/31/2018)                                                                                   Treasury Funding Profile (As of 3/31/2019)
                                                       Core peer (modified LCR)1                                        $ in billions
                                                       avg. 123%

1.   Core peer set are BBT, CFG, CMA, FITB, HBAN, KEY, MTB, RF, STI. CMA is not required to disclose LCR (as assets are under $100 billion)

                                                                                                                                              MUFG Americas Holdings Corporation Investor Presentation, 1Q19   27
High Quality Investment Portfolio
                                            Investment Portfolio1,2                                                  Commentary
                                                            ($ in billions)

                                                                                      •   Agency residential mortgage-backed securities
                                                                                          consist of securities guaranteed by a U.S.
                                                                                          government corporation, such as Ginnie Mae, or a
                                                                                          government-sponsored agency such as Freddie
                                                                                          Mac or Fannie Mae

                                                                                      • Commercial mortgage-backed securities are
                                                                                        collateralized by commercial mortgage loans and
                                                                                        are generally subject to prepayment penalties

                                                                                      • CLOs consist of structured finance products that
                                                                                        securitize a diversified pool of loan assets into
                                                                                        multiple classes of notes

                                                                                      • Other debt securities primarily consist of direct bank
                                                                                        purchase bonds, which are not rated by external
                                                                                        credit rating agencies
                                 Investment Portfolio Distribution2

1. Fair value of securities as of March 31, 2019 and December 31, 2018 respectively
2. Source: MUAH 10Q Filing as of March 31, 2019                                               MUFG Americas Holdings Corporation Investor Presentation, 1Q19   28
High Quality Securities Financing Portfolio (MUSA) as of 3/31/19

                            Securities Financing Maturity Profile                                                                          • Securities financing activity largely conducted
                                                                                                                                             through MUSA
                                                                                                                                           • Securities financing portfolio is primarily
                                                                                                                                             collateralized by high quality, liquid assets
                                                                                                                                               • Approximately 88% is collateralized by U.S.
                                                                                                                                                 Treasuries and Agency MBS and 12% is
                                                                                                                                                 backed by equities, credit and other
                                                                                                                                           • Robust risk management framework governs
                                                                                                                                             secured financing profile including guidelines
                                                1
                                                                                                                                             and limits for tenor gaps, counterparty
                                                                                                                                             concentration and stressed liquidity outflows

                   Assets                                                                         Liabilities

                                                                                                                                                     U.S. Treasury

                                                                                                                                                     Agency MBS

                                                                                                                                                     Corporate Bonds

                                                                                                                                                     Municipal and Other

                                                                                                                                                     Equities

1. Includes continuous maturities which include open trades and term evergreen transactions that are primarily used to fund inventory
                                                                                                                                        MUFG Americas Holdings Corporation Investor Presentation, 1Q19   29
Interest Rate Risk Management of Exposures Other Than Trading

                                                            Net Interest Income (NII) Sensitivity ($MM)

                                            +200
                                            bps
  Gradual parallel yield curve shift over
           12-month horizon

                                            -100
                                            bps

                  For additional information regarding estimates and assumptions used in our net interest income sensitivity analysis see “Market Risk
                  Management - Interest Rate Risk Management” in Part II, Item 7. “Management’s Discussion and Analysis of Financial Condition and
                  Results of Operations” in our 2018 Form 10-K
                                                                                                                                                     30
                                                                                          MUFG Americas Holdings Corporation Investor Presentation, 1Q19
Strong and High Quality Capital Base

MUAH's capital ratios exceed the average of the Reference Banks1

                                                                                                                         Reference
                                                                                                                          Banks'                       MUAH Capital Ratios
                                                                                                                         Average1
                                                                                                                          March 31,                 March 31,                December 31,
                           Capital ratios:                                                                                  2019                      2019                      2018
                           Regulatory:
                           Common Equity Tier 1 risk-based capital ratio                                                        10.53%                     13.95%                        13.96%
                           Tier 1 risk-based capital ratio                                                                      11.61                      13.95                         13.96
                           Total risk-based capital ratio                                                                       13.68                      14.60                         14.60
                           Tier 1 leverage ratio                                                                                   9.46                      8.70                          8.77
                           Other:
                           Tangible common equity ratio2                                                                           8.21                      7.96                          7.89

                  MUAH reports its regulatory capital ratios under the standardized approach of the U.S. Basel III rules.

1. Reference Banks consist of 13 CCAR-filing public regional banks listed on slide 3 plus the four largest U.S. money center banks. Reference Banks’ average based on reporting through April 23, 2019 (Source: SNL Financial)
2. Non-GAAP financial measures. Refer to our separate reconciliation of non-GAAP financial measures in our 10-Q for the quarter ended March 31, 2019 and in our 10-K for the year ended December 31, 2018

                                                                                                                                                 MUFG Americas Holdings Corporation Investor Presentation, 1Q19                  31
Internal TLAC1

MUAH has sufficient aggregate capital and debt to comply with TLAC requirements

TLAC requirements for MUAH due to MUFG's status as a single
point of entry G-SIB are:

    •      18.5% of RWA overall Internal TLAC requirement; minimum
           6% must be issued as eligible long-term debt

    •      Internal TLAC must be issued by MUAH to a foreign affiliate
           (MUFG Bank); internal TLAC instruments may not be issued
           to third party investors

    •      TLAC-eligible long-term debt contains a contractual
           conversion ("bail-in") trigger while remaining external debt
           will not

    •      Clean Holding Company requirements limit MUAH's external
           liabilities

MUFG is expected to be the external TLAC issuing entity for the
global organization

Note: MUAH continues to evaluate the impact of the NPR issued in
April 2018 by the Federal Reserve and OCC which is intended to
recalibrate the enhanced supplementary leverage ratio

1. "Total Loss-Absorbing Capacity, Long-Term Debt, and Clean Holding Company Requirements for Systemically Important U.S. Bank Holding Companies and Intermediate Holding Companies of Systemically Important
   Foreign Banking Organizations," Federal Register Vol. 82, No. 14, January 24, 2017; does not include FHLB balances                    MUFG Americas Holdings Corporation Investor Presentation, 1Q19         32
Strong Credit Ratings

   For the rating agencies, strong capital and conservative asset quality mitigate MUAH’s financial performance and a
   higher level of wholesale funding relative to peers

 Senior Unsecured / ST                         Moody’s                          S&P                          Fitch                                          Reference Banks’ Credit Ratings (3/31/19)
                                                                                                                                                                                Holding Company Ratings                          Bank Ratings

                                                                                                                                   Long-term ratings                      S&P          Moody's         Fitch           S&P         Moody's      Fitch
Mitsubishi UFJ                                     A1                            A-                            A                   U.S. Bancorp                            A+            A1            AA-             AA-            A1        AA-
Financial Group, Inc.
Parent
                                                   P-1                           -                             F1                  Wells Fargo & Company                   A-            A2             A+              A+            Aa2       AA-

                                                                                                                                   MUAH                                    A-            A2              A              A             A2         A

                                                                                                                                   BB&T Corporation                        A-            A2             A+              A             A1         A+

MUFG Bank, Ltd.                                    A1                            A                             A                   JPMorgan Chase & Co.                    A-            A2            AA-              A+            Aa2        AA

                                                                                                                                   PNC Financial Services                  A-            A3             A+              A             A2         A+
OpCo                                               P-1                          A-1                            F1
                                                                                                                                   M&T Bank                                A-            A3              A              A             A3         A

                                                                                                                                   Bank of America Corp.                   A-            A2             A+              A+            Aa2       AA-

                                                                                                                                   Comerica                               BBB+           A3              A              A-            A3         A
MUFG Americas Holdings                             A2                           A-                             A                   Fifth Third Bancorp                    BBB+          Baa1            A-              A-            A3         A-
Corporation                                         -                           A-2                            F1                  Citigroup Inc.                         BBB+           A3              A              A+            Aa3        A+
Intermediate Holding Co.
                                                                                                                                   KeyCorp                                BBB+          Baa1            A-              A-            A3         A-

                                                                                                                                   SunTrust Banks                         BBB+          Baa1            A-              A-           Baa1        A-

MUFG Union Bank, N.A.                             A2                            A(1)                          A                    Citizens Financial Group               BBB+           NR           BBB+              A-           Baa1       BBB+

(OpCo)                                            P-1                           A-1                           F1                   Huntington                             BBB+          Baa1            A-              A-            A3         A-

                                                                                                                                   Capital One Financial Corp.            BBB           Baa1            A-            BBB+           Baa1        A-

                                                                                                                                   Regions Financial Corp.                BBB+          Baa2          BBB+              A-           Baa2       BBB+

                                                                                                                                   Zions Bancorporation                   BBB+          Baa3           BBB            BBB+           Baa3       BBB
MUFG Securities                                                                  A                             A
Americas Inc.                                     N/R
                                                                                A-1                            F1
Broker Dealer

  1. On April 16, 2018, S&P revised MUAH and MUB’s outlook to positive from stable. The change in outlook is followed by S&P’s revision to the MUFG Group’s outlook to positive from stable which was a result of S&P revising the outlook on
     Japan’s long-term sovereign rating as a result of healthier economic prospects to positive from stable.
                                                                                                                                                      MUFG Americas Holdings Corporation Investor Presentation, 1Q19                                    33
2019 Capital Planning Cycle and 2018 Mid-Cycle DFAST Results

In February 2019, the FRB granted MUAH a one-year regulatory extension for participating in 2019 CCAR; however,
            MUAH is still subject to the U.S. Capital Plan rule and completed its Annual Capital Plan in April 2019

                                       In October 2018, MUAH submitted its Mid-Cycle DFAST results to the FRB
  The Mid-Cycle DFAST stress test results demonstrate MUAH's capital cushion in excess of regulatory minimums

    •       The 2018 BHC Severely Adverse scenario is characterized by a growing U.S. deficit, U.S. corporate debt
            defaults, and technology sector weakness

                                                        2018 Mid-Cycle BHC Severely Adverse Scenario Results
          MUAH Actual and Projected Capital Ratios Using Dodd-Frank Capital Actions

                                                                                       Actual                                     Stressed Capital Ratios                                      Regulatory
                                                                                    June 30, 2018                                                                                              Post-Stress
                                                                                                                   September 30, 2020                         Minimum1                         Minimums2
          Common Equity Tier 1 Capital Ratio                                                           16.2%                              13.1%                               13.1%                          4.5%
          Tier 1 Risk-based Capital Ratio                                                              16.2%                              13.1%                               13.1%                          6.0%
          Total Risk-based Capital Ratio                                                               17.1%                              14.6%                               14.6%                          8.0%
          Tier 1 Leverage Ratio                                                                        10.3%                                7.7%                                7.7%                         4.0%
          MUAH Actual and Projected Risk-Weighted Assets (RWA)
          ($ in billions)                                                                      Actual – June 30, 2018                                         Projected – September 30, 2020
          Risk-Weighted Assets (Standardized)                                                                $99.4                                                                   $92.4

    1   Represents minimum projected capital ratio from 3Q18 through 3Q20
    2   Minimum post-stress regulatory ratios as defined in the Comprehensive Capital Analysis and Review 2018 Summary Instructions for LISCC and Large and Complex Firms, February 1, 2018

                                                                                                                                            MUFG Americas Holdings Corporation Investor Presentation, 1Q19          34
Appendix

           35
Reconciliation of Non - GAAP Measures - Adjusted Efficiency Ratio

                                                                                          As of Period End

                                                       March 31,         December 31,       September 30,                     June 30,                    March 31,
(Dollars in millions)                                    2019                2018               2018                            2018                        2018

Noninterest expense (a)                            $        1,170    $          1,051     $              1,059         $              1,083         $          1,084

Less: Costs associated with services provided to
  MUFG Bank, Ltd. branches in the U.S.                        310                235                        270                          255                     241
Noninterest expense, as adjusted (b)             $            860    $           816      $                 789        $                 828        $            843

Total revenue (c)                                  $        1,415    $          1,398     $              1,458         $              1,421         $          1,207

Less: Fees from affiliates for services provided
  to MUFG Bank, Ltd.'s branches in the U.S.                   326                 303                      292                          278                      256
Less: Impact of TCJA                                           —                   —                        —                            —                      (164)
Total revenue, as adjusted (d)                     $        1,089    $          1,095     $              1,166         $              1,143         $          1,115

Efficiency ratio (a)/(c)                                    82.67%              75.20%                   72.59%                       76.18%                   89.84%
Adjusted efficiency ratio (b)/(d)                           78.96%              74.55%                   67.61%                       72.39%                   75.64%

The adjusted efficiency ratio is a non-GAAP financial measure. Management believes adjusting the efficiency ratio for the
fees and costs associated with services provided to MUFG Bank, Ltd. branches in the U.S. enhances the comparability of
MUAH's efficiency ratio when compared with other financial institutions. Management believes adjusting revenue for the
impact of the TCJA enhances comparability between periods.

                                                                                         MUFG Americas Holdings Corporation Investor Presentation, 1Q19                 36
MUAH Unsecured Long-Term Debt Outstanding and Maturity Schedule1

As of March 31, 2019
                                                                                        MUFG Americas Holdings Corp.
                                                                 Senior                                                                       Subordinated                          Preferred
                     External                                                     Issued to MUFG Bank                  External               Issued to MUFG Bank
$400MM 3.50% Notes due 6/2022                              $1,625MM Floating Rate Term Loan due 12/2021                   --                                                           --
$400MM 3.00% Notes due 2/2025                              $3,250MM Floating Rate Term Loan due 12/2022
                                                           $1,625MM Floating Rate Term Loan due 12/2023
                                                           €21.0MM Floating Rate Term Loan due 12/2023
                                                                                           MUFG Union Bank, N.A.
                                                                 Senior                                                                       Subordinated                          Preferred
                     External                                                     Issued to MUFG Bank                  External               Issued to MUFG Bank
$500MM 2.25% Notes due 5/2019                                                                                             --                                                           --
$1000MM 3.15% Notes due 4/2022
$300MM Floating Rate Notes due 3/2022
                                                                                   Other MUAH Subsidiaries
                                                                 Senior                                                                    Subordinated                             Preferred
                     External                                         Issued to MUFG Bank / Affiliates                 External        Issued to MUFG Bank / Affiliates
                           --                              $250MM Floating Rate Term Loans due 12/2020 - 5/2021           --                                                           --
                                                           $223MM Fixed Rate Term Loans due 6/2019 - 5/2024

                                                                        Long-Term Debt Redemption Schedule - Next 10 Years

1. Excludes nonrecourse debt, junior subordinated debt, FHLB Loans and capital leases
                                                                                                                   MUFG Americas Holdings Corporation Investor Presentation, 1Q19               37
Contacts

                                      Contacts
                Alan Gulick                                  Marcy Morita
            Managing Director                                    Director
              425-423-7317                                   415-273-2452
       alan.gulick@unionbank.com                      marcy.morita@unionbank.com

                                    Investor Relations
                          MUFG Americas Holdings Corporations
                                      212-782-6872
                          DebtCapitalMarketsIR@unionbank.com

                                                      MUFG Americas Holdings Corporation Investor Presentation, 1Q19   38
You can also read