National Assessment of Education Progress (NAEP) 2020 Overview and Update - Kim Ackermann Texas NAEP State Coordinator
←
→
Page content transcription
If your browser does not render page correctly, please read the page content below
National Assessment of Education Progress
(NAEP) 2020 Overview and Update

Kim Ackermann
Texas NAEP State Coordinator
 N AT I O N A L A S S E S S M E N T O F E D U C AT I O N A L P R O G R E S S
Agenda What is NAEP? Overview of 2019-2020 Program Latest Results – 2019 NAEP Calendar and Design Changes International Assessments Resources
3
What is NAEP?
The only assessment that
measures what U.S. students
know and can do in various
subjects across the nation,
states, and in some cases, urban
districts.
NAEP results are released as
“The Nation’s Report Card”
www.nationsreportcard.gov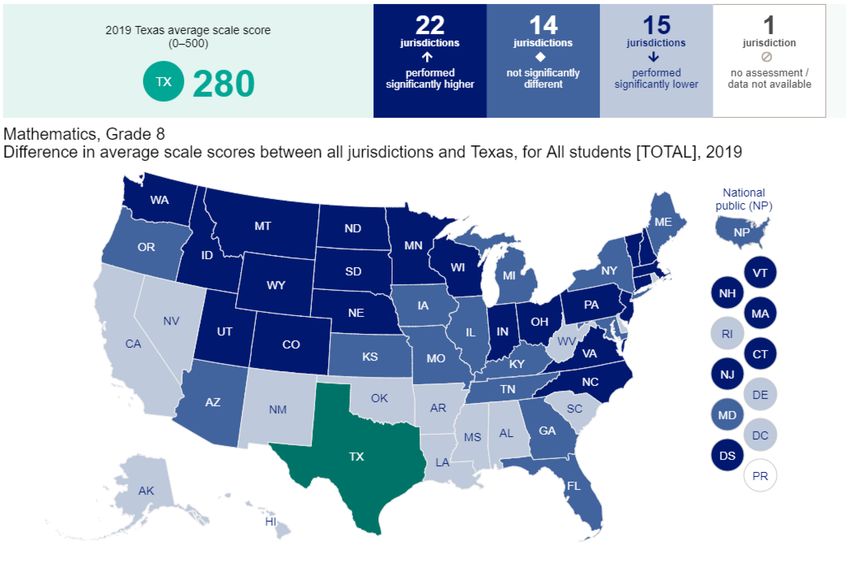
NAEP Subjects

Civics                  Economics                     Geography               U.S. History

                                        State level
                                          results
                                         available
          Mathematics                     Music                     Reading

Science             Technology &                      Visual Arts               Writing
                 Engineering Literacy
What does NAEP measure?

    Overall student performance
    for key demographic groups

    Change over time

    Differences between the
    nation, states, and urban
    districts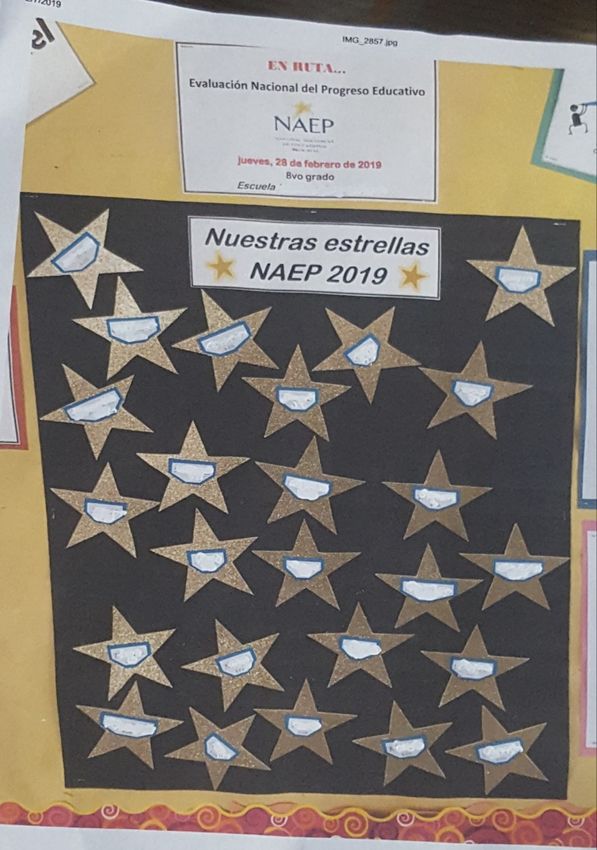
6
NAEP Jurisdictions
NAEP produces jurisdiction-level results for…
– All 50 states,
– Department of Defense Education Activity
– District of Columbia,
– Puerto Rico, and
– 27 urban districts
o TUDAs include Austin ISD, Dallas ISD, Houston ISD
and Fort Worth ISD
The only Texas districts that receive results
NAEP School and Student Selection

1. Identify all eligible
                            2. Sample schools                        3. Sample students
       schools

                           Past participation has no bearing on future selection
8

    All digitally based assessments

                        Most NAEP assessments are
                            delivered digitally!
2019

NAEP 2019-2020 Program
       Overview
10

                      NAEP 2019-2020 Program

                                        Long-Term Trend National Assessments

                        Age 13                   Age 9                   Age 17
                   13 years old as of       9 years old as of      17 years old as of
     Age ranges        1/1/2020                1/1/2020               10/1/2020
                    Jan–Dec 2006             Jan–Dec 2010         Oct 2002–Sep 2003

      E-Filing                                                     Jan 2–Jan 31, 2020
     Windows*     Aug 19–Sep 20, 2019     Oct 28–Nov 22, 2019

     Assessment
      Windows     Oct 14–Dec 20, 2019     Jan 6–Mar 13, 2020     Mar 16–May 22, 2020

                      Three 15 minute subject matter blocks and 5 minute student
                                             questionnaire
     Assessment   Approximately 90 minutes, each student takes one subject only, paper-
       Details                                   based
                              Target sample size ~ 50 students per school
                                *E-Filing windows are subject to change
NAEP 2019-2020 Program
The only paper
based NAEP
assessment
Long-Term Trend (LTT)
Paper-based assessment of mathematics and reading
Nationally representative sample of 9-, 13- and 17-
year olds (age-based)
Three distinct testing windows:
– Age 13: October 14 - December 20, 2019
– Age 9: January 6 – March 13, 2020
– Age 17: March 16 – May 22, 2020What is Long-Term Trend? Measures students’ educational progress over a (really) long period of time – Trends back to 1971 for reading – Trends back to 1973 for mathematics Typically every 4 years, but not since 2011-2012
13
Long-Term Trend 2019-2020
Approximate # of Public Schools & Students
Age 9: 430 schools, 14,400 students (50 TX )
Age 13: 440 schools, 14,400 students (55 TX)
Age 17: 490 schools, 14,400 students (55 TX)
Approximately 50-55 students per school
Grand total: 1,360 schools, 43,200 students2019 Texas NAEP 2019 Results
Sample Sizes (National Public)

                       Mathematics                                           Reading

                       Schools               Students               Schools              Students
 Grade 4               7,810               143,600                  7,830               144,700
 NP & TX                360                 7,200                    360                 7,100
 Grade 8               6,560               142,200                  6,560               138,100
 NP & TX                240                 7,100                    240                 6,900

NOTE: Student sample sizes rounded to the nearest hundred. School sample sizes rounded to the nearest ten.
Number of schools above includes math and reading only. Total schools selected for 2019 NAEP in Texas is
1,037
NAEP Administration Six week period Each student assessed in one subject Students take a small portion of the item pool Accommodations provided as necessary for – students with disabilities – English language learners
NAEP Results
Scale Scores
– Numeric scale
– 0 − 500 on
mathematics and
reading assessments
– Cannot be compared
across grade levels or
content areas
Achievement Levels
– Categorical scale
o Below NAEP Basic
o NAEP Basic
o NAEP Proficient
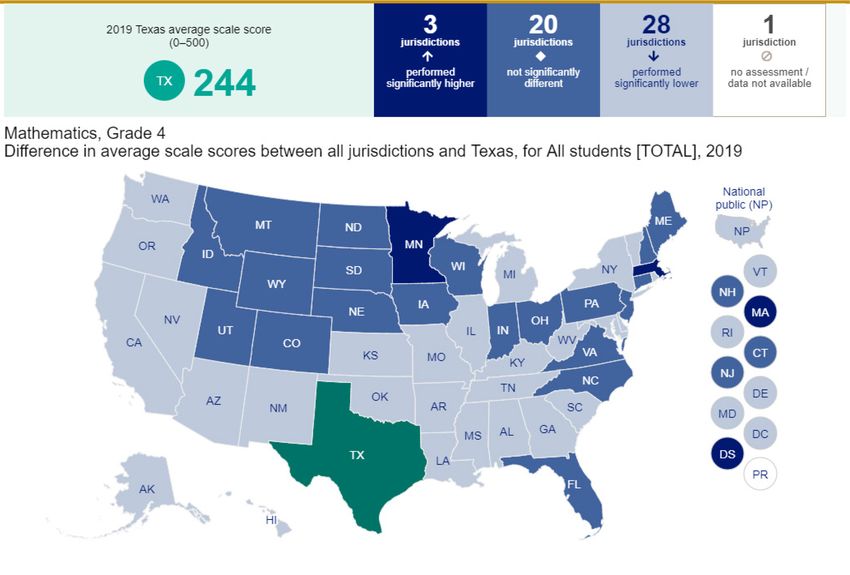
o NAEP AdvancedGrade 4 Mathematics Results Content Areas: Number sense, properties and operations Measurement Geometry and spatial sense Data analysis, statistics and probability Algebra and functions
Scores higher than National
Public

260                                                           The 3-point increase in Texas
                                          Grade 4            scores from 2017 to 2019 was
                                                               not statistically significant
                                                                                                NAEP
250                                                                                            Proficient
                                                                                                  249
                                                               244*                  244*
            242*   242*                  241         242
                              240                                         241
240 237*
                                         240         241                             240
                   239        239                               240       239
            237
230   234
                                                             Unlike 2017, the average Texas
                                                           score in 2019 (244) is statistically
                                                            higher than the average score of
220                                                             the national public (240).

                                                                                                  NAEP
                                                                                                  Basic
210
      '03   '05    '07         '09        '11        '13        '15        '17        '19

                              National Public            Texas
                         *Significantly different (p < .05) from NP.
Achievement Levels are higher
From 2017 to
2019, Texas saw
improvements
across all
achievement
levelsTexas’ African American
students are at the top!
The only decrease
across reporting groups
Grade 4 – Scale score differences since 2017 was within Students
With Disabilities
Students English
All Eligible for
Male Female with language
Students NSLP
Disabilities1 learners
Texas 3 4* 1 3 3 3
National
Public 1* 2* 1* 2*
Higher Lower No change — Not available
Texas’ Black American
Asian/
students rank 2nd Indian/
White Black Hispanic Pacific
in the nation! Alaska
Islander
Native
Texas 1 4 2 10 —
(4th/8th) (2nd/6th) (6th/5th)
National
Public 1 1 2* 3
1Students with disabilities excluding those with a 504 plan. *Significantly different (p < .05) from 2017.State Comparisons Grade 4
Only three states performed
significantly higher than TX
Among commonly referenced
13th/ peers, CA, IL, and NY performed
19th significantly lower than TX, while
FL was not significantly differentGrade 8 Mathematics Results Content Areas: Number sense, properties and operations Measurement Geometry and spatial sense Data analysis, statistics and probability Algebra and functions
Scores remain unchanged

310                                        Grade 8

                                                               The 2-point decrease in Texas      NAEP
300
                                                               scores from 2017 to 2019 was      Proficient
                                                                 not statistically significant      299
                                         290*
290                                                  288*
                   286*      287*
                                                                 284*
            281*                                                               282
                                                                                          280
280   277                                 283         284
                              282                                 281          282        281
                   280
            278                   Historically, Texas has been significantly
      276
                                   above the national average. This year,
270
                                   like 2017, Texas was not significantly
                                      different from the national public.
                                                                                                  NAEP
                                                                                                  Basic
260
      '03   '05    '07         '09        '11          '13         '15         '17         '19

                              National Public             Texas
                         *Significantly different (p < .05) from NP.
Achievement Levels are lower
From 2017 to
2019, Texas saw a
decrease in
Advanced and
Proficient studentsMost reporting groups see score
declines
The only increase across
reporting groups was
Grade 8 – Scale score differences since 2017 within Students With
Disabilities
Students English
All Eligible for
Male Female with language
Students NSLP
Disabilities1 learners
Texas 2 4 2 1 4
National
Public 1* 2* 1 1 2
Higher Lower No change — Not available
Texas’ Black students American
rank 7th in the
Asian/
Indian/
nation despite small White Black Hispanic Pacific
Alaska
score decrease. Islander
Native
Texas 4 1 2 6 —
(18th/7th) (7th/7th) (16th/8th)
National
Public 1 1 1 5
1Students with disabilities excluding those with a 504 plan. *Significantly different (p < .05) from 2017.State Comparisons Grade 8
TX remains in line
with comparison
23rd/
states NY, FL, IL and
25th
above CAGrade 4
Reading
Results
Content Areas:
Understanding written text
Developing and interpreting meaning
Using meanings as appropriate to the type of text,
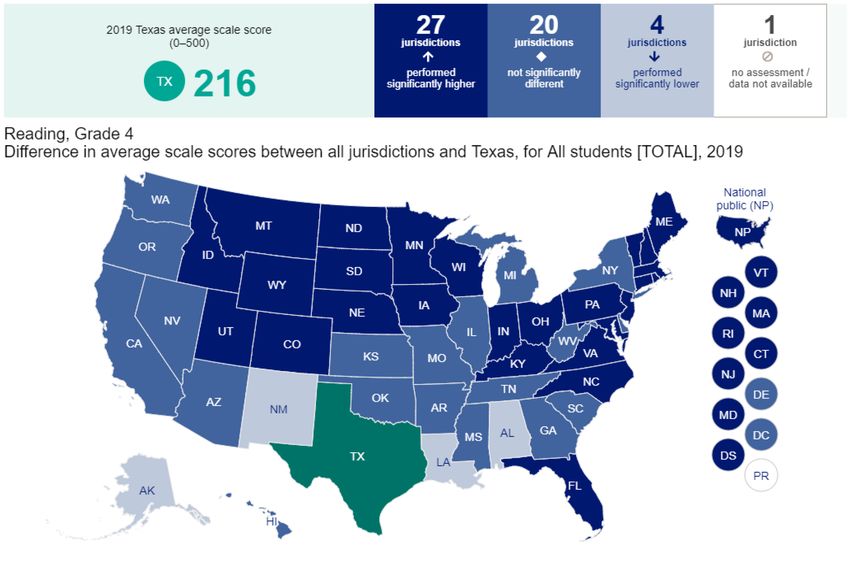
purpose and situationScore flatten, but remain lower
than NP
250 Grade 4
240 NAEP
Proficient
238
Since 2013, Texas has
continued to be statistically
230 lower than the national public
221 221 221
220 220 220 219
220 216 217
219 220 219 218 218*
217* 216*
215 215*
210
NAEP
The 1-point increase in Texas Basic
scores from 2017 to 2019 was
not statistically significant
200
'03 '05 '07 '09 '11 '13 '15 '17 '19
National Public Texas
*Significantly different (p < .05) from NP.Achievement levels show
improvement
From 2017 to
2019, Texas saw
an increase in
Advanced and
Proficient studentsSome reporting groups see score
increase
Students with
Disabilities
Grade 4 – Scale score differences since 2017 decrease across
TX and nation
Students English
All Eligible for
Male Female with language
Students NSLP
Disabilities1 learners
Texas 1 1 4 1 4 2
National
Public 2* 2* 1 1* 3* 2*
Higher Lower No change — Not available
American
Texas’ White & Asian/
Indian/
Hispanic students White Black Hispanic Pacific
Alaska
move up in the Islander
Native
ranks
Texas 1 5 2 7 —
(14th/23rd) (14th/9th) (27th/32nd)
National
Public 2* 2* 1 1
1Students with disabilities excluding those with a 504 plan. *Significantly different (p < .05) from 2017.State Comparisons Grade 4
43rd/ TX joins IL, NY and CA with
46th weakness in Reading resultsGrade 8
Reading
Results
Content Areas:
– Understanding written text
– Developing and interpreting meaning
– Using meanings as appropriate to the type of
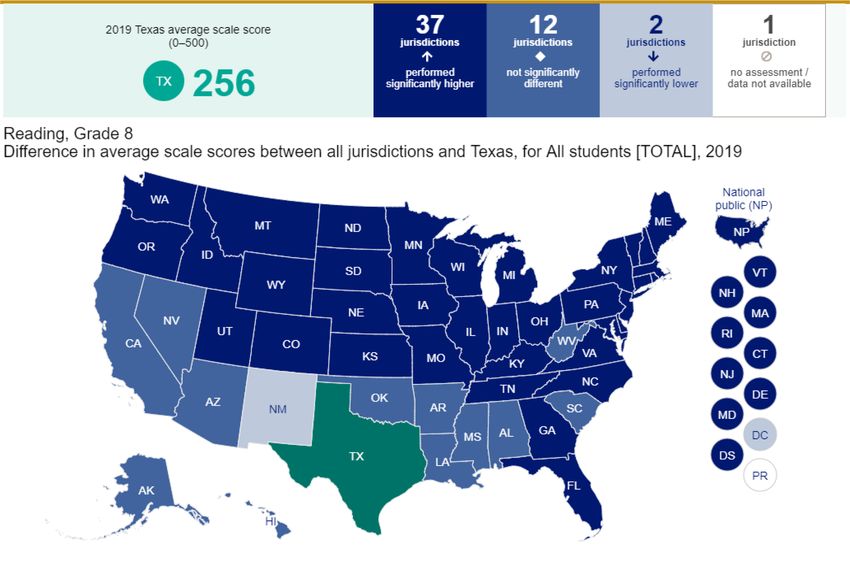
text, purpose and situationSignificant decline in Texas and
the Nation
290 Grade 8
NAEP
280 Proficient
Texas has been statistically lower than 281
the national average since 2011, with a
widening gap.
270
266 265
264 264
261 262 262
260 261
260 264*
261 260 261* 261* 260*
259* 258*
256*
There was a statistically
250
significant decline in Texas
scores from 2017 to 2019
NAEP
Basic
240
'03 '05 '07 '09 '11 '13 '15 '17 '19
National Public Texas
*Significantly different (p < .05) from 2019.Declines seen across achievement
levels
From 2017 to
2019, the number
of Texas students
below NAEP Basic
increased from
29% to 33%Decline across groups
Significant decline in
Grade 8 – Scale score differences since 2017 Students with
Disabilities
Students English
All Eligible for
Male Female with language
Students NSLP
Disabilities1 learners
Texas 4* 6* 3 5* 10* 6
National
Public 3* 4 2 4* 4* 5*
Higher Lower No change — Not available
Significant American
Asian/
decline in Texas Indian/
White Black Hispanic Pacific
Black students Alaska
Islander
Native
Texas 4 9* 4 1 —
(41st/37th) (35th/21st) (31st/31st)
National
Public 3* 4* 4* 4
1Students with disabilities excluding those with a 504 plan. *Significantly different (p < .05) from 2017.State Comparisons Grade 8
47th/
42nd TX is in line with CA, but
below IL, NY, and FLTrial Urban District Assessment (TUDA) Results
27 participating TUDA districts
in 2019

            NOTE: DCPS = District of Columbia Public Schools.
MATHEMATICS
GRADE 4
Scores
increase in
5 and
decrease
in 1
district
compared
to 2017
TX TUDA’s
scores
were
unchangedMATHEMATICS
GRADE 8
Scores
increase in
4 and
decrease in
3 districts
compared to
2017
Austin and
Houston’s
scores
remained
unchanged.READING
GRADE 4
Scores
decrease
in 3
districts
compared
to 2017
TX TUDA’s
scores
were
unchangedREADING
GRADE 8
Scores
increase in
1 and
decrease in
11 districts
compared to
2017
Fort Worth,
Dallas and
Austin
experienced
declinesReflections on the NAEP 2019
Administration45
NAEP 2019 Scale
Conducted assessments in 19,617 schools
Assessed approximately 1.0 million students
Hired 5,125 field staff to conduct the
assessments46
Success Stories from the Field
Overall, assessments went very well
No systematic technical issues that impacted data
collection
Positive reactions from school staff and students47
Success Stories from the Field
Traveling to Hooper Bay, AK48
Success Stories from the Field
Snow in Japan49
Success Stories from the Field
Wyoming50
Success Stories from the Field
Stars in Puerto RicoNAEP Schedule and Design
Change
51NAEP Priorities and Goals
Legislation and Governing Board policies require:
– Administering biennial Reading and Mathematics
assessments in grades 4 and 8
– Supporting the expansion of district participation
– Reporting comparable and independent measures of student
achievement across time
– Ensuring assessments reflect the modern expectations of
what students know and can doKey Themes in 2019-2029 Schedule Maintaining high quality assessments for core subjects; assessing fewer subjects overall to focus on nation’s needs Focusing on updated frameworks, notably Reading and Math in 2025 Adding more voluntary state and TUDA data in later years, based on Board priorities and stakeholder input
54

     Current Schedule: 2020-2024                       New Schedule: 2020-2024
     Year   Subject           National   State TUDA    Year   Subject              National State TUDA
     2020   Long-term Trend   ~                        2020   Long-term Trend      ~
     2021   Reading           4, 8       4, 8   4, 8   2021   Reading              4, 8     4, 8 4, 8
            Mathematics       4, 8       4, 8   4, 8          Mathematics          4, 8     4, 8 4, 8
            Writing           4, 8, 12   __8
                                                              U.S. History         __8
                                                              Civics               __8
     2022   U.S. History      __8, 12                  2022
            Civics            __8, 12
            Geography         __8, 12
            Economics         ____12
            TEL               __8, 12
     2023   Reading           4, 8, 12   4, 8   4, 8   2023   Reading              4, 8, 12   4, 8    4, 8
            Mathematics       4, 8, 12   4, 8   4, 8          Mathematics          4, 8, 12   4, 8    4, 8
            Science           4, 8, 12   4, 8   4, 8          Science              __8
                                                              TEL                  __8
            Transcript Studies ~                              Transcript Studies   ~

     2024   Long-term Trend ~                          2024   Long-term Trend      ~
            Arts             __8                                                                 54
            Foreign Language ____12
55
Summary of Updated Schedule
Similarities
Notable Differences
Reading and Mathematics
assessment conducted every No assessments in Economics,
other year Geography, Arts, or Foreign
Language
Representation at National,
State, and TUDA for Reading Postponement of Writing
and Mathematics grades 4 and Grade 12 assessed only for
8 Reading and Mathematics
U.S. History, Civics, Science, (2023) and U.S. History and
and Technology and Civics (2029)
Engineering (TEL) (with shifts
in timing, grades, and levels)56
Assessment Design Changes
NAEP traditionally assessed students in one subject
with two cognitive blocks.
Starting in 2021, NAEP will assess students in two
subjects with three cognitive blocks: two blocks of
one subject and one block of another subject.
This means around 30 minutes more of testing time
for each individual student, but also fewer students
and schools needed in our overall samples.
By assessing two subjects at once, we open the
possibility to report performance relationships across
subjects.57
New Assessment Block Design
2-Block 3-Block
Student takes: Student takes:
Subject OR Subject Subject OR Subject
A B A B
By 2021 Subject Subject
Subject Subject
A B A B
Break Break
Survey Survey
Subject Subject
B A
Survey Survey58
NAEP’s Block Design Implications
Considerations
Current 2-block design New 3-block design
Blocks
2 subjects, 3 blocks
1 subject, 2 blocks 90 minutes for blocks, 5
Time minute break; 15 minute
60 minutes for blocks; survey
15 minute survey 1 per school; ~40 students
Sessions
2 per school; ~25 ~A third fewer students
Sample size and ~2,000 fewer schools
students each
More individual
Up to 150,000 students assessment time but fewer
and 8,000 schools students, fewer schools,
fewer sessions, lower costSubject Pairings
Year Subject Pair Grade
2021 Mathematics and Reading 4&8
2021 Civics and U.S. History 8
2023 Mathematics and Reading 4, 8 & 12
2023 Science and Technology and Engineering 8
LiteracyInternational Studies Update
Why does the U.S. participate in
international studies?
For international benchmarking
– How does U.S. performance compare with other
countries?
– How do U.S. states compare with other
countries and education systems?
Broaden our understanding of education
– What does schooling look like in other
countries? What is possible?
Improve schooling
– What makes some systems successful?
– What is done (or not done) in high-performing
systems?
– What can be adopted or adapted in the U.S.?NCES international studies across the lifespan
High Adults
Middle School • Literacy
School • Reading
• Numeracy
• Problem Solving
Early Elementary • Mathematics
• Mathematics • Outcomes in
• Science employment,
Childhood • Reading
• Science
• Financial literacy income,
education, health
• Teachers and
teaching • Collaborative
• Mathematics
• Emergent Literacy problem solving
• Emergent • Science • Computer and
information • Advanced
Numeracy • Online Reading mathematics and
literacy
• Pro-social Skills physics
• Self-regulation
IELS PIRLS, TIMSS TIMSS, ICILS, PISA, TIMSS PIAAC
TALIS
What have we learned?Five lessons we’ve learned from
international studies
1. American students do better in reading and
science than mathematics, compared to their
international peers, at all grade levels
2. Other countries are improving faster than the
United States.
3. Our top performing states are among the best
education systems in the world, but our lowest
performing states struggle to be competitive
globally.Five lessons we’ve learned from
international studies
4. In terms of numbers, the U.S. has more high-performing
students than other countries, but, in terms of
percentages, other countries have larger percentages of
high-performing students.
5. Millennials, the most highly educated generation in U.S.
history, have generally low skills compared with
international peers.More Information… Access all results from the NCES International Activities Program website: nces.ed.gov/surveys/international/
NAEP Resources

https://www.nationsreportcard.gov/data_tools.aspx
Contact Information
  Questions   or Concerns?

– Texas Education Agency – Student Assessment
      – Kim Ackermann, NAEP Coordinator
      – Kim.Ackermann@tea.texas.gov
      – 512-463-9536

– www.mynaep.com ( MySchool Web Site)

– NAEP Help Desk 1-800-283-6237 or
  naephelp@westat.com Monday through Friday
  between 8 a.m. and 5 p.m. ET.
You can also read