Net Merit 2021: Frequent Questions - Council on Dairy Cattle ...
←
→
Page content transcription
If your browser does not render page correctly, please read the page content below
June 7, 2021

           Net Merit 2021: Frequent Questions
Genetic indexes have been provided for several decades in the U.S. to rank dairy animals based on their
combined merit for economically important traits. The Council on Dairy Cattle Breeding (CDCB) has published
four lifetime merit indexes for some time, which offers alternatives for producers to choose the index most
appropriate for their herd management and milk pricing situation. These alternatives are Net Merit (NM$), Cheese
Merit (CM$), Fluid Merit (FM$) and Grazing Merit (GM$). Each index incorporates the genetics of about 45
individual traits and weights those traits by their economic value. Sufficient weight is placed on each so nearly all
traits have a reasonable opportunity to be improved.

The revisions to Net Merit in August 2021 are the most significant in a long time. Three new traits will be
incorporated into the indexes, and important changes will be made in the parameters for existing traits. These
new traits are Feed Saved (FS), Early First Calving (EFC), and Heifer Livability (HLIV).

            Feed
            Saved
                                                Better          Better                   Maximum
                          Heifer              health and         feed
                        Livability
                                                                                          lifetime
                                              growth of       efficiency
                                                calves         of cows
                                                                                        profitability
          Early First
           Calving

             New traits                       Expanded goal                         Same target
Feed Saved (FS), launched by CDCB in December 2020, represents an important factor in herd profitability.
Selection of more efficient cows has already been achieved indirectly by including correlated traits in NM$. Direct
selection on FS accelerates the genetic progress that can be made to enhance herd profit. Heifer Livability (HLIV)
and Early First Calving (EFC) focus on improving health and growth of young females. Direct improvement in
calves and heifers was previously limited in Net Merit.

Having genetic evaluations for dozens of traits make it clear that composite selection indexes are almost a
necessity. Screening animals independently for individual traits will never achieve the economic gain possible
through use of a well-constructed composite index, and Net Merit is the most complete selection index available.

Net Merit 2021: Common Questions and Answers
Q1: How should the new numbers be interpreted?
The lifetime merit indexes rank dairy animals based on their combined genetic merit for all the economically
important traits being published. These numbers represent the differences in profit (i.e., income minus expenses)
expected from offspring of individual animals during their lifetime in the typical U.S. herd. An advantage in NM$ of
$1000 means that the offspring of the higher-ranking animal is expected to provide $1000 more profit to the
producer than the offspring of the animal to which she is being compared. All cows born in 2015 are forced to
average zero within each merit index, and this sets the bases to which all animals are compared. Then, producers
choose the index – net merit, cheese merit, fluid merit or grazing merit – that is most appropriate for their herds.
Q2: What is the expected range of NM$ PTA?

                                           $460       Average Rel = 79.1%

                                              $554      Average Rel = 74.8%

 -1000          -500            0           500             1000           1500
                                 NM$ PTA (US$)
                              NM$2018       NM$2021

The figure above shows the distribution of NM$ Predicted Transmitting Abilities (PTA) for A.I. bulls, comparing
NM$2018 and NM$2021 using April 2021 evaluation results. It clearly shows that NM$2021 has a wider
distribution (larger variance), and a higher mean PTA ($554, compared with the previous mean of $460). As
expected, the inclusion of residual feed intake (RFI), which is a trait with high economic value and low average
reliability made the NM$ mean reliability decrease from 79.1% to 74.8% among the A.I. bulls.

Q3: How does the new NM$ correlate with the previous NM$?
The correlation between NM 2021 and the 2018 version is high (0.981). Correlations between the current and
previous versions of the other three merit indexes can be expected to be similar.

Q4: Why is NM$ expressed differently than it used to be?
Previous versions of merit indexes reported relative values using the standard deviation (SD) of true transmitting
abilities (TTA) for a hypothetical unselected population. The updated 2021 versions report relative emphases
using the standard deviations of the PTAs of young bulls. The SD of TTA for the 2021 merit indexes are now
estimated at $234, whereas $197 was used in the 2018 version. Because the variation is estimated to be 20%
larger than before, the range in the merit indexes of both males and females will also be larger.

Economic Weights
Q5: How are the economic weights calculated?
Tremendous effort goes into determining the contribution and costs related to each trait. The individual numbers
suggested for the indexes are drafted by USDA’s Animal Genomics Improvement Laboratory (AGIL) based on the
best research results available. AGIL recommendations are reviewed by CDCB’s Genetic Evaluation Methods
group and Producer Advisor Committee, by others in the industry, and lastly by the CDCB Board of Directors. The
economic weights are detailed in the USDA AGIL paper, Net Merit as a measure of lifetime profit: 2021 revision,
prepared by VanRaden et al. Because there are genetic relationships of considerable strength between many of
the traits, considerable effort needs to be directed against including (effectively) the same traits more than once.
The comprehensive accounting for correlated relationships is a leading advantage of the CDCB indices like Net
Merit, compared to most selection indexes developed by other organizations.

Q6: Is there a difference between the relative economic value and relative emphasis given to each trait?
The main distinction between relative economic value and relative emphasis is that the amount of available data
influences these definitions differently. The relative emphasis (the trait’s contribution to animal ranking in the NM$
scale) is a new way of expressing the index, in contrast to the relative economic value that had been previously
published (the actual economic importance of the trait). Relative emphasis indicates that traits are not estimated
with the same reliability and have
different ranges of genetic variation,
                                              Relative Economic Value              Relative Emphasis
and this is beneficial particularly when
adding new traits with high economic          Reflects the actual economic         Show trait’s contribution to ranking
importance and low reliability, such as       importance of the trait              of the animal in the NM$ scale
Feed Saved.
Q7: How does cows’ maintenance costs affect Feed Saved, and why have these costs been updated?
Dairy cows range between 900 and 1600 pounds, and we know that maintenance costs are higher for the larger
animals. About one-third of the total feed cost goes toward keeping a cow healthy and two-thirds toward
supporting her milk production. Feed requirements for maintenance had not been reexamined for decades. More
accurate data became recently available because of the thousands of cows on feeding trials, primarily at
university research herds. The more accurate figures now available need to be incorporated into feeding
recommendations nationally and are being used in the August 2021 merit indexes.
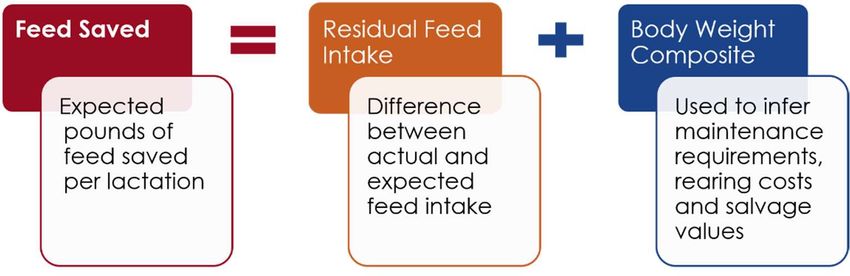
Q8: What are the differences between Net Merit, Cheese Merit, Fluid Merit and Grazing Merit?
The four merit indexes differ in the emphases assigned to the individual traits, and particularly, in the manner the
milk components are priced. Net Merit (NM$) is designed for use by most U.S. producers as it is based on
average prices and costs for all traits. Cheese Merit (CM$) differs due to cheese yield pricing used, and Fluid
Merit (FM$) is provided for producers paid using fluid pricing, where not much if anything is paid for the protein
component. Grazing Merit (GM$) is provided for use by producers that graze or seasonally calve, thus more
emphasis (2.5 times more) is placed on fertility.
The economic values assigned to most traits are the same in all four indexes. NM$ is now closer to CM$ because
of the new Federal Order in California. (Previously California used solid-not-fat pricing.) Now 92% of the U.S. milk
(79% previously) is assumed to be sold with protein pricing.
Relative Emphasis
US Profitability in CDCB
merit indices Merit
2021 Indices
review – August
- Relative 2021
Emphasis (%)
-15 -10 -5 0 5 10 15 20 25 30
MILK
FAT
PROT
PL
SCS
BWC
UDC
FLC
DPR
CA$
HCR
CCR
LIV
HTH$
RFI
EFC
HLIV
NM$ FM$ CM$ GM$Body Weight Composite (BWC)
Q9: Why does BWC receive such a high weight in the new NM$?
Feed costs are the largest outlay in producing milk. It appears feed costs average 32% of the value of extra
production plus 15% for cow maintenance for a total of 47% of the income generated from milk sales. Large cows
and bulls were favored by dairy cattle breeders for years, but considerable research shows cow size should be
assigned negative weight because of additional maintenance and feed costs. It is no surprise that big cows eat
more. The higher-producing cows use a smaller percentage of their feed for maintenance and thus are more
profitable. In this revision, the maintenance charge is much larger, the marginal cost for yield is smaller, and
Residual Feed Intake (RFI) is included for Holsteins.
The National Research Council is increasing their estimate of the intake required for maintenance by 25%. Their
updated value is 3.4 pounds of dry matter intake (DMI) per pound of body weight per lactation.
Q10: Are we selecting for more efficient cows or simply smaller cows?
By accounting accurately for all revenues and costs of production and practicing selection based on these figures,
cow size will no longer increase. Producers striving for more profitable cows should select for the most efficient
cows, and smaller cows are generally more efficient than the largest cows. Milk volume produced has a modest
relationship with cow size, but the greater feed consumed by the large animals negates that production gain.
Actual feed intake data now lets us predict animals’ RFI instead of approximating the intake from only yield and
Body Weight Composite (BWC) data.
Q11: Would we be selecting for frail/thin (high Dairy Form) cows by strongly penalizing BWC?
Three facts should comfort breeders that selection using the revised index is not expected to change dairy form.
1) Yes, the August 2021 merit indexes do place more negative emphasis on BWC because maintenance
requirements have been discovered to be higher than previously understood, through recent
documentation in both Holstein and Jersey breeds
2) Dairy Form (DF) is given a large negative emphasis (-47% for Holsteins and -35% for Jerseys) in forming
BWC in the new index, meaning those thin cows are “penalized” in BWC.
3) Greater emphasis is given to Productive Life (PL) in the new index (15 vs. 12%), so scores for DF should
not increase.
Q12: Would there be potential negative impact on fertility and other health traits?
The opposite is true – positive impact on fertility and health traits is expected. In the NM$ 2021 formula, the
emphasis assigned to Productive Life is 15%, Daughter Pregnancy Rate (DPR) is 5%, plus 1% to each Heifer
Conception Rate (HCR) and Cow Conception Rate (CCR). The genetic relationship between Productive Life with
both fertility and the health traits are high. This was documented well when PL was introduced in 1994 when
selection emphasis on PL improved the entire fertility picture. Expected progress annually in DPR, HCR, CCR,
and the six health traits from NM$ are all positive, as are expected progress in PL, cow livability and heifer
livability. These expected genetic gains are all shown in the table with one of the answers that follow.
Reliability
Q13: If the NM$ reliability with the new formula is lower than previous, does this mean less information is
being considered?
Actually, there is more information considered than before. Much of the information entering the index remains
(nearly) the same – except for intended shifts in income or expenses. New information from the new traits makes
NM$ more comprehensive.
Q14: Since Feed Saved has low reliability, what will happen with the NM$ reliability?
The merit indexes are a function of all evaluated traits incorporated into the indexes. If new traits added have
lower reliabilities than the previous included traits, the reliabilities of the indexes will decline.
Despite this perceived disadvantage, the more inclusive indexes will be more valuable than previous because
they deliver more economic progress in the right direction. This rather new phenomenon is one that we should get
used to as it is likely to reoccur many times as additional traits having only limited data are added in the future.
The expected gains in cow profitability outweigh the slight decrease in reliability.Q15: What can be done to increase the Feed Saved reliability?
As more animals have feed intake records in the national cooperator database, the reliabilities for Feed Saved
and merit indexes will increase. Obtaining a genomics test is the quickest way to raise the reliability of any trait,
assuming some phenotypic data is available for relatives. Therefore, genomic testing is encouraged on any
animals with feed consumption recorded.
Feed Saved and Residual Feed Intake (RFI)
Q16: What is the difference between Residual Feed Intake and Feed Saved?
Evaluations for Residual Feed Intake (RFI) show the difference between the actual and expected feed intake
expressed in pounds of dry matter consumed per lactation. Feed Saved includes the benefit from reduced RFI
and the reduced feed associated with smaller Body Weight Composite (BWC). These traits are derived using
recordings of actual feed intake collected recently from research herds.
Q17: How should we interpret Feed Saved evaluations?
This 2021 revision of merit indexes uses actual feed intake data instead of expected intake based on correlated
traits. A positive evaluation for Feed Saved provides the reduction in feed cost per lactation expected of the
offspring of each animal in comparison to the genetic base.
Q18: Why is RFI being published now as an independent trait?
Residual feed intake is one of the components of Feed Saved used in the computation of NM$2021. In order to
help the industry to interpret the evaluation results and following CDCB’s transparency practice, RFI will be made
available as a separate trait. Our recommendation continues to be that Feed Saved is the most comprehensive
expression of feed efficiency and should be used by producers.
Genetic Progress
Q19: What is the expected genetic progress with the new NM$ compared with the current formula?
The following tables show the predicted annual progress expected in 24 traits, comparing the 2018 and 2021
versions of NM$. The largest difference is in RFI, in that substantially more progress (-1.94 vs. -0.81 pounds) is
made using the 2021 version.
Milk Fat Protein Productive SCS Body Wt. Udder Feet / Leg
(pounds) (pounds) (pounds) Life (mo.) (units) Composite Composite Composite
2018 NM$ 119 7.92 4.38 .48 -.02 -.05 .09 .04
2021 NM$ 127 7.66 4.44 .49 -.02 -.07 .08 .03
Daughter Calving Heifer Cow Cow Gestation Health Residual
Pregnancy Ability ($) Conc. Conc. Livability Length ($) Feed
Rate (%) Rate (%) Rate (%) (%) (days) Intake
2018 NM$ .02 2.30 .15 .14 .23 -.12 .99 -0.81
2021 NM$ .03 2.30 .15 .15 .25 -.13 .97 -1.94
Milk Displaced Ketosis Mastitis Metritis Retained Early 1st Heifer
Fever Abomasum (%) (%) (%) Placenta Calving Livability
(%) (%) (%) (days) (%)
2018 NM$ .01 .06 .15 .11 .09 .00 .31 .08
2021 NM$ .01 .07 .15 .11 .09 .00 .32 .08Q20: How does the new formula impact traits over time? The (genetic) trends expected in all traits in NM$2021 will change. Direct selection brings a more predictable response, as the change that occurred prior to the traits’ inclusion could have been either in a positive or undesirable direction, depending on its genetic correlations with the other traits. The genetic change that has been occurring for a trait over the last few years could provide an indication of what might continue had it still not been a part of the index. Q21: Why do we need so many traits in the selection index? Aren’t we diluting the progress of the existing traits, such as production? To maximize profit (efficiency), one must include all the evaluated traits that have a genetic component plus an economic impact. Yes, the incorporation of each additional trait causes a decrease in emphasis on the other traits included previously, but those decreases are usually small, depending on the weight assigned to the trait added. Careful attention needs to be given to developing the indexes because the economic contribution and costs of each trait needs to be derived. The genetic correlations between traits must be reviewed to avoid double counting the impact of related traits. The more traits having economic value that are included in a selection index, the more economic progress can be made – as long as the weights are assigned correctly. For more, review the article, Select genetic index that considers heritable traits with economic value, by H. Duane Norman. Differences by Breed Q22: What is the impact of the new NM$ formula for the non-Holstein breeds? The improvement in the index in all breeds is substantial as improvements are made in the parameters for many other traits, plus there are two additional traits added. Economic values are derived using trait averages for Holsteins, and missing traits such as RFI are assumed to be 0 for other breeds. That increases the relative values of other traits for those breeds because these relative values sum to 100%. Although Residual Feed Intake (RFI) and Feed Saved (FS) are not in the index for non-Holstein breeds, there are other evaluated traits that have correlated genetic relationships that help improve feed efficiency. Environmental Impacts Q23: Is there quantifiable information or evidence related to the environmental improvements (i.e., less water utilization, land use, reduced carbon footprint, methane) that could result through selection based on new Net Merit and Feed Saved? Recent research showed we are making great progress related to environmental impact. Increased productivity is the key to this gain each decade. The greenhouse gas (GHG) emissions needed to produce a unit of energy corrected milk (ECM) in 2017 was only 81% of that needed to produce the same yield just 10 years earlier. The total ECM increased by 25% between 2007 and 2017, while the GHG emissions increased by only 1%. Reduced requirements for land, feed and water were equally impressive, and similar advances were made in reducing waste output (methane, phosphorus, nitrous oxide and manure) as well. Similar improvements in these environmental factors can be expected using the new merit indexes, and one should expect there will be a reduction in cattle feed needed. © Council on Dairy Cattle Breeding • 4201 Northview Dr. One Town Centre, Suite 302, Bowie, MD 20716 • www.uscdcb.com
You can also read