Officer-Involved Shooting Review - Analysis of Cases Reviewed by the San Diego County District Attorney's Office 1993 2012
←
→
Page content transcription
If your browser does not render page correctly, please read the page content below
Officer-Involved Shooting Review

Analysis of Cases Reviewed by the San Diego
     County District Attorney’s Office

               1993 – 2012

                 December 2014
BACKGROUND
Officer Involved Shootings are among the most thoroughly reviewed incidents in law
enforcement. This report was prepared by the San Diego County District Attorney’s Office
(SDCDA) in order to assist law enforcement and the community in examining the statistics to
better understand the dynamics of officer-involved shootings in San Diego County.

Previously, the SDCDA’s Office collected and analyzed 11 years of data. That study was
released in 2007 and included data from 1996 through 2006. The current report covers a 20 year
period from 1993-2012 and a total of 358 Officer-Involved Shooting events. The majority of the
information comes from reports compiled by law enforcement investigators, forensic analysts,
and medical examiners. Some of the information is contained in the letters sent to law
enforcement agencies by the SDCDA summarizing the facts and legal analysis of shootings.
Some additional information was obtained from the various law enforcement agencies, in
particular the San Diego Police Department’s officer-involved shooting database.

Officer-Involved Shooting Reviews

The SDCDA has conducted reviews of all state and local officer involved shootings (OIS) in the
line of duty by San Diego County peace officers since the mid-1970's. The role of the District
Attorney’s Office is to provide an independent review of all shootings and other use of deadly
force, fatal and non-fatal, to determine if there is criminal liability. This review does not examine
such issues as compliance with the policies and procedures of any law enforcement agency, ways
to improve training, or any issues related to civil liability.

Upon completion of the SDCDA’s review, where there is a determination the use of deadly force
was justified, a letter summarizing the evidence, including statements of the deputy or officer
and other witnesses, is written and delivered to the respective Police Chief or Sheriff. The time
it takes for receipt of investigative materials, completion of the review, and issuance of the letter
varies based on the complexity of the case, the forensic work necessary, and the length of time
before the jurisdictional law enforcement agency completes its investigation and presents the
case to the SDCDA. On average, for the 20 year period, the letter was sent 66 days after the
incident occurred. The range of time from the OIS event until the completion of the SDCDA
letter was from a low of 3 days to a high of 18 months.

Current SDCDA Protocol

The “Protocol for Investigation and Review of Officer Involved Shootings and Other Uses of
Force Resulting in Death” memorializes the general protocol for the investigation of Officer
Involved Shootings in San Diego County. It is signed by the District Attorney, the San Diego
County Sheriff, the Police Chiefs and other leaders of law enforcement in San Diego County.

                                                                                                    1
The Protocol focuses on the following areas:
• The jurisdictional agency immediately notifies the designated representative of the
SDCDA.
• The SDCDA Investigator responds and contacts the supervisor in charge of the incident
scene to receive a briefing and view the scene.
• The jurisdictional agency conducts the primary investigation of the incident.
• The jurisdictional agency provides a verbal briefing to the SDCDA within 3 days of the
incident (if fatal).
• Upon completion of the investigation, the jurisdictional agency submits the entire case to
the SDCDA for independent review.
• The SDCDA conducts the independent assessment and writes a letter summarizing the
facts and legal conclusion.
OVERVIEW OF THE DATA
From 1993 through 2012, the SDCDA investigated 358 OIS cases with 367 subjects shot. 1 Of
the total shootings, 54% were fatal. The percentage of shootings in a given year that were fatal
ranged from a low of 36% (2008) to a high of 79% (2005).
WHEN DID THE SHOOTINGS OCCUR?
Total cases per year ranged from a low of 10 in 1996 to a high of 28 in 1993, with an average of
just under 18 per year.
BREAKDOWN OF CASES BY YEAR
30 28
26
25 24 23 23
20 19 19
20 16 13 18
17 12 10 16 17 17
7 13 4 15
15 14 14 13 14
7 9 8 6 12
4 9 11 5 5
10 6
10 6
4 15 7
5 12 13 10 12 10
13
10
13 11 10
8 9 7 9 7 9 7
6 4
0
Fatal Non-Fatal
The number of cases per month also varied over the 20 year period, with a low of 18 (April) to a
high of 37 (October) as shown in the graph below. The average number of cases per individual
1
In 348 cases, there was 1 subject shot and in 10 cases, there were 2 subjects shot. A case was counted as fatal if
one subject was killed. Of the 358 incidents, five cases had one subject killed as well as at least one other injured.
2month was 1.5, with the highest month having seven (May 2002), and 58 of the 240 months
(24%) having zero incidents.
NUMBER & PERCENTAGE OF CASES BY MONTH
40
10% 10%
35 10%
9% 9% 9%
30 8% 8% 8%
25 7% 6%
20 5%
15
10
5
0
Jan Feb Mar Apr May Jun Jul Aug Sep Oct Nov Dec
Shootings were relatively evenly spread throughout the days of the week - the exception being
Saturdays when nearly one-fifth (19%) of the shootings occurred. By contrast, the lowest day of
the week was Sunday at 11%.
PERCENTAGE OF CASES BY DAY OF THE WEEK
Sun
Sat
11%
19%
Mon
12%
Fri
16%
Tue
14%
Thu Wed
15% 13%
3While shooting incidents occurred during all times of the day and night, over half occurred
within an eight-hour block of night into early morning (from 5pm to 3am). Every hour from 9
pm through 2am had at least 20 incidents.
HOUR OF THE DAY
8%
7% 6%
7% 6% 6%
6% 5% 6% 6% 6%
Percent of Cases
6% 5% 5%
5% 4%
4% 3% 4%
4% 3% 3% 3%
3% 3% 3% 3% 3%
2% 1%
1%
1%
0%
5 6 7 8 9 10 11 12 13 14 15 16 17 18 19 20 21 22 23 0 1 2 3 4
Hour of the Day (starting at 0500)
WHO WERE THE AGENCIES AND OFFICERS INVOLVED?
The San Diego Police Department (SDPD) was involved in just under half (48 %) of the cases,
with the Sheriff’s Department (SDSO) involved in 20%. 2 The following chart shows a
breakdown of the number of cases for all agencies. The total does not add up to 358 because
there were several cases with multiple agencies involved in the same shooting. The federal
agencies listed below are included because they were involved with a local or state agency but
were not the primary agency. OIS incidents that are solely federal law enforcement are not
reviewed by the SDCDA’s Office.
Agency Cases Agency Cases
San Diego PD 184 CA DOJ BNE 2
San Diego Sheriff 75 DA's Office 2
El Cajon PD 20 Harbor PD 2
CHP 17 Coronado PD 1
Oceanside PD 16 San Diego Marshal 1
Escondido PD 15 San Diego Probation 1
National City PD 11 Costa Mesa PD 1
Chula Vista PD 10 Riverside Sheriff 1
La Mesa PD 7 UCSD PD 1
CDCR 5 U.S. Marine Corp 1
Carlsbad PD 3 U.S. NCIS 1
State Parks 3
2
SDPD and SDSO serve about 42% and 27% respectively of the County’s population. (www.sandag.org)
4Number of Officers Involved
Between 1993 through 2012, there were a total of 606 shooting officers. In 63% (224) of the
cases, there was one officer who fired. There were two shooting officers in 22% (80) of the
cases; three shooting officers in 8% (30) cases; and four shooting officers in 3% (12) of the
cases. Of the remaining 12 cases, there were 3 cases with 5 officers, 4 cases with 6 officers, 2
cases with 7 officers and 1 case each with 9, 10 and 12 officers who shot.
Analyzing the number of officers present compared to the number of officers who shot and
struck the subject, revealed that 24% of the time, the shooting officer was the only officer
present. Further analysis is below:
Number of Officers Shooting
No. of Officers
Present 1 2 3 4 5 or more TOTAL
1 24% (85) 85
2 22% (77) 11% (39) 116
3 6% (22) 6% (20) 4% (13) 55
4 3% (11)313 officers; ranging from less than one year to 41 years, with 9.4 years being the average
amount of time on the force.
The race and gender breakdowns for officers (1st table) and subjects (2nd table) are listed below.
There was one officer with unknown gender and race. Percentages may not add up to 100 due to
rounding.
OFFICER RACE Male Female Total
Asian/Filipino 3% (16) 4.5% (1) 3% (17)
Black 5% (31) 4.5% (1) 5% (32)
Hispanic 12% (71) 9% (2) 12% (73)
Pacific Islander 1% (3) 4.5% (1) 1% (4)
White 72% (418) 73% (16) 72% (434)
UNKNOWN 8% (44) 4.5% (1) 7% (45)
Grand Total 583 22 605
SUBJECT RACE Male Female Total
Asian/Filipino 4% (13) 4% (1) 4% (14)
Black 20% (67) 8% (2) 19% (69)
Hispanic 37% (128) 21% (5) 36% (133)
Pacific Islander 1% (3) 1% (3)
White 35% (119) 67% (16) 37% (135)
Other/Unknown 4% (13) 4% (13)
Grand Total 343 24 367
Of the 335 shootings in which we know the race of both the officer(s) and the subject(s), the
analysis showed the following breakdown: 4
Non-White (Officer) -
Non-White (Subject)
9%
White (Officer) -
White (Subject)
26% Non-White (Officer)
- White (Subject)
6%
Multiple
(Officers) - White
(Subject)
Multiple (Officers) - White (Officer) -
Non-White (Subject) Non-White (Subject)
11% 41%
4
“Multiple” means there were multiple officers, and at least one was non-white. There were two cases with multiple
non-white subjects, one with white officers and one with multiple-race, non-white officers.
6Drawing conclusions from the above analysis is very difficult because of the lack of data about
the demographics of the areas/subject population as well as demographics of the officers
working in those areas. Additionally, the demographics of San Diego County as well as the
demographics of law enforcement have changed over the 20 year study period.
Age of Subjects
Age was known for 360 subjects, 336 male and 24 female. The average age of all subjects
involved in OIS was just under 32 years old, ranging from 15 to 90. Male subjects ranged in age
from 15 to 90 with an average age also of just under 32. Female subjects ranged from 16 to 51
with an average age of 34. Over half (56%) of all subjects were between the ages of 18 to 32.
The age distribution is shown in the chart below.
SUBJECT AGE
25
NUMBER OF SUBJECTS
20
15
10
5
0
15 17 19 21 23 25 27 29 31 33 35 37 39 41 43 45 47 49 51 54 56 58 60 62 68 75 90
AGE
Other Subject Information
• Of the 304 subjects whose parole or probation status at the time of the shooting could be
determined, 44% were either on probation or parole.
• The military status was known for 178 subjects. At the time of the incident, 89% were not in
the military, 7% were former military, and 4% were currently in the military. Of the events
involving subjects with previous military experience, 7 of the 13 incidents occurred prior to
2001.
• In 19% (67) of the incidents, the subject made statements or behaved in a way that was
considered “suicide-by-cop” (meaning it appeared clear the subject wanted police to shoot
him or her).
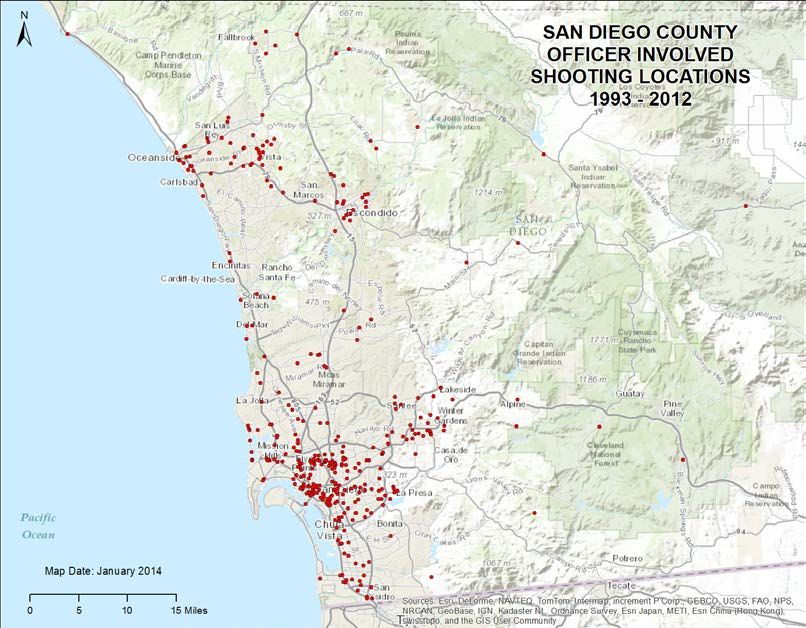
7LOCATION OF INCIDENTS
While the shootings occurred all over San Diego County, just over half (54%) were in the City of
San Diego. The remaining 164 included 48 (13%) in unincorporated County, 22 (6%) in
Oceanside, 17 (5%) in Escondido, 15 each (4%) in Vista and El Cajon, and 11 (3%) in Chula
Vista. The remaining cities each had less than 10. The specific cities and unincorporated
communities are detailed below.
City/Community Cases City/Community Cases
Alpine 2 Lakeside 5
Bonita 1 Lemon Grove 2
Bonsall 1 National City 9
Borrego Springs 1 Oceanside 22
Buckman Springs 1 Pala 2
Carlsbad 3 Pine Valley 1
Camp Pendleton 2 Poway 3
Chula Vista 11 Ramona 2
Descanso 1 Rancho Santa Fe 1
Dulzura 1 San Diego 194
El Cajon 15 San Marcos 2
El Cajon Unincorp 4 Santa Ysabel 1
Encinitas 2 Santee 5
Escondido 17 Solana Beach 2
Escondido Unincorp 2 Spring Valley 8
Fallbrook 5 Valley Center 3
Imperial Beach 1 Vista 15
La Mesa 7 Vista Unincorp 3
La Mesa Unincorp 1
8The following map depicts the specific locations of the shootings:
Nature of Incident Location
The nature of the location, meaning the physical setting where the OIS occurred, varied widely.
Most were outdoors, with over one-third being in the street. In addition to the street, most other
encounters occurred in public or open places as opposed to private locations.
130 Location Type
140
120
100
80
60 43 40 39 34
40 21 17 15 10
20 5 4
0
9OTHER CHARACTERISTICS OF THE SHOOTINGS
Use of Less Lethal Force
Immediately prior to the OIS, some officers used a less than lethal (LTL) option in an attempt to
subdue the subject. In 80% of the cases (286), no LTL force was used prior to the shooting. For
purposes of the study, less lethal force includes the items listed below but does not include
attempts at physical restraint, control holds, verbal commands, etc. The following is a
breakdown of less than lethal force items used and the frequency:
LESS THAN LETHAL USED Total
Chemical Spray 24
K-9 17
Baton 10
LTL Shotgun 7
Taser 7
Baton & Chemical Spray 2
Baton, Taser & K-9 1
Baton, Chemical Spray, Taser, LTL Shotgun, Nunchakus 1
Chemical Spray & Nunchakus 1
Flashlight 1
Rubber Bullets & K9 1
Nature of the call
Family/domestic disturbance calls have long been among the most dangerous to law
enforcement. 5 Similarly, these calls are also one of the most frequent incident types that officers
responded to just prior to an officer-involved shooting. However, the most common event
preceding an OIS is traffic-related. Traffic-related includes traffic stops and other vehicle-
related calls like drunk driving.
5
According to FBI statistics for Law Enforcement Officers Killed and Assaulted (http://www.fbi.gov/about-
us/cjis/ucr/leoka/2012) in the State of California, approximately 8,000 officers were assaulted in 2012 and between 2
and 6 killed each year from 2003-2012. Domestic disturbance calls were the number one crime type for assaults on
an officer. The three most common crime types preceding an officer being killed were traffic stops, domestic
disturbances, and robberies.
10The following chart depicts the 11 most common incident types (those with 15 or more
incidents) preceding a shooting. “Gun-related” means the call was for someone displaying,
brandishing, threatening with or shooting a gun.
MOST COMMON INCIDENT TYPES PRECEDING OIS
Traffic-related
Family/DV
Robbery
Warrant/Suspect Contact
Gun-related
Shots Fired
Auto Theft/Stolen Vehicle
Assault/Sex Assault
Mental
Suspicious Person
0 10 20 30 40 50 60
Nature of the Initial Contact
The “initial contact type” explains how/why the officer was at the scene. In just over half of the
cases (58%), the source of the initial contact was a radio call. In other words, citizens were
contacting the police via 911 or a non-emergency number (versus being self-generated contacts).
An additional one-third were self-initiated by the officer which includes patrolling and making
traffic and pedestrian stops. “Citizen Contact” is if a person contacted the officer directly.
INITIAL CONTACT TYPE COUNT
Radio Call 209 (58%)
Self-Initiated 116 (32%)
Investigation 22 (6%)
Citizen Contact 9 (3%)
Other 2 (movement by the suspect; 5 were accidental discharges by the officer; 1 was a violent gang
member running at another officer; and 1 was as a result of a prison inmate involved in a violent
assault on another inmate.
SUBJECT WEAPON
140
115
120
100
80 66
60
41
40 34 29
18 15 13 13
20 10 6 5 1 1
0
Pursuits
Over one-third of the cases (38%) involved a pursuit prior to the shooting. The breakdown of
foot and vehicle is seen in the chart below. Several incidents involved both a vehicle and a foot
pursuit and one vehicle pursuit where the subject and officer were on bicycles.
Vehicle
Pursuit
18%
Foot No
Pursuit Pursuit
20% 63%
12Time on scene
Analysis was completed for the time elapsed between when the first officer arrived on-scene and
when the shooting occurred. This data existed for 295 incidents. Nearly half (45%) of the
shootings took place immediately upon arrival on-scene (designated by 0 minutes in the chart
below). Sixty-five percent of the incidents occurred within three minutes or less of arrival on-
scene. The majority of the incidents (280) occurred within 2 hours of on-scene arrival, and the
average time for these incidents was 6 minutes. The 15 incidents over 120 minutes range from
124 minutes to over 12 hours.
OFFICER TIME ON SCENE - INCIDENTS 30 MINUTES OR LESS
50%
45%
Percent of Total Incidents
40%
35%
30%
25%
20%
15%
10%
5%
0%
0 1 2 3 4 5 6 7 8 9 10111213141617181920212223242526282930
Number of Minutes
Drug/Alcohol Use and Mental Health factors
Drugs and/or mental health issues were very common in the subjects. Either some evidence of
drug use and/or mental health concerns was present in 81% of the cases (290 of 358 total). Sixty-
six percent (242) of the subjects had drugs in their systems, including many with multiple
substances in their system (18 subjects being under the influence of three or more drugs). There
was a total number of 346 drugs (including alcohol) found in the systems of the 242 subjects.
Below is a breakdown by type of drug/substance. Methamphetamine/amphetamine was by far
the predominant drug connected to the officer-involved shootings.
13Fifty-two of the subjects had documented mental health issues, and sixty-two exhibited unstable
behavior at the time of the incident. Nine subjects had both documented mental health issues
and were exhibiting unstable behavior. One-third of the subjects had both mental health issues
and under the influence of one or more drugs.
TYPE OF DRUG IN SUBJECT'S SYSTEM
Other/Unknown Drug 18
PCP 8
Opiates 17
Cocaine 24
Prescribed Meds 25
Marijuana 41
Alcohol 98
Amphetamine/Meth 116
0 20 40 60 80 100 120 140
Number of Subjects Under the Influence
CONCLUSION
Analyzing officer-involved shooting cases allows for a more thorough examination of any trends
and/or patterns. The data may be useful in ways to enhance officer safety practices and/or
officer awareness. By building on the amount of data from the previous 11-year study, a number
of facts were identified and/or confirmed through this 20-year study.
• Nearly two-thirds of the incidents occurred within three minutes or less of arrival on-
scene with many almost immediately.
• A firearm was the most common (40%) type of weapon the subject possessed.
• Patrol (uniformed) officers are most at-risk for becoming involved in a shooting, and
more than half the time, it was in response to a radio call.
• Nearly half (44%) of the subjects shot were on parole or probation at the time of the
shooting.
• A pursuit (vehicle, foot or both) preceded the shooting in 38% of the incidents.
• Subjects are mostly male, age 18-32, and have mental issues and/or were under the
influence of drugs, with methamphetamine/amphetamine being the most common.
• In nearly two-thirds of the incidents, only one officer fired his or her weapon. In just
over one-quarter of the incidents, the shooting officer was the only officer present.
• The large majority of shootings did not involve less than lethal force prior to the
shooting.
• The average age of the shooting officers was 35, with an average of 10 years of law
enforcement experience.
• Incidents are more likely to occur in the evening or late at night, and over one-third
(35%) of the incidents occurred on Friday or Saturday.
14• Incidents are most likely to occur when there is a traffic incident or family/domestic
disturbance call.
• Most incidents were outdoors, with over one-third being in the street.
The San Diego District Attorney’s Office has created and maintains a case database for purposes
of collecting statistical and other information related to Officer Involved Shootings. This report
was completed and is being shared with law enforcement and the community in an effort for
everyone to better understand the nature of these events.
15You can also read