ONLINE FIRST PUBLICATION - SMJ Singapore Medical Journal
←
→
Page content transcription
If your browser does not render page correctly, please read the page content below
SMJ                Singapore Medical Journal

                    ONLINE FIRST PUBLICATION
  Online first papers have undergone full scientific review and copyediting, but have not been
typeset or proofread. To cite this article, use the DOIs number provided. Mandatory typesetting
  and proofreading will commence with regular print and online publication of the online first
                                         papers of the SMJ.

   Thermal strain and fluid balance during a 72-km military route
                      march in a field setting

          Beng Hoong Poon1,2, MBBS, MMed, Suriya Prakaash1,3, MBBS, MMed,
  Ya Shi Teo4, BSc, Priscilla Weiping Fan4, BSc, Jason Kai Wei Lee4,5,6,7,8,9,10, PhD, FACSM
   1
   Singapore Armed Forces, HQ Medical Corps, 2Chairman Medical Board Office, Changi
   General Hospital, 3Department of Sports Medicine, Changi General Hospital, 4Defence
   Medical and Environmental Research Institute, DSO Laboratories, Singapore, 5Human
  Potential Translational Research Programme, Yong Loo Lin School of Medicine, National
  University of Singapore, Singapore, 6Department of Physiology, Yong Loo Lin School of
  Medicine, National University of Singapore, Singapore, 7N.1 Institute for Health, National
 University of Singapore, Singapore, 8Global Asia Institute, National University of Singapore,
   Singapore, 9Institute for Digital Medicine, Yong Loo Lin School of Medicine, National
  University of Singapore, Singapore, 10Singapore Institute for Clinical Sciences, Agency for
                   Science, Technology and Research (A*STAR), Singapore

 Correspondence: A/Prof Jason Lee, Human Potential Translational Research Programme,
 Yong Loo Lin School of Medicine, National University of Singapore, Singapore, 2 Medical
 Drive, Singapore 117593. phsjlkw@nus.edu.sg

                             Singapore Med J 2021, 1–18
                        https://doi.org/10.11622/smedj.2021053
                         Published ahead of print: 19 May 2021

                              Online version can be found at
                            http://www.smj.org.sg/online-first
Original Article                                                                      Page 1 of 18

ABSTRACT

Introduction: A physiological profiling study was done to evaluate thermal strain as well as

fluid and electrolyte balances on heat-acclimatised men performing a 72-km route march in a

field setting.

Methods: 38 male soldiers (age range 18–23 years) participated in the study, as part of a cohort

that marched for 72 km, with loads for about 26 hours. Core temperature and heart rate sensors

were used for the duration of the march. Fluid and food intake and output were monitored for

the duration of the march. Blood samples were taken one day before the march (pre-march),

immediately after the march before they had any opportunity to recover (Post 1) and on the

15th day after the march to ascertain recovery (Post 2) to assess fluid and electrolyte profiles.

Results: Mean core temperature was within safe limits, ranging from 37.1 to 38.1°C

throughout the march. There was an average overall decrease in serum sodium levels, a decline

in serum sodium concentration in 28 participants and three instances of hyponatraemia (serum

sodium concentration < 135 mmol/L).

Conclusion: Our study found low thermal strain among heat-acclimatised individuals during

a 72-km route march. However, there was an average overall decrease in serum sodium levels,

even when the participants were allowed to drink ad libitum. Challenges of exercise-associated

hyponatraemia during prolonged activities remain to be addressed.

Keywords: endurance, exercise, hydration, prolonged physical activity, soldiers
Original Article                                                                       Page 2 of 18

INTRODUCTION

In military operations, exertional heat injuries as well as fluid and electrolyte imbalances

continue to be salient challenges.(1) The physiological profiles of different activities vary and

understanding these profiles is crucial to risk assessment and subsequent management. Since

prolonged exercise is one of the key risk factors for incurring significant dehydration or

exercise-associated hyponatraemia (EAH), accurate assessment of fluid balance will allow safe

hydration recommendations during extreme events to prevent incidences of hyper- and

hyponatraemia. Research on understanding the physiological determinants during extreme

events is limited. Furthermore, there is limited data concerning the physiological responses to

extreme events collected under field conditions.(2)

        It is therefore important to profile the actual demands of extreme events in a field setting

to gain critical insights into physiological responses and thereby enhance both safety and

performance, as recommendations derived from laboratory studies can, at times, misrepresent

actual demands (either due to restrictions or the complexities of replicating the actual activity

in a laboratory setting).

        We profiled an extreme event of a 72-km military route march, as it provided an

excellent field setting to study an array of military-related stressors. To the best of our

knowledge, this was the first study to systemically profile the heat strain and fluid balance of

participants during a 72-km route march in a field setting.

METHODS

During the 72-km route march, soldiers were required to march for a day without sleep while

carrying a load of approximately 20 kg throughout. Ethics approval was obtained from the

Institutional Review Board of the Defence Medical and Environmental Research Institute,

DSO National Laboratories, Singapore.
Original Article Page 3 of 18
This activity was conducted at the final stage of a course and the participants were well
heat acclimatised. The study recruited 38 healthy young soldiers to participate and informed
consent was obtained in writing after reading a document describing the nature, benefits and
risks of the study. The unit medical officer medically reviewed and cleared the participants for
their participation in the study. A health declaration form was administered prior to the
commencement of each sampling point.
The mean 2.4-km run timing of participants was 9.8 ± 0.5 minutes, and accordingly,
the mean VO2max was estimated to be 53 ± 3 mL/minute/kg based on the ACSM metabolic
equation.(3) Anthropometry measurements for height and body composition were obtained five
days before the 72-km route march and the physical characteristics of participants were also
recorded.
To estimate thermal and cardiovascular strain, core temperatures and heart rates were
monitored. On the evening before the march, each participant ingested the VitalSense®
temperature sensor for continuous core temperature monitoring. An ambulatory core
temperature data recording system (Mini Mitter Co, Bend, OR, USA) was placed in two sealed
waterproof bags and carried in the uniform pockets throughout the route march. Heart rate was
monitored throughout the route march through the strapping of a heart rate sensor and wearing
of a heart rate monitoring watch (Polar Vantage, Polar Electro Oy, Kempele, Finland).
Measurements were taken one day before the march (pre-march), immediately after the
march before the participants had any opportunity to recover (Post 1) and on the 15th day post
march to ascertain recovery (Post 2). Nude body mass and blood biochemistry were measured
at these time points.
Blood samples were obtained via venipuncture of a forearm from each participant at
the pre-march, Post 1 and Post 2 time points, for which blood electrolytes, glucose and urea
concentrations were determined immediately using a handheld analyser (i-STAT®1 Analyser;Original Article Page 4 of 18
Abbott Point of Care Inc, Princeton, NJ, USA); aldosterone and arginine-vasopressin (AVP)
were determined via radioimmunoassay (Coat-A-Count Aldosterone assay; Siemens
Healthcare Diagnostics Inc., Los Angeles, CA, USA and BÜHLMANN Laboratories AG,
Schönenbuch, Basel-Land, Switzerland, respectively). Serum osmolality was calculated using
the formula:
Serum osmolality (mOsm/kg) = 2 x [Na+] + [BUN]/2.8 + [Glucose]/18, where Na+ was
serum sodium and BUN denoted blood urea nitrogen.
We also measured fluid intake and urine output, if any, at every rest point (total of 18)
of the march in addition to the abovementioned measurements at the pre-march, Post 1 and
Post 2 time points. Fluid intake was monitored by recording the mass of the participants’ water
canteen or water bags at each rest stop, taking into account the top-up made. Fluids consumed
from canned drinks during meals were also recorded and included in the computation of fluid
intake. Participants were allowed to consume their own food and fluids, with intake accounted
for through collection of food wrappers and left over food at the end of the activity for recording
and analysis using the Foodworks Professional 2007 software version 5 (Xyris, Brisbane,
Queensland, Australia).
The 72-km route march commenced at 0825 hours. Participants marched at a common
pace, as a cohort in the field, and carried a 17.1 ± 0.8 kg load. Eighteen rest stops at 4-km
intervals were made along the 72-km route and participants rested for 15–84 minutes at each
rest stop. Three meals (i.e. lunch, dinner and supper) were provided during the march. Fluids
were consumed ad libitum and plain water was provided for refilling at every rest stop.
Environmental conditions were monitored throughout the march: wet bulb, dry bulb and globe
temperatures, relative humidity and wind velocity were measured using a portable climate data
logger (Squirrel 2020 Universal Input Data Logger; MicroDAQ.com Ltd, Contoocook, NH,Original Article Page 5 of 18
USA) at each rest stop. The wet bulb globe temperature (WBGT) index was calculated as 0.1
(Tdry bulb) + 0.7 (Twet bulb) + 0.2 (Tglobe).
SPSS for Windows version 15.0 (SPSS Inc, Chicago, IL, USA) was used for statistical
analysis. Paired t-test and one-way analysis of variance followed by post hoc Tukey’s test,
whenever necessary, were used to analyse differences between measurements. Relationships
between parameters were analysed using Pearson’s product moment correlation coefficient (r).
Normality of data was assessed using the Shapiro-Wilk test. Normally distributed data was
presented as mean ± standard deviation, whereas non-normal data was presented as median
(range). Statistical significance was accepted as p < 0.05. Graphs and data were presented as
mean ± standard deviation, unless otherwise indicated.
RESULTS
To cover the 72 km, the participants walked for 16 hours and 27 minutes with a total of 9 hours
and 29 minutes of rest (inclusive of the lunch, dinner and supper breaks). The average pace of
the route march was between 3.6–5.3 km/hour. Participants carried a total load of
approximately 17.1 ± 0.8 kg, made up of their full pack, load-bearing vest (10.1 ± 0.7 kg),
water bottle (1.2 ± 0.04 kg), water bag (3.0 ± 0.3 kg) and weapon (2.8 kg). Based on the
marching pace of about 3.6–5.3 km/hour, with a load of 17.1 kg, metabolic equivalent of task
(MET) was estimated to be 5 during marching. Resting MET was estimated to be 1.5.
The physical characteristics of our participants are presented in Table I.
Table I. Participants’ physical characteristics (n = 38).
Variable Mean ± standard deviation (range)
Age (yr) 20.9 ± 1.0 (18.0–23.0)
Body mass (kg) 66.5 ± 5.6 (53.7–80.1)
Height (m) 1.74 ± 0.06 (1.61–1.83)
2
Body mass index (kg/m ) 21.4 ± 1.7 (18.7–26.0)
Body fat (%) 10.7 ± 3.2 (6.3–18.0)Original Article Page 6 of 18
Throughout the route march, the median WBGT was 26.6°C, with a range of 24.2°C to
30.2°C. This level of heat stress would be denoted as mild-to-moderate based on international
guidelines by the American College of Sports Medicine. Relative humidity averaged 78% and
was in the range 55%–95%, and these conditions are common in Singapore. Thus, the
environmental conditions during the march were considered moderate and would not have
induced high levels of thermal strain in the trainees.
Throughout the march, the mean core temperature of participants ranged from 37.1°C
to 38.1°C (Fig. 1a). Hypothermia and hyperthermia did not occur at any point along the route
march, as minimum and maximum core temperature were 36.7°C and 38.7°C, respectively.
Computed from the corresponding core temperature and heart rate, the mean Physiological
Strain Index (PSI)(3) was 3 ± 1 (Fig. 1b) for 21 participants with complete data.
The participants were instructed to drink fluids ad libitum and the average fluid
consumption was 9.9 ± 2.0 L over 26 hours, inclusive of fluid intake from food or other sources.
A few participants drank between 1.5–2.0 L of fluids between rest stops (within approximately
1.5 hours).
Mean sweat loss was 10.95 ± 1.58 L, and the rate of sweat loss was approximately 0.42
± 0.06 L/hour. Sweat loss correlated negatively with the change in serum sodium concentration
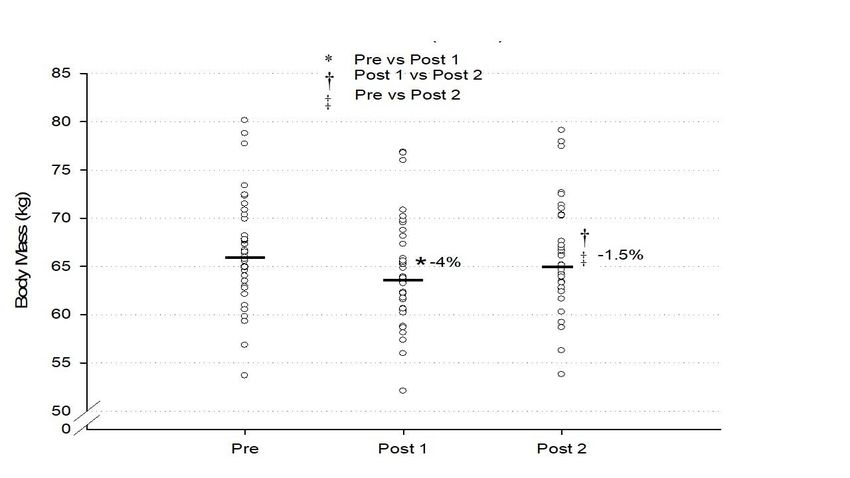
(R = −0.36, p < 0.05). All participants lost body mass, with an average of 4% of body mass
lost immediately after the route march at Post 1. (Fig. 2).
At the end of the route march, 34 of 38 participants provided usable blood samples
(Post 1) and a significant decrease of 0.7% in mean serum sodium concentrations (pre-march
vs. Post 1: 139 mmol/L vs. 138 mmol/L) was seen between the pre-march and Post 1 samples
(Fig. 3). Three participants were hyponatraemic at the end of the route march (serum sodium
level < 135 mmol/L) and there was no incidence of hypernatraemia (serum sodium level > 145Original Article Page 7 of 18
mmol/L). Among 34 participants, 28 (82.4%) participants had a decline in serum sodium
concentration. Among the hyponatraemic participants, two participants were asymptomatic
(serum sodium levels 133 mmol/L and 134 mmol/L) and one participant was symptomatic (130
mmol/L), but subsequently recovered well without a need for medical intervention.
Among participants who provided blood samples, there was a 220% increase in
aldosterone (n = 29) and a 200% increase of AVP (n = 28) levels, on average, immediately
after the 72-km route march. For one participant with EAH, AVP levels increased slightly (pre-
march vs. Post 1: 2.7 pg/mL vs. 5.5 pg/mL) even though serum sodium levels and osmolality
both decreased. AVP levels for the other two participants with hyponatraemia could not be
obtained.
DISCUSSION
The military is well attuned to the dangers of heat stress and has established robust systems
based on evidence to mitigate the risk. Meta-analysis of published studies have concluded that
heat adaptation regimes induce adaptations to high ambient temperature, exercise performance
and capacity in the heat.(4) Cardiovascular fitness is also an important contributor to exercise-
heat acclimatisation that acts to minimise physiological strain, reduce risk of heat injury and
sustain exercise capacity.(5) Our participants had undergone systematic heat-acclimatisation
regimes and also progressively improved their cardiovascular fitness prior to taking part in the
72-km route march. The pace of the march was also calibrated over the years in line with the
changes in training safety regulations.
This physiological profile study of heat-acclimatised participants revealed that the
observed core temperatures were within safe thermal thresholds, as the core temperature for
which the individual was at the threshold of fatigue and risk of heat injury was often near or
beyond 40°C. Furthermore, it is not uncommon for core temperatures to reach 40°C–42°COriginal Article Page 8 of 18
during exercise.(6,7) Similarly, physiological strain was relatively mild throughout the route
march; the core temperature and heart rate profiles of our participants were within the limits of
core temperature and heart rate upper constraints of 39.5°C and 180 beats/minute, respectively,
for the purpose of PSI. The mild thermal strain, for this activity, was due to the low intensity
of exercise relative to the degree of heat acclimatisation and cardiovascular fitness of the
participants. The participants marched at an MET of 5 and, taking oxygen consumption to be
3.5 mL/minute for 1 MET/kg body mass, the mean oxygen consumption for the march (VO2)
would be approximately 17.5 mL/kg/minute. With a mean VO2max of 53 mL/minute/kg among
our participants, they were exercising on approximately an average of 33% VO2max during the
march.
In contrast to heat stress, the quality of information available on EAH to the public is
poor. It was noted in a 2016 review that only 7.3% of 110 websites discussed that fluid intake
should be based on thirst and only half of them highlighted the risk of hyponatraemia from
overhydration.(8) In the early 2000s, awareness of hyponatraemia in marathon runners was
raised through a series of reports,(9-11) and even the death of two female charity marathon
runners.(12) The Third International EAH Consensus Development Conference held in 2015
concluded that the primary aetiology and mechanism leading to EAH was the overconsumption
of hypotonic fluids, likely in combination with non-osmotic stimulation of AVP secretion.(13)
In addition to over-drinking, other risk factors for EAH included prolonged low-intensity
exercise, and warm and humid environmental temperatures.
Over-drinking is a key risk factor in the development of EAH. It is known that
prolonged low-intensity activities, such as the present study, carries a significant risk of EAH,
as the long duration allowed sodium losses to accumulate while the low intensity of exercise
permitted participants to consume fluids more frequently.Original Article Page 9 of 18
Compared against other studies, participants in our study consumed 9.9 ± 2.0 L of fluids
over 26 hours versus a study profiling a 110-km military route march, wherein participants
consumed 14 L over 24 hours.(14) This may have accounted for the greater decline in serum
sodium levels of 5.6% recorded in the latter study when compared to 0.7% in our study. That
our participants’ sweat loss correlated negatively with the change in serum sodium indicated
that sodium depletion was a probable additional contribution to the fall in sodium
concentration. In contrast, studies of a shorter route march of 25 km over four hours found that
there was no decrease in serum sodium concentration after the activity.(15)
Body mass gain was seen in a majority of, but not all, athletes who became symptomatic
with EAH(16) and it was observed in the 2002 Boston Marathon that the strongest single
predictor of hyponatraemia was considerable body mass gain during the event.(17) This study
demonstrated the limitations of using body mass as an indicator for events that last more than
several hours. And even though all participants lost body mass (average loss of 4%) at the end
of the route march, this could not be directly used to correlate with their hydration status, as
body mass change was a combined effect of fluid and energy intake, substrate oxidation, water
stored with muscle glycogen made available to the body water pool, as well as both fluid and
energy losses (including fat mass losses).
The 220% increase in aldosterone and 200% increase of AVP levels, on average,
immediately after the 72-km route march in our study were not uncommon and similar
increases have been recorded in other studies. In two ultramarathon events (of 161 km and 56
km), the aldosterone increases recorded were 700%(18) and 660%,(18) respectively. Studies
measuring AVP levels following prolonged endurance exercise have also shown similar
increases of 200%.(19,20) Our study was not able to provide further information on the non-
osmotic stimulation of AVP secretion as a contribution to EAH, as we were only able to obtain
AVP levels from one of three participants with EAH.Original Article Page 10 of 18
While there are considerable risk management practices for the mitigation of
dehydration and exertional heat injury in the military, challenges confronting the prevention of
EAH in the field setting are not fully addressed for a myriad of reasons.
Fluid and electrolyte imbalances are common among military personnel performing
demanding physical activities over long durations. The emphasis on adequate hydration, a
robust fluid resupply chain at all levels and hydration policies to prevent dehydration are deeply
entrenched in the consciousness of commanders and soldiers alike. Consequently, there is a
subconscious downplaying of the risk of over-consumption of fluids and EAH. From the
perspective of training safety policies, it is pragmatic and sensible to set a minimum fluid
consumption guideline and ensure fluid availability.
The primary EAH risk mitigation approach continues to be the implementation of
educational programmes to a wide audience, including commanders, soldiers and medical staff,
to correct misconceptions regarding hydration. The mistaken, but oft-heard, ‘drinking beyond
the point of thirst’ must be corrected to an emphasis on application of ad libitum drinking.
Also, recognising the signs and symptoms of EAH and its medical treatment would need to be
emphasised, similar to that of exertional heat injuries.
Further research should seek to identify parameters that are reliable predictors of levels
of hydration and, more importantly, include the development of a simple field-usable tool to
evaluate hydration status and predict the risk of EAH for individuals to supplement the use of
body mass gain as a surrogate measure of hydration status. Training safety policies could then
be updated to mitigate the risk of EAH.
Our study was not without limitations. Being a field study, the measurements could not
be too demanding and sophisticated, as that would affect participants’ performance on the route
march. Changes in the blood profile post exercise could be masked by the interval between the
end of the route march and sampling time. Restoration, for at least some of these parameters,Original Article Page 11 of 18
might have occurred rapidly after the march. Finally, it was difficult to ascertain the precise
contributions of the singular effects of physical exertion, sleep deprivation and psychological
stress on the outcome variables in this study.
In conclusion, there is generally limited information on the thermal and fluid demands
of extreme events, especially in a military context. The data from this study revealed that there
was low thermal strain during a 72-km route march for heat-acclimatised individuals with good
cardiovascular fitness. However, it was noted that there was an average overall decrease in
serum sodium levels and three participants had hyponatraemia even when the participants were
allowed to drink ad libitum. Challenges confronting the prevention of EAH in the field setting
warrant more research.
ACKNOWLEDGEMENTS
The authors would like to express their gratitude to all participants and trainers from the
Singapore Armed Forces for their support and participation in this study. We would also like
to thank the following individuals for their help with data collection: Dr Darren Lim, Ms Pearl
Tan, Ms Grace Ang, Mr Yeo Zhen Wei, Ms Cheryl Tay, Mr David Fun, Ms Margaret Yap, Ms
Huang Liyan, Ms Jacinta Yeo, Ms Eunice Teo, Ms Carolyn Fu and Ms Lydia Law from Combat
Protection and Performance. Defence Medical and Environmental Research Institute, DSO
Laboratories, Singapore.Original Article Page 12 of 18
REFERENCES
1. Carter R 3rd. Exertional heat illness and hyponatremia: an epidemiological prospective.
Curr Sports Med Rep 2008; 7:S20-7.
2. DeGroot DW, Kenney WL. Thermal response to running across the Sahara desert: data for
three men. Aviat Space Environ Med 2008; 79:909-13.
3. Glass S, Gregory B. ACSM’s Metabolic Calculations Handbook. Lippincott Williams &
Wilkins, Baltimore, 2007, 25-74.
4. Tyler CJ, Reeve T, Hodges GJ, Cheung SS. The effects of heat adaptation on physiology,
perception and exercise performance in the heat: a meta-analysis. Sports Med 2016;
46:1699-724.
5. Périard JD, Travers GJS, Racinais S, Sawka MN. Cardiovascular adaptations supporting
human exercise-heat acclimation. Auton Neurosci 2016; 196:52-62.
6. Dill DB, Soholt LF, McLean DC, Drost TF Jr, Loughran MT. Capacity of young males and
females for running in desert heat. Med Sci Sports 1977; 9:137-42.
7. Nadel ER, Wenger CB, Roberts MF, Stolwijk JA, Cafarelli E. Physiological defenses
against hyperthermia of exercise. Ann N Y Acad Sci 1977; 301:98-109.
8. Hoffman MD, Bross TL 3rd, Hamilton RT. Are we being drowned by overhydration advice
on the Internet? Phy Sportsmed 2016; 44:343-8.
9. Davis DP, Videen JS, Marino A, et al. Exercise-associated hyponatremia in marathon
runners: a two-year experience. J Emerg Med 2001; 21:47-57.
10. Hew TD, Chorley JN, Cianca JC, Divine JG. The incidence, risk factors, and clinical
manifestations of hyponatremia in marathon runners. Clin J Sport Med 2003; 13:41-7.
11. Hsieh M, Roth R, Davis DL, Larrabee H, Callaway CW. Hyponatremia in runners requiring
on-site medical treatment at a single marathon. Med Sci Sports Exerc 2002; 34:185-9.Original Article Page 13 of 18
12. Siegel AJ, Verbalis JG, Clement S, et al. Hyponatremia in marathon runners due to
inappropriate arginine vasopressin secretion. Am J Med 2007; 120:461.e11-7.
13. Hew-Butler T, Rosner MH, Fowkes-Godek S, et al. Statement of the Third International
Exercise-Associated Hyponatremia Consensus Development Conference, Carlsbad,
California, 2015. Clin J Sport Med 2015; 25:303-20.
14. Ashkenazi I, Epshtein Y. Alternations in plasma volume and protein during and after a
continuous 110-kilometer march with 20-kilogram backpack load. Mil Med 1998; 163:687-
91.
15. Nolte HW, Noakes TD, Van Vuuren B. Trained humans can exercise safely in extreme dry
heat when drinking water ad libitum. J Sports Sci 2011; 29:1233-41.
16. Noakes TD, Sharwood K, Speedy D, et al. Three independent biological mechanisms cause
exercise-associated hyponatremia: evidence from 2,135 weighted competitive athletic
performances. Proc Natl Acad Sci U S A 2005; 102:18550-5.
17. Almond CS, Shin AY, Fortescue EB, et al. Hyponatremia among runners in the Boston
Marathon. N Engl J Med 2005; 352:1550-6.
18. Stuempfle KJ, Lehmann DR, Case HS, et al. Hyponatremia in a cold weather
ultraendurance race. Alaska Med 2002; 44:51-5.
19. Hew-Butler T, Hoffman MD, Stuempfle KJ, et al. Changes in copeptin and bioactive
vasopressin in runners with and without hyponatremia. Clin J Sport Med 2011; 21:211-7.
20. Hew-Butler T, Dugas JP, Noakes TD, Verbalis JG. Changes in plasma arginine vasopressin
concentrations in cyclists participating in a 109-km cycle race. Br J Sports Med 2010;
44:594-7.Original Article Page 14 of 18
FIGURES
72km RM body core temperature (n=30)
Min Max Mean
1a40.5
40.0
39.5
39.0
Tc (ºC)
38.5
38.0
37.5
37.0
36.5
08:00:00 12:00:00 16:00:00 20:00:00 00:00:00 04:00:00 08:00:00
Time (hh:mm:ss)
72km RM physiological strain index (n=21)
Min Max Mean
1b 10
Very high 9
8
High 7
6
Moderate 5
4
Low 3
2
1
No to little 0
08:00:00 12:00:00 16:00:00 20:00:00 00:00:00 04:00:00 08:00:00
Time (hh:mm:ss)
Fig. 1 Graphs show (a) body core temperatures (n = 30) and (b) corresponding PSIs (n = 21)
during the 72-km military route march. PSI: Physiological Strain Index; Tc: core temperatureOriginal Article Page 15 of 18 Fig. 2 Graph shows body mass of participants (n = 38) at the pre-march, Post 1 and Post 2 time points of the 72-km route march. *Significant difference between pre-march and post 1 findings (p < 0.05). †Significant difference between Post 1 and Post 2 findings (p < 0.05). ‡Significant difference between pre-march and Post 2 findings (p < 0.05).
Original Article                                                                 Page 16 of 18

Fig. 3 Graph shows serum sodium and osmolality levels of the participants (n = 34) at the pre-

march, Post 1 and Post 2 time points of the 72-km route march. *Significant difference between

pre-march and Post 1 findings (p < 0.05). †Significant difference between Post 1 and Post 2

findings (p < 0.05). Note: there was no difference in calculated serum osmolality at all three

time points. Shaded region denotes normal serum sodium levels.
Original Article                                                                    Page 17 of 18

SUPPLEMENTARY MATERIAL

Deriving effective sweat loss

 The effective sweat loss in our participants was calculated based on the following formulae

 first put forth by Maughan et al in 2007(1) and subsequently adjusted by King et al in 2008.(2)

                   SL = BML + IF + FI − UL − RWL − SO + MW, where

 SL = sweat loss

 BML = body mass loss (measured)

 IF = ingested fluid (measured)

 FI = real food intake (measured)

 UL = urine output (measured)

 RWL = respiratory water loss (calculated based on formula below)

 SO = substrate oxidation (measured with assumption below)

 MW = metabolic water (calculated based on assumption below)

 RWL was calculated using the following equation:

                   me = 0.019 × VO2 (44 − Pa), where

 me = rate of evaporative water loss from the respiratory tract (g/min)

 Pa = ambient water vapour pressure (mmHg)

 = [relative humidity × saturated vapour pressure]/100

 SO refers to the loss of mass from carbohydrates and fats consumed throughout the route

 march. These were assumed to be expended entirely during the course of the route march as

 all participants lost body mass after the march. MW loss refers to the water released during

 oxidation of substrates (carbohydrates and fats) as well as glycogen stores. The method used
Original Article Page 18 of 18
in this study follows that stated in the study by Maughan et al and assumes each gram of
carbohydrate oxidised liberates one gram of water.
The figure below illustrates the mean sweat loss rate (L/hr) of the 38 participants.
Sweat rate (n=38)
0.8
0.7
0.6
Sweat rate (L/h)
0.5
Mean
0.4
0.3
0.2
0.1
0.0
0 5 10 15 20 25 30 35 40
Participant
References
1. Maughan RJ, Shirreffs SM, Leiper JB. Errors in the estimation of hydration status from
changes in body mass. J Sports Sci 2007; 25:797-804.
2. King RF, Cooke C, Carroll S, O’Hara J. Estimating changes in hydration status from
changes in body mass: considerations regarding metabolic water and glycogen storage.
J Sports Sci 2008; 26:1361-3.You can also read