Overweight and Obesity in Children and Adolescents (0-19 years) in India - Landscape Study, 2020
←
→
Page content transcription
If your browser does not render page correctly, please read the page content below
Overweight and
Obesity in Children and
Adolescents (0-19 years)
in India
Landscape Study, 2020
Overweight and
Obesity in Children and
Adolescents (0-19 years)
in India
Landscape Study, 2020
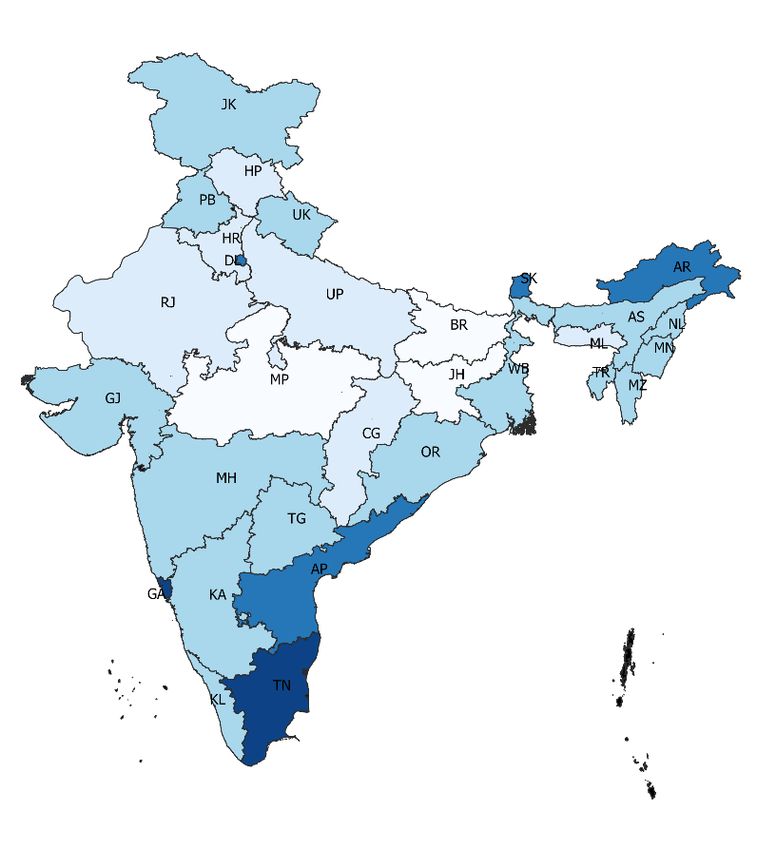
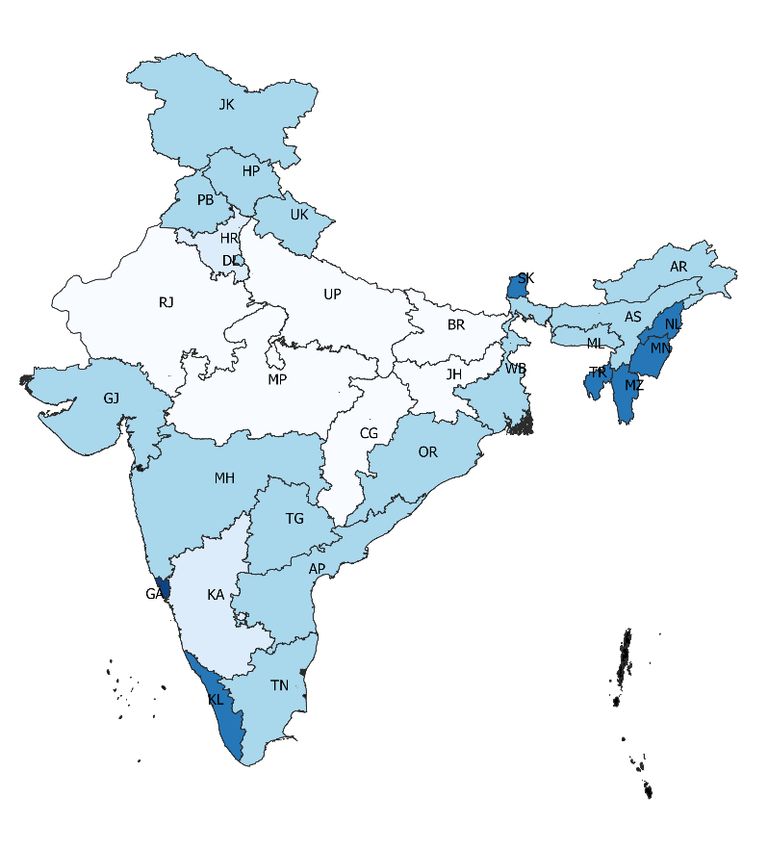
Table of Contents
     List of Abbreviations................................................................................................................................... vii
     Foreword.................................................................................................................................................................. ix
     Executive Summary........................................................................................................................................ xi
     Key Messages................................................................................................................................................... xv

1.   Introduction........................................................................................................................................1

2.   Methods.................................................................................................................................................4
     2.1. Estimating prevalence of overweight and obesity..................................................... 4
     2.2. Estimating compound annual growth rate (CAGR) for obesity...................... 5
     2.3. Estimating burden of overweight/obesity........................................................................ 5
     2.4. Measuring degree of risk................................................................................................................ 5
     2.5. Regression models............................................................................................................................... 6
     2.6. Regulation, policy and program review............................................................................... 7
     2.7. Limitations................................................................................................................................................... 7

3.   Findings..................................................................................................................................................9
     3.1. Who is affected and where?......................................................................................................... 9
     3.2. Is the situation improving or worsening?.......................................................................13
     3.3. What is the degree of risk for overweight and obesity among
          children and adolescents?..........................................................................................................13
     3.4. What are the strategies, policies, and norms to address the
          obesogenic environment and promote healthy diets and
          physical activity?.................................................................................................................................22

4.   Discussion....................................................................................................................................... 29
     4.1. Priority sub-groups for intervention to address obesity among U5,
          5 to 10 years and 10 to 19 years............................................................................................29
     4.2. Strengthening regulatory frameworks for tackling childhood
          overweight/obesity............................................................................................................................29
     4.3. Programs with potential to address childhood
          overweight/obesity............................................................................................................................30
     4.4. Research needs to improve understanding on
          overweight/obesity............................................................................................................................32

5.   Conclusion....................................................................................................................................... 33

     References...........................................................................................................................................................34
     Annexures.............................................................................................................................................................40

                                                                                                                               Table of Contents                               v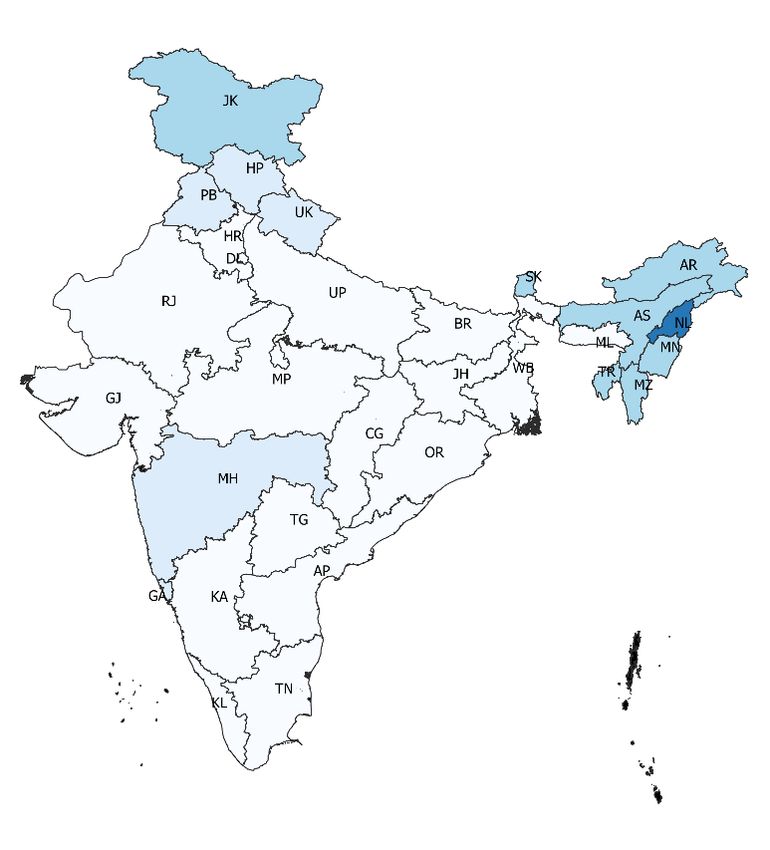
List of Abbreviations
       AIIMS   All India Institute of Medical Sciences
        aOR    Adjusted Odds Ratio
       ASHA    Accredited Social Health Activist
        BAZ    BMI for Age z Score
        BMI    Body Mass Index
        BMS    Breastmilk Substitute
        BPNI   Breastfeeding Promotion Network of India
       CAGR    Compound Annual Growth Rate
       CNNS    Comprehensive National Nutrition Survey
        DHS    Demographic Health Survey
       FSSAI   Food Safety and Standards Authority of India
       FOPL    Front-of-Pack Labelling
        GDM    Gestational Diabetes Mellitus
        GWG    Gestational Weight Gain
      GRAPH    Global Recommendations on Physical Activity for Health
        HDL    High Density Lipoprotein
       HFSS    High in Fat Sugar Salt
         HIP   Hyperglycemia in Pregnancy
        ICDS   Integrated Child Development Services
       ICMR    Indian Council of Medical Research
         IDF   International Diabetes Federation
         IEC   Information, Education and Communication
         IFA   Iron and Folic Acid
        GST    Goods and Services Tax
        IMS    Infant Milk Substitute
      INCLEN   International Clinical Epidemiology Network
        IOM    Institute of Medicine
        IYCF   Infant and Young Child Feeding
       JSSK    Janani Shishu Suraksha Karyakram
        LBW    Low Birth Weight
        LDL    Low density lipoprotein
       LMIC    Low and Middle Income Countries

                                                               List of Abbreviations   vii
MAA Mother’s Absolute Affection
MDM Mid-day Meal
MoE Ministry of Education
MoHFW Ministry of Health and Family Welfare
MoWCD Ministry of Women and Child Development
NCD Non-Communicable Disease
NFHS National Family Health Survey
NFSA National Food Security Act
OBGYN Obstetrician and Gynecologist
PDS Public Distribution System
PHFI Public Health Foundation of India
PM-JAY Pradhan Mantri Jan Arogya Yoyana
PMMVY Pradhan Mantri Matru Vandana Yojana
RBSK Rashtriya Bal Swatsthya Karyakram
RDA Recommended Dietary Allowance
RKSK Rashtriya Kishore Swasthya Karyakram
SAG Scheme for Adolescent Girls
SD Standard Deviation
SDGs Sustainable Developmental Goals
SSB Sugar-sweetened Beverage
SSFT Sub-scapular Skinfold Thickness
TSFT Triceps Skinfold Thickness
U5 Under Five
UHC Universal Health Coverage
UNICEF United Nations Children’s Fund
WC Waist Circumference
WASH Water, Sanitation and Hygiene
WHA World Health Assembly
WHO World Health Organization
WHZ Weight for Height z Score
WIFS Weekly IFA Supplementation
viii List of AbbreviationsForeword
It is my pleasure to share this report on “Overweight and Obesity in Children and
Adolescent (0-19 years) in India: Landscape Study, 2020”. The report synthesizes
key finding of a landscape study conducted using the pilot landscape analysis tool
to review the current situation, obesogenic environment and policy landscape of
childhood obesity and overweight, developed by UNICEF and IEG with contributions
by colleagues and collaborators from the NITI Aayog, Ministry of Health Family
Welfare, World Obesity Federation, World food Programme and the World Health
Organization. The report also highlights the existing national programs and policies
available, under various ministries of Government of India, for prevention of
overweight and obesity in children and adolescents.
As India faces a triple burden of malnutrition, witnessed by continuing prevalence
of stunting, wasting and micronutrient deficiency coupled with the rapid increase in
childhood overweight and obesity, the present report sheds light on where progress
has been made and where challenges remain. Socioeconomic inequalities remain
a key cause of malnutrition – both undernutrition and overweight, obesity and
other diet-related chronic diseases. This suggests that double duty action needs to
be integrated in health programmes and policies that aim to tackle multiple forms
of malnutrition through better diet, services and caregiver practices.
This review highlights gaps in the existing evidence and develops policy
recommendations emerging from the review of various research studies on food
and health systems that focus on intensifying inequalities in nutrition outcomes.
The report lays emphasis on policy measures and guidelines such as restricting
sale of high fat, sugar and salt (HFSS) foods in and within 50m radius of schools,
regulation on the marketing of HFSS foods through mass media advertising, to
address childhood overweight and obesity. Additionally, programmes such as
school health programs, antenatal care programs and community-based non-
communicable disease prevention and control programs have been identified
as important platforms for prevention of malnutrition among children through
promotion of healthy eating practices and physical activities.
Given the intricacies associated with overweight and obesity among children
and adolescents, it is critical to develop multi-sectoral action plan for tackling
malnutrition. This task should be supported with adequate investments in data
systems for implementation of programmes and tracking of progress in
population health. IEG is committed in its support for the government and
civil society organisations, in their efforts to develop evidence based policies,
programmes and interventions for addressing malnutrition.
I believe this landscape study is an important step in that direction.
Prof. Ajit Mishra
Director
Institute of Economic Growth, Delhi
Foreword ixExecutive Summary
Introduction Obesity affects 380 million children and adolescents worldwide. Low-
and middle-income countries (LMICs) are emerging hotspots for the
obesity epidemic, which threatens to exacerbate the unfinished agenda of
tackling undernutrition. If current trends persist, India is likely to contribute
11% of the global burden of child obesity by 2030. Children affected by
obesity face life-long risks for non-communicable diseases (NCDs), in
addition to adverse physical and psychosocial impacts during childhood.
The United Nations Children’s Fund (UNICEF) guidance on prevention
of overweight and obesity in children and adolescents summarizes ten
risks that increase the likelihood of obesity including risks in prenatal
period to late adolescence, as well as those related to obesogenic food
and physical activity environments. Addressing these risks as part of a
coherent strategy to tackle multiple forms of malnutrition simultaneously
requires a holistic approach across the food, health, education, social
support and water and sanitation systems. India is a signatory to the
World Health Assembly (WHA) 2025 target of halting child overweight
but has not yet set national obesity prevention targets for children aged
0-9 years. Double duty actions in the first 1000 days and in school years
are recommended; these actions are more or less embedded in India’s
national programs, such as Mothers’ Absolute Affection (MAA) program
on breastfeeding, home based care for young children by Accredited Social
Health Activists (ASHAs), Ayushman Bharat School Health Program and
the Food Safety and Standards Authority of India’s (FSSAI’s) Eat Right
school campaign. However, some of the specific actions recommended
for obesity prevention, such as restrictions on food marketing, have
not yet been introduced in India. As the finish line for the WHA 2025
targets is just five years away, this landscape analysis was undertaken to
estimate prevalence and burden of overweight and obesity in children and
adolescents aged 0-19 years, trends and progress towards the WHA 2025
target, ascertain predictors of overweight and obesity and map policies
and programs that have potential to address childhood overweight and
obesity as part of India’s continuing efforts to end all forms of malnutrition.
Methods The landscape study was conducted using the pilot landscape analysis
tool for childhood overweight and obesity, developed by UNICEF with input
from World Health Organization (WHO). The Comprehensive National
Nutrition Survey (CNNS), 2016-18 data was used to estimate prevalence
and burden of overweight and obesity and to identify predictors of
overweight/obesity. This was supplemented by findings from a desk
review of papers published in the last decade that were sourced through
the U.S. National Library of Medicine database (PubMed) and stakeholder
outreach. The Demographic Health Surveys (DHSs) for 2005-06 and 2015-
Executive Summary xi16 were used for calculating Compound Annual Growth Rates (CAGRs)
for overweight/obesity in children under five (U5) and NCDRisC data for
growth rates of obesity in middle childhood (5 to 9 years) and adolescence
(10 to 19 years). Data on sales and consumption of “healthy” and
“unhealthy” foods was sourced from Euromonitor and FAOSTAT. Estimates
for overweight for children U5 were based on weight-for-height z-scores
(WHZs) > +2SD, and estimates for obesity for children aged 5-19 years
were based on BMI-for-age z-scores (BAZs) > +2SD. Prevalence estimates
of risk factors for childhood obesity were computed. These included 1)
maternal risk factors such as maternal overweight/obesity, thinness,
excess gestational weight gain (GWG) and hyperglycemia; 2) childhood
stunting and infant and young child feeding (IYCF) practices for children
under two; and 3) risks related to diets, physical inactivity, micronutrient
deficiencies and NCDs for older children/adolescents. Four multi-variate
adjusted regression models were generated to identify predictors of
overweight/obesity as well as obesity for the age-groups of 5 to 9 years
and 10 to 19 years. Mapping of policies from all relevant ministries was
undertaken and strategy documents and guidelines sourced from these
websites. Strategies, regulations, guidelines and reports were sourced from
relevant ministries and stakeholders.
Results Overweight/Obesity prevalence in children U5 was 1.6% and in adolescents
was 5%, affecting over 18 million children and adolescents. CAGR for
overweight was 2.5% for children U5, and CAGR for obesity 8% among
girls and 13% among boys aged 5-19 years. Currently, overweight and
obesity in children and adolescents is concentrated in urban, higher-
income groups. However, the pace of increase among adolescents in rural
areas (8.3%) was double than that observed in urban areas (4.4%). Pace
of increase in urban areas was highest in urban poorest wealth quartile
(9.5%). Prevalence of obesity was high (≥10%) in states of Goa, Tamil
Nadu and Sikkim for both children aged 5 to 9 years and adolescents.
Regional distribution of maternal obesity mirrored that of children (5-9y)
and adolescents, with 38 districts identified as hotspots for maternal
risks related to obesity. Over 6 million babies were affected by maternal
hyperglycemia. Overweight and obesity in India exist alongside other
forms of malnutrition; a quarter of children aged 5 to 9 years and 57%
adolescents suffering from obesity also had multiple micronutrient
deficiencies. Also, 12-13% had pre-diabetes, over 20% had low high-
density lipoprotein (HDL) cholesterol levels and 40% had high triglycerides.
Adolescents suffering from any chronic disease condition were more
likely to be obese [aOR 1.62(1.05,2.50)]. All adolescents except 17-year-
old boys failed to meet minimum physical activity requirements. Being 8
to 9 years of age compared with 5 to 7, was associated with higher odds
of obesity [aOR 2.44 (1.65,3.62)]. Greater exposure to mass media and
xii Executive Summaryconsumption of fried foods ≥ thrice a week also increased odds of obesity
[aOR 2.74 (1.04,7.21) and 2.21 (1.25,3.89)]. At a population level, per-capita
consumption of confectionery increased by almost 10 times compared
with vegetables between 2014-19.
Food based dietary guidelines are available for nine sub-groups between
the aged 0-19 years and are the basis for government food procurements
for anganwadis and mid-day meals (MDMs) at schools. Universal food
supplementation for all pregnant women and breastfeeding mothers and
children 6 months to 6 years covers almost a third of the day’s calorie
requirements. These programs face implementation hurdles and do not
take into consideration the nutritional status of the women and children.
Antenatal care programs, too, lack customization for nutrition risks (like
counselling on nutrition and physical activity, guidance on weight gain),
except for anemia. Regulations on restricting sale of high fat, sugar and
salt (HFSS) foods in and within 50 m radius of schools have been drafted
and await implementation. Implementation of front-of-pack labelling
(FOPL) is also pending. There is no regulation on the marketing of HFSS
foods, and they are widely promoted through mass media and children
and adolescents are exposed to persuasive promotions. There is currently
no nationwide tax on HFFS foods, but India does have experience in
levying a “fat-tax” to curtail sales of branded junk foods in Kerala. The
school health programs have potential to be a platform to promote healthy
food and physical activity but parental engagement and reaching out to
non-attendees and out-of-school children require other approaches. The
recently launched, community-based NCD prevention and control programs
also have the potential to include prevention in children.
Conclusion India faces a triple burden of malnutrition, witnessed by continuing burden
of stunting, wasting and micronutrient deficiencies coupled with the rapid
increase in childhood overweight and obesity.
While currently mostly affecting children from a higher income and/or
urban background, increases in childhood obesity in India are inequitable
with rural and urban low-income populations witnessing the steepest
increases.
Halting the rise in childhood obesity in India, while simultaneously tackling
other forms of malnutrition, will require action on diets, services and
caregiver practices; in particular efforts to improve food environments will
be particularly important. Given the ongoing burden of undernutrition and
micronutrient deficiencies in India, the response should be double duty,
wherever possible.
Executive Summary xiiiAdolescent, prenatal and antenatal programs should become more
responsive to risk factors of maternal overweight and hyperglycemia.
Existing IYCF programmes should be strengthened to ensure they link
better with the prevention of overweight and obesity. Supplementary food
programmes may need to be reviewed to include healthier choices and
nutrition status-based supplementation.
School health programmes for children in India should ensure access to
healthy, nutritious and affordable diets (both the quantity and the quality/
healthfulness of food eaten) and adequate physical activity; while taking
into account the coexistence of multiple micronutrient deficiencies. There
is an opportunity to build on school health programs to develop and test a
comprehensive screening, management and referral services package for
child obesity in geographical hotspots.
Legislation to restrict the sale and promotion of HFSS foods is needed
along with expediting implementation of the regulations on restricting
HFSS sales in schools and FOPL.
Standards for physical activity should cover pre-school age groups, and
monitoring and reporting of physical activity in schools should be included
in the ongoing Ministry of Health and Family Welfare’s (MoHFW) school
health program.
While there might be limited evidence from India that the taxes have been
effective (both Kerala fat tax and National level Goods and Service tax
(GST) rate), there is substantial evidence from overseas that such a policy
will have an impact if the tax design and enforcement of the taxes are
robust.
The National Multisectoral Plan of Action for prevention and control of
NCDs lists actions by different ministries to address obesity in adulthood
and adolescence. A similar strategy is needed for children (0-9 years).
NITI Aayog (India’s policy think tank), relevant ministries, FSSAI, academic
institutions, professional associations of obstetricians and gynecologists
(OBGYNs) and pediatricians and Indian Council of Medical Research
(ICMR) should be engaged on discussion of the policy and research gaps
identified through this landscape analysis.
xiv Executive SummaryKey Messages
Who is affected 1. There are over 17 million children aged 5 to 19 years in India who are
and where? affected by obesity. If childhood obesity remains unchecked, these
numbers will increase to 27 million by 2030.
2. There are no gender differentials in prevalence of overweight and
obesity among children U5 y and adolescents.
3. Prevalence of childhood overweight and obesity is consistently higher
in urban areas than rural India across all three age-groups. But the
pace of increase is higher in rural areas.
4. Similar to other LMICs, in India, prevalence of childhood obesity
currently increases gradually with improving economic status.
However, in the urban sub-set of adolescents, pace of obesity increase
is highest in the lowest wealth quartile.
5. 11 of 28 states in India have high prevalence of childhood obesity
either in boys or girls; these states might be considered for piloting
and scaling up prevention and management strategies, that can later
be rolled out more widely.
6. Multiple micronutrient deficiencies co-exist and are associated with
overweight and obesity in children. Chronic disease risks are high
among both children and adolescents but more strongly associated
with overweight and obesity in adolescents. This suggests that obesity
prevention efforts need to be double duty, and aim to tackle multiple
forms of malnutrition through better diets, services and caregiver
practices.
Is the situation 1. It is highly unlikely that India will meet the WHA 2025 target of no
improving or increase in childhood overweight. Among children 5-19 years, from
worsening? 2005 to 2016, the rate of increase of obesity has been ‘very rapid’, with
a CAGR of 13% for boys and 8% for girls.
2. The rate of increase on overweight and obesity is much higher in rural
areas than urban. Among adolescent girls 15-19y, the rate of increase
in rural areas (8.3%) compared is almost double urban areas (4.4%).
In urban areas, the rate of increase is fastest in the lowest wealth
quartile (9.5%).
What is the Maternal
prevalence of risk 1. Overweight affected 1 in 4 mothers of children under five.
factors associated Concomitantly, 1 in 3 women were underweight.
with overweight 2. 38 districts with a total population of nearly 11.5 million women
and obesity? emerged as hotspots for targeting interventions for management of
obesity in late adolescents (15 to 19y) and young women (20 to 24y).
Key Messages xv3. Among obese mothers, evidence from local studies indicate that
nearly 30% gain more than the recommended weight during pregnancy,
thus, increasing risk of intergenerational transmission of obesity and
life-time risk of NCDs in their offspring.
4. Annually, 6 million births are affected by hyperglycaemia in pregnancy
(HIP), and around 28.5% women suffer from gestational diabetes
mellitus (GDM).
Stunting and IYCF
1. 2 in 5 infants miss out on exclusive breastfeeding in the first six
months; a protective factor against obesity in addition to its several
other benefits.
2. About 19% babies were born low birth weight (LBW); 35% children U5
were stunted.
Diet and Physical Activity
1. About 77% children reported consuming fast-food atleast on a weekly
basis and a similar proportion did not meet daily recommended
physical activity requirements.
2. In India, fast-food retail outlets and per-capita sales of vegetable
oil, sugar and confectionery witnessed very rapid growth. Sales of
confectionery increased almost 10 times faster than pulses in the last
five years.
What are the 1. India is signatory to WHA target 2025 and has targets on halting
policy, institutional increase in obesity among adults and adolescents. However, there
are no national targets for obesity for younger children (0-9y). There
and governance
is scope for retrofitting specific national targets and strategies for
mechanisms in
obesity management and prevention in national nutrition missions for
place to address hotspot states and districts.
obesity?
2. Double duty actions are integrated in health-sector programs (which
deliver the majority of nutrition-specific interventions) but not
strategized as both undernutrition and overweight related.
3. Fiscal instruments are used but their impact on sale of “unhealthy
foods” is not established (such as GST on aerated and caffeinated
beverages and processed packaged foods). Kerala fat-tax (@14.5% in
2016-17) did not impact sales of “unhealthy foods” and offers several
lessons for introducing fiscal measures.
4. FSSAI has put forward regulations on sale and promotion of HFSS
foods in and near schools, as well as regulations on FOPL (in 2020),
however these have not been implemented. There is no regulation
restricting marketing of HFSS foods more broadly (e.g., on TV, Internet,
public transportation).
xvi Key MessagesRecommendations 1. Include overweight and obesity prevention and management in
children’s pre-school and school health programs as well as in Poshan
Abhiyaan 2.0
– Integrated Child Development Services (ICDS) screening for
children under 6 should include both underweight and overweight/
obese
– Individualized report and feedback to school children who are
either underweight or overweight or obese
– Clinical examination should also include body fat distribution
(waist circumference (WC) or skinfold thickness) and screening for
NCD risk factors
– Reformulation targets, such as sugar reduction and consideration
of long term procurement policies on increasing obesity in food-
based programmes needs consideration.
2. Prioritize geographies and sub-groups to customize overweight and
obesity prevention and management
– Both urban and rural areas should focus on prevention and
management strategies
– A life-cycle approach is needed but school-entry level programs
may have higher potential in curbing the increase in obesity
prevalence from ages 5 to10 years. Rapid increases are noted in
this age-group.
3. Retrofit antenatal care and breastfeeding promotion programs to
“healthy” start to life and address implementation challenges
4. Ensure a holistic approach to “healthy” eating and lifestyle is applied,
as multiple micronutrient deficiencies and NCD risks co-exist with
overweight and obesity in children and adolescents.
5. Include physical activity promotion in pre-school years based on age-
appropriate standards. Among older children reporting on physical
activity needs to be included through school health programs.
6. Expedite roll-out of school food safety regulations drafted in 2020
– Enforce regulations on restricting sale of HFSS foods and Sugar
Sweetened Beverages (SSBs) near schools and FOPL
7. Develop guidelines for regulating sale of HFSS foods and SSBs and
promotion including advertising as done for Breast Milk Substitute
(BMS) and infant foods under Infant Milk Substitute (IMS) Act with
similar actions against violators
– Modify existing regulations from FSSAI to restrict marketing of
HFSS foods and SSBs
Key Messages xvii– Restrict media advertisements of HFSS foods and SSBs targeted
towards children
8. Examine domestic and international evidence on the impact of use of
fiscal instruments on sales of unhealthy foods, review and conduct
modelling exercises in India to obtain a clearer perspective on
implementation of fiscal policies.
9. Build on ongoing school health programs by MoHFW (including
FSSAI’s Eat Right School):
– Understand which components worked and which can be
strengthened in shaping healthier behaviours
– Parent engagement to be tested to ensure healthy eating and
physical activity during out-of-school hours especially for 5 to 9y
aged children
10. Fat tax policy will have an impact if the tax design and enforcement of
the taxes are robust. Reformation of procurement policies (for “do no
harm”) in food-based programmes
Research 1. Develop nationally representative estimates for physical activity
Priorities among pre-school, school aged children and adolescents
2. Undertake in-depth content analysis of food and beverage
advertisements on Indian television
3. Undertake in-depth analysis on consumption of Indian fast-food, and
quality of diets (in terms of refined flour, dietary fibre, nutrient density,
packaged food)
4. Evaluate ban on marketing in schools and implementation of FOPL of
packaged foods.
5. Undertake in-depth analyses of social and cultural influences on body
weight and lifestyle choices
6. Investigate the impact of fiscal policies (taxation, marketing controls)
on overweight and obesity prevention (E.g. Has GST on sweetened
beverages impacted sales? Can fat-tax be reintroduced based on
lessons from Kerala?)
7. Develop an overarching framework for gap assessment, monitoring
and tracking of the programs for management of childhood
overweight and obesity
8. Develop reference population estimates on WC and skinfold thickness
for children in developing countries
9. More robust longitudinal data collection could provide insights into
understanding the risk factors and prevention of childhood obesity.
xviii Key Messages1. Introduction
Overweight and obesity is increasing worldwide, affecting 380 million
children and adolescents. Globally, the proportion of children in middle
childhood (5 to 9 years) and adolescents (10 to 19 years) who are affected
by overweight or obesity is estimated at 21% and 17%, respectively (1).
The rate of increase in childhood overweight and obesity is
disproportionally higher among low-middle income countries (LMICs) than
developed countries (2). In South Asia, prevalence of overweight more
than tripled from 2000 to 2016 among both children and adolescents (5 to
19 years) (1). In absence of measures to check childhood overweight and
obesity, India will be home to over 27 million children and adolescents (5
to 19 years) living with obesity by 2030 and account for 11% of the global
burden (3).
Children suffering from obesity are predisposed to high blood pressure,
insulin resistance and dyslipidemia (together referred to as the metabolic
syndrome). In the longer term, children who are affected by obesity are
more likely to remain obese in adulthood and at risk of additional non-
communicable disease (NCDs)-related morbidity and mortality even after
managing the condition in adulthood (4). Many of the risks of obesity
emerge in early years and are best addressed then (5).
The United Nations Children’s Fund (UNICEF) guidance on prevention of
overweight and obesity in children and adolescents summarizes ten such
risks. These include maternal and paternal overweight as well as maternal
undernutrition, inadequate breastfeeding and complementary feeding,
unhealthy eating habits in young children and adolescents, obesogenic
food and cultural environments, epigenetic changes due to environmental
factors and socio-economic status with increased propensity among
poorer households (1). These risks have been classified using different
frameworks by researchers, one based on modifiability is presented in
figure 1.
Addressing these risks requires a holistic approach across food, health,
education, social support and water and sanitation systems. Promotion
of healthy behaviors consistently across all these systems, alongside
implementing appropriate legislations on marketing, labelling and
taxation of unhealthy foods is likely to positively impact and sustain these
behaviors (6). The wider benefits of optimum nutrition in childhood is
not only limited to reduce risk of NCDs in the future but also as improved
cognitive and physical capacities in later life, thus better productivity,
preventing mental health issues associated with obesity.
Overweight and Obesity in Children and Adolescents (0–19 years) in India 1Figure 1.1 Conceptual framework describing the etiology of childhood obesity
UNMODIFIABLE MODIFIABLE
Intrauterine Factor Socioeconomic Status Lifestyle
Changes
Maternal obesity Family income
Gestational Urban/rural
weight gain Gross national
Gestational income
diabetes
Intrauterine
evnironment
Epigenetics
Physical Activity
Sedentary activity Diet
Less exercise Breastfeeding
Academic Energy dense food
engagement Sweetened beverage
Screen time Fast food
Environment Pre-prepared
Interaction convenience food
Breakfast
consumption
Availability of junk
food
Childhood
Obesity Skip meal
Food marketing to
BMI children
Body weight Vitamin-D deficiency
Genetics
Adiposity
Monogenic
Polygenic
Sleep
Parental Determinants
Duration
Smoking
Obstructive sleep
Working schedule
Ethnicity apnea
Source: Ang YN, Wee BS, Poh BK, Ismail MN. Multifactorial influences of child obesity. Current Obesity
Reports. 2013; 2:10–22
India is committed to the World Health Assembly (WHA) Global Nutrition
target of no increase in childhood overweight (Target 4) and NCD targets
including 10% relative reduction in prevalence of insufficient physical
activity, 30% relative reduction in mean population intake of salt/sodium
and halt the rise of diabetes and obesity by 2025 (7,8). The Ministry of
Health and Family Welfare (MoHFW), Government of India launched
Ayushman Bharat (also referred to as Pradhan Mantri Jan Arogya Yoyana
2 Overweight and Obesity in Children and Adolescents (0–19 years) in IndiaPM-JAY) in 2018 with the aim to achieve Universal Health Coverage
(UHC) and meet the Sustainable Development Goals (SDGs) by 2030.
Ayushman Bharat conjugates all ongoing primary health care and school
health programs with a focus on comprehensive preventive, palliative
and curative health care. It offers the largest financial protection cover
through health insurance to vulnerable households and aims to upgrade
and up-skill 150,000 primary health care facilities as health and wellness
centers by 2022. Screening, prevention and management of NCDs in adults
is a sizeable component of holistic health and wellness approach under
the scheme (9). Further, through the Food Safety and Standards Authority
of India (FSSAI), MoHFW sets standards for regulating the manufacture,
storage, distribution, sale and import of foods for human consumption.
FSSAI also implements the Eat Right India initiative which aims to improve
food safety and healthy eating practices across the life cycle. This initiative
also has a dedicated school component (10). These school initiatives by
MoHFW complement the Department of School Education’s mid-day meal
(MDM) program for primary and middle school students.
UNICEF released program guidance on prevention of overweight and
obesity in children and adolescents in 2019 (1). In April 2020, UNICEF
developed a pilot landscape analysis tool for childhood overweight and
obesity for testing as a complement and preparatory step in building a
country program of work on overweight and obesity prevention. The pilot
tool describes a five step-by-step approach on how to undertake the
landscape analysis including: review of the current situation; review of the
obesogenic environment: review of the policy landscape; review of the
policy options; and assessment of the policy options.
The Comprehensive National Nutrition Survey (CNNS), 2016-18 provides
data on nutritional status of Indian children and adolescents (0-19 years)
(11). Data on nutritional status of 5 to 14 years age group is available for
the first time from any nationally representative survey. With five years
to the WHA targets finish line, data availability for children/adolescents
and highest political commitment to act on nutrition, this is an opportune
time for India to set national targets and plans towards no increase in
childhood overweight/obesity. Thus, a deeper understanding of the status,
determinants, policy actions and options on childhood overweight/obesity
is much needed.
With this background in mind, the landscape analyses were conducted,
with the following specific research questions in mind.
1. Who is affected and where?
2. Is the situation improving or worsening?
3. What is the degree of risk among children and adolescents?
4. What regulation, policies and programs support maternal and early
child nutrition to prevent early exposures to obesity risks among
under 5s (U5s)?
5. What are the regulations, policies and programs that influence
obesogenic environments for children and adolescents
(5 to 19 years)?
Overweight and Obesity in Children and Adolescents (0–19 years) in India 32. Methods
Children and adolescents were grouped into three categories by age –
children U5 years, middle childhood (5 to 9 years) and adolescents
(10 to 19 years).
2.1. Estimating The estimates for prevalence of overweight were drawn from the CNNS
prevalence of 2016-18 report. This survey was conducted by UNICEF in collaboration with
overweight and Population Council and the MoHFW and was designed to be representative
of the 28 states and 2 Union Territories. Data were collected from 112,316
obesity
children and adolescents 0-19 years. Of these, a subsample of 103,698
children and adolescents with valid anthropometric measurements was
considered for analyses. Sample size for maternal anthropometry data
was 33,873. Details of sampling are presented in Annex 1. The indicators
and cut-offs used for estimating overweight and obesity for the three age
groups are presented in table 2.1. Measures of skinfold thickness – triceps
skinfold thickness (TSFT) and sub-scapular skinfold thickness (SSFT) and
waist circumference (WC) were included to understand fat distribution
which is associated with chronic disease risks (12,13).
Table 2.1 Age-specific indicators and cut-offs for estimating overweight and obesity
Age-specific indicator* Overweight Obesity
WHZ (+2SD >+3SD
BAZ (5 to 19 years) >+1SD >+2SD
*BAZ: BMI for age z score, WHZ: Weight for height z score
Bivariate analysis was conducted to estimate the prevalence of overweight
and obesity disaggregated by sex (girl/boy), location (rural/urban), socio-
economic status determined by wealth index quintiles and quartiles
classification for rural and urban areas, respectively, derived using
principal component analysis of household assets, following Demographic
Health Survey (DHS) guidelines, religion, caste, mother’s age, education,
occupation and nutrition status, father’s education and occupation, access
to household toilet facility and geographical regions (north, south, east,
west, north-east) and states.
In addition, we reached out to key stakeholders, building on this team’s
earlier database on maternal obesity experts, to identify ongoing and
complete research on childhood overweight/obesity in India. In addition,
peer-reviewed articles were shortlisted through PubMed literature searches
using search terms like “overweight/obes*”, “infan*”, “child*”, “adolescen*”,
“BMI”, “matern*”, “India”. The objective of this supplementary review was
to understand the variations in prevalence of childhood obesity across
4 Overweight and Obesity in Children and Adolescents (0–19 years) in Indiaspecific target groups, such as urban versus rural school-going children.
This information revealed the scale of the problem in known high risk
groups which national averages masked.
2.2. Estimating The DHS data from the 2005-06 and 2015-16 rounds were used to estimate
compound annual 10 year trends in prevalence of overweight/obesity and obesity among
growth rate (CAGR) children U5 (14,15). The DHS does not cover the age-groups of middle
childhood (5 to 9 years) or early adolescence (10 to 14 years). Hence, the
for obesity
NCD RisC database was used to extract India data on overweight/obesity
and obesity among children in middle childhood and adolescents for
estimating CAGR (16). The WHA 2025 target of no increase in childhood
overweight was used as a comparator to determine if India could meet the
overweight/obesity targets.
2.3. Estimating Census of India (2011-2036) projections were used to extrapolate
burden of prevalence data and arrive at numbers of children and adolescents
affected by overweight/obesity (17). Quantum GIS v.3.6.3 was used to
overweight/obesity
graphically present the distribution of overweight/obesity.
2.4. Measuring 2.4.1. Maternal risk factors
degree of risk Estimates of 12 variables that are known maternal risk factors for child
overweight and obesity were drawn from multiple sources referenced
here and in the findings section. The indicators included those of women
and more specifically pregnant women, based on data availability were:
Maternal overweight/obesity (11), obesity and their trends (11,14,15),
maternal thinness (classified using Asian Body Mass Index (BMI) cut-offs)
(11), gestational weight gain (GWG) more than recommended (18,19),
gestational diabetes mellitus (GDM)/ hyperglycemia in pregnancy (HIP)
(20,21), smoking tobacco, alcohol consumption (11), low birth weight
(LBW) (4 kg) (11). Data on the trends in
GDM/HIP were sourced but found to be not available for India. The degree
of risk was assessed using the classification in the UNICEF pilot landscape
analysis tool.
2.4.2. Risk factor among children U5
Estimates of 10 variables that are known child risk factors for child
overweight and obesity were drawn from multiple sources detailed in the
findings section. The indicators were: childhood stunting (height for age
z-scoreand adolescence (23). Daily consumption of sugars, fats and oils and
consumption of fried foods, junk foods, sweetened beverages for at least
3 days in a week were also analyzed (11). Estimates of 12 variables of
diet related risk factors were drawn from multiple sources referenced
here and in the findings section. The variables were: consumption of
sweetened beverages (11), confectionery and junk foods for at least
3 days in a week (11,24,25), CAGR for sales of sugar, confectionery,
pulses, vegetables (26) and retail outlets of leading fast food chains (27),
exposure to advertisements of high fats, salt and sugar foods (HFSS)
through television (28,29), schools providing food complying with national
standards and access to drinking water in schools and households. The
degree of risk was assessed using the classification in the UNICEF pilot
landscape analysis tool. There were seven other variables recommended
in the UNICEF landscape analysis tool that could not be included in
our analysis for lack of data. These were: CAGR for oils/oil seeds and
sweetened beverages, schools providing sweetened beverages and HFSS
foods through vending machines, schools accepting endorsements from
fast-food chains, proportion of relief foods meeting dietary guideline
requirements compared to total relief foods and value of subsidized
food meeting dietary guideline requirements compared to total
subsidized food.
In this section, prevalence of anemia, individual and multiple micronutrient
deficiencies (iron, folate, vitamin B12, vitamin A, vitamin D, zinc) and
any chronic condition or its precursor (pre-diabetes or high HbA1c,
hypertension, high total cholesterol, high low density lipoprotein (LDL), low
high density lipoprotein (HDL), high triglycerides, high serum creatinine)
were also estimated (11).
2.4.4. Physical activity and air pollution related risk factors in middle
childhood and adolescence and in women?
The UNICEF landscape analysis tool included 20 indicators to measure
risks related to physical activity and one on air pollution. Data was
available on 12 indicators of physical activity: insufficient physical activity,
trends and gender differentials, active transport to school (walking or
cycling in last 7 days), physical activity options in schools, screen time >3
hours per day, insufficient duration of sleep (quintile, region (north, south, east, west, north-east), mother’s education,
father’s occupation, currently in school, exposure to mass media (low/
medium/high), internet access, access to household sanitation facility,
diet (consumption of >=5 food groups daily, consumption of unhealthy
food groups >= 3 times a week including fried foods, junk foods, sweets or
confectionery (Indian sweets, chocolates, candies, desserts) and aerated
drinks) and co-morbidities (anemia or any micronutrient deficiency (out of
the six deficiencies studied– iron, folate, zinc, vitamin A, B12 and D) and
any chronic condition (presence of any one of the risk factors of NCDs –
pre-diabetes or high HbA1c, hypertension, high total cholesterol, high LDL
cholesterol, low HDL cholesterol, high triglycerides, high serum creatinine)).
To account for the effect of inflammation on iron and vitamin A status,
cases with high inflammation (C-reative protein CRP>5mg/l) were excluded
from the analyses. We present adjusted odds ratios (aORs) and 95% CIs
and considered two-tailed p values ofand reaching out to several stakeholders, 13% (21 of 156) data/information
needs remained unanswered. These included critical data on diet and
physical activity related risk factors for 5 to 19 years aged children/
adolescents, evidence on social norms that might promote overweight or
obesity in children/adolescents and factors influencing physical activity
patterns. Further, estimates on maternal risk factors like excess GWG and
GDM as well as physical activity in middle childhood and adolescence were
drawn from local studies rather than nationally representative surveys. The
CAGR for sales of BMS and infant foods could not be calculated per capita
due to lack of age-specific Census of India population estimates for infants
and young children. The degrees of risk cut-offs for variables known to
be associated with overweight/obesity provided in the landscaping tools
were not always backed by evidence based public health significance
levels. While we did apply these cut-offs, but we also undertook regression
analysis to determine the strength of the association of these indicators
with both overweight/obesity and obesity as described in section 2.5. We
studied growth rates of large fast-food chains in India, however growth
of local brands, Indian street food consumption could have also be
considered, for which we found limited information.
8 Overweight and Obesity in Children and Adolescents (0–19 years) in India3. Findings 3.1. Who is The prevalence of overweight/obesity increased with each stage of life affected and cycle from birth to adolescence. It ranged from 1.6% in youngest age group where? (
There were no gender differentials in prevalence of overweight/obesity
among children U5 years and adolescents (Figure 3.2). Prevalence of
childhood overweight/obesity was consistently higher in urban areas than
rural India across all three age-groups and increased with increasing wealth
quintile (Figure 3.2). After controlling for other variables, children living
in urban areas had higher odds of obesity than those in rural areas in
middle childhood (aOR 2.17[1.24, 4.23]), but not adolescence (Annex 2
and 3). Additionally, being 8 to 9 years of age compared with 5 to 7,
increased the odds of both overweight (aOR 2.44[1.65, 3.62] and obesity
(aOR 1.87[1.02, 3.43]) (Annex 2).
Figure 3.2 Prevalence of overweight/obesity by sex, location and wealth quintile, India, CNNS 2016-18
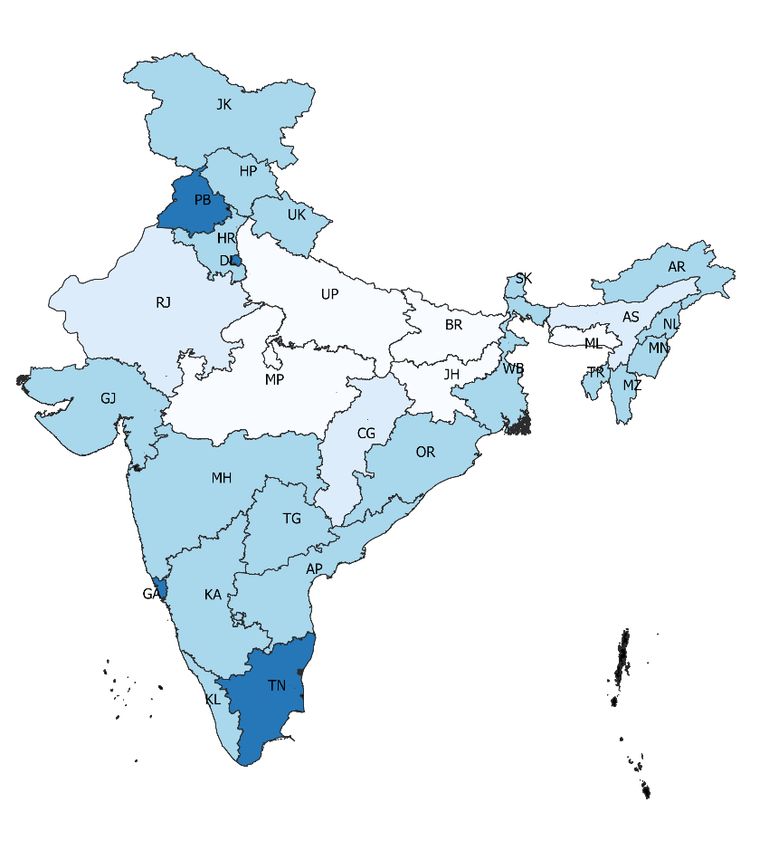
State-wide variations in childhood overweight and obesity
Despite the very low prevalence of overweight/obesity in children U5, one
state (Nagaland) had a high prevalence (9% toBox 1
Findings on the prevalence of
childhood overweight/obesity from
research studies across diverse
Indian settings
Through web searches and stakeholder outreach, 23 studies on the prevalence of child or
adolescent overweight/obesity that were published within the last decade were identified
(Annex 4). Of these, 21 were school based, and one each in a health facility and a community
setting. The geographic spread was across 11 states with three multi-centric studies. Only
three studies included children in rural areas. Sample sizes ranged from 84 to 20,000 and
child ages from newborn to 19 years. The highest prevalence of overweight/obesity at 37%
was reported in a study from Vadodra, Gujarat, in adolescents aged 10-18 years (Pathak
et al, 2018) (35), followed by 27% and 24% in studies from north-eastern state of Assam in
children 10-14 years (Saikia et al, 2018) and Sikkim in adolescents 11-19 years (Kar et al,
2015), respectively (36,37). The lowest reported prevalence was around 4% from a study in
Odisha (Mishra et al, 2017) (38). In studies that purposively selected middle to high-income
settings, the prevalence of childhood obesity exceeded 20% (Kuriyan et al, 2012, ages 10-19
years; Jagadesan et al, 2014; Misra A, 2011, ages 8-18 years) (39,40,41). Irrespective of age,
the prevalence of obesity among children in rural areas was lower than 5% (Ganie at al, 2017,
Pillai R, 2018, ages 6-18 years) (42,43). The urban and rural estimates of overweight/obesity
in childhood and adolescence drawn from CNNS were much lower than those reported in
these studies.
Figure 3.3 State-wise prevalence of overweight/obesity in children U5, India, CNNS 2016-18
Boys Girls
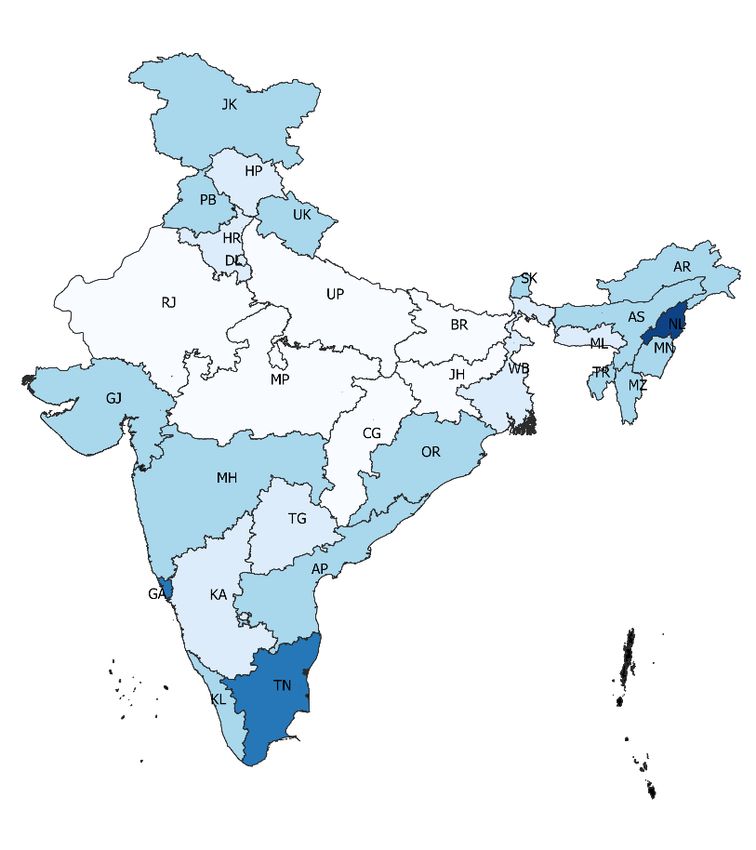
Very low:Figure 3.4 State-wise prevalence of overweight/obesity in middle childhood (5 to 9 years), India,
CNNS 2016-18
Boys Girls
Very low:3.2. Is the The prevalence of child overweight and obesity is relatively low in India, but
situation improving the situation is worsening. The rate of increase of overweight was relatively
or worsening? slower among children U5 but still rapid at 2.4% (National Family Health
Survey (NFHS) 2005-06 and 2015-16). Consequently, India is highly unlikely
to meet the WHA 2025 target of no increase in childhood overweight.
Additionally, according to estimates from the World Obesity Federation,
the rate of increase of obesity is ‘very rapid’ among children in middle
childhood and adolescents with a CAGR of 13% for boys and 8% for girls.
The disaggregated CAGR for urban and rural areas revealed a very rapid
pace of increase for obesity among adolescent girls in both settings,
but it was particularly rapid for rural areas (Table 3.2a); the increase in
overweight/obesity among children U5 was also more rapid in rural areas
(Table 3.2b). Within the adolescent urban sub-set, children in the lowest
wealth quartile had the highest CAGR (9.5%). However, this was not
observed among children U5.
3.3. What is the 3.3.1. Maternal risk factors
degree of risk for Four of six maternal factors for overweight and obesity in childhood
overweight and for which risk categorization was available were classified as high risk
obesity among (thinness, LBW, GWG higher than recommended, GDM/HIP) and two as
moderate risk (obesity, smoking). Overweight/obesity affected one in four
children and
mothers of children U5 and 15% suffered from obesity. At a CAGR of 11%
adolescents?
from 2005-06 to 2015-16, the increase in levels of maternal obesity was
very rapid. Concomitantly, almost one in three mothers were thin. Local
studies indicated that almost 30% mothers living with obesity gained more
than recommended weight during pregnancy as per Institute of Medicine
(IOM) classification (18). Data on GWG in thin and obese mothers was
inconsistent across two studies with the proportion of thin women gaining
more than recommended gestational weight similar to obese mothers
in one study (19) and much lower in another study (18). Almost one in
five newborns were LBW while 4% weighed more than 4 kgs at birth (11).
Prevalence of GDM and HIP was alarmingly high based on local studies
as well as the International Diabetes Federation (IDF) (Table 3.3). The
Federation report also claimed 6 million newborns were affected by HIP
annually in India (20).
Table 3.2a 10 yr CAGR for obesity among adolescent girls (15 to 19 years) by wealth quartiles
(NFHS 2005-06 and 2015-16)
Urban Rural Total
Wealth 10 yr 10 yr 10 yr
NFHS-3 NFHS-4 NFHS-3 NFHS-4 NFHS-3 NFHS-4
quartile CAGR CAGR CAGR
Quarter 1 1.7 4.3 9.5 0.7 1.1 4.3 0.8 1.3 5.0
Quarter 2 3.3 6.6 7.2 0.9 2.1 8.7 1.1 2.9 10.2
Quarter 3 6.0 9.2 4.4 1.2 3.3 10.7 2.3 5.6 9.3
Quarter 4 9.1 10.5 1.4 2.5 6.0 9.2 5.8 8.8 4.3
Total 4.8 7.3 4.4 1.3 2.9 8.3 2.4 4.3 6.0
Overweight and Obesity in Children and Adolescents (0–19 years) in India 13Table 3.2b 10 yr CAGR for overweight/obesity among children U5 by wealth quartiles
(NFHS 2005-06 and 2015-16)
Urban Rural Total
Wealth 10 yr 10 yr 10 yr
NFHS-3 NFHS-4 NFHS-3 NFHS-4 NFHS-3 NFHS-4
quartile CAGR CAGR CAGR
Quarter 1 3.0 2.2 -3.1 1.4 1.9 2.6 1.4 1.9 3.1
Quarter 2 2.5 2.8 1.0 1.5 1.8 2.2 1.7 1.9 1.1
Quarter 3 3.1 3.5 1.3 1.4 2.2 4.5 1.8 2.4 2.9
Quarter 4 3.1 4.1 2.8 2.2 2.7 2.2 2.8 3.5 2.3
Total 2.9 3.1 0.7 1.6 2.1 2.8 1.9 2.4 2.4
Table 3.3 Prevalence of maternal risk factors for overweight or obesity in children
Risk factor Mothers of children U5 Risk category Data source
(15-49 years) %
Maternal overweight* BMI ≥25kg/m2 25.2 NA CNNS 2016-18 (11)
Maternal obesity* BMI ≥30 kg/m2 15.3 Moderate
Trends in prevalence of maternal 5.5 NA NFHS-3 (2005-06)
overweight (CAGR) (14) and CNNS
(2016-18)(11)
Trends in prevalence of maternal 11.4 Very rapid growth
obesity (CAGR)
Thin 28.0 High CNNS 2016-18 (11)
GWG more than recommended Subnational data: 18
Chennai, Tamil Nadu
(N=2728 pregnant women)
Thin: 3.3 High
Normal: 7.1
Overweight: 8.7
Obese: 28.5 19
Raipur, Chhattisgarh N =
1000 pregnant women
Thin: 26.6
Obese: 29.4
GDM 28.5 20
6.5 -16.3 High 16 studies
(2011 to 2020)
HIP 18.9 21
Tobacco smoking 6.3 Moderate CNNS 2016-18 (11)
Alcohol consumption 0.8 NA
Low birth weight (4kg) 4.2 NA
* Estimates for maternal overweight and obesity includes all mothers of children under-5 surveyed in CNNS, aged 15-49 years
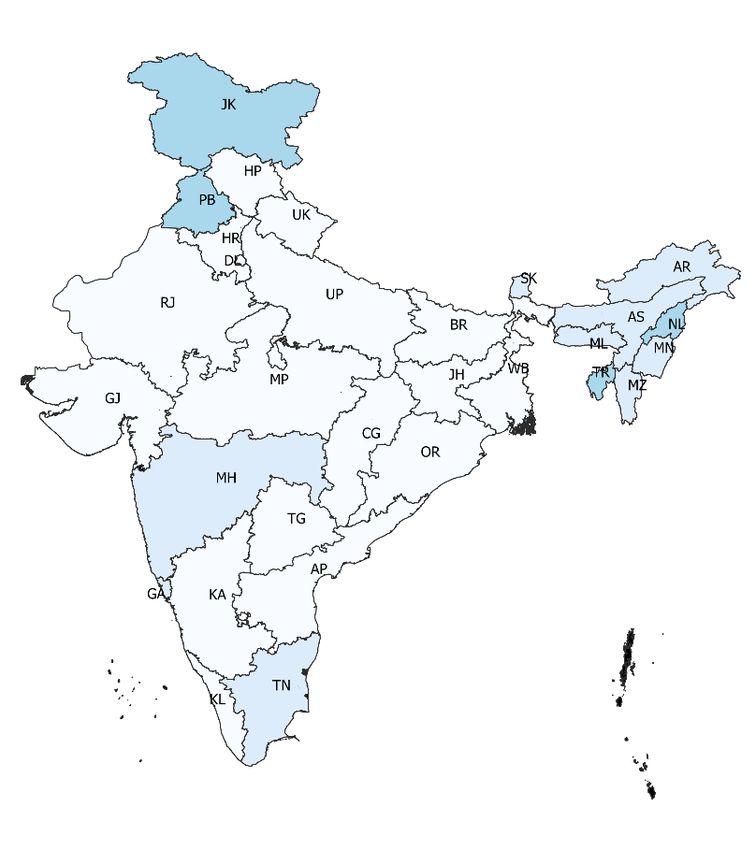
14 Overweight and Obesity in Children and Adolescents (0–19 years) in IndiaBy juxtaposing district level estimates of moderate to high prevalence of
obesity among girls in late adolescence (15 to 19 y) and among young
women (20 to 29 y), 38 hot-spot districts for priority action were identified
(Figure 3.6).
3.3.2. Risk factors among children U5
Indian children were at very high risk of being stunted. Nearly 35% children
U5 were stunted in 2016-1018 but the situation improved from 2005-06
to 2015-16 with a negative CAGR. Children were at a relatively low risk of
obesity resulting from inappropriate breastfeeding practices as over half
were breastfed within an hour of birth and similar proportion exclusively
breastfed. However, there was a very rapid growth in sales of both BMS
and commercial complementary foods in the last five years, indicating an
adverse trend in Infant and Young Child Feeding (IYCF) practices. Diversity
in complementary foods was a concern with less than half infants and
young children consuming no fruits or vegetables in the day preceding
survey, while 14% had a beverage with added sugar (Table 3.4).
Figure 3.6 Districts with both a moderate prevalence of obesity in 15-19 years old girls and moderate-
high prevalence of obesity in 20-29 years old women, NFHS-4 2015-16
Overweight and Obesity in Children and Adolescents (0–19 years) in India 15Table 3.4 Prevalence of risk factors for obesity in children U5 years
Indicators Children U5 (%) Risk category Data source
Children U5 stunted 34.7 Very high CNNS 2016-18
(11)
Trends in stunting prevalence (CAGR) -2.6 Decline CNNS 2016-18
(11) and NFHS-3
Breastfeeding initiated within an hour of birth 56.6 Moderate CNNS 2016-18
(0-23 months) (11)
Infants 0-5 months exclusively breastfed 58.0 Moderate CNNS 2016-18
(11)
Children 12–23 months who were breastfed the 27.5 NA CNNS 2016-18
previous day (11)
Infants/ children 6–23 months who consumed a 14.0 NA
sugar-sweetened beverage during the previous day
Children 6–23 months who did not consume any 42.9 NA
vegetables or fruits during the previous day
Trends in sales of BMS (CAGR 2013-19) 3 Very rapid Euromonitor
growth 2013-2019 (22)
Trends in sales of commercial complementary 9.2
foods (CAGR 2013-19)
Figure 3.7 Prevalence of micronutrient deficiencies and anemia among children U5 who were affected
by overweight/obesity, CNNS 2016-18
Two in five children affected by overweight/obesity had multiple
micronutrient deficiencies (Figure 3.7). Iron deficiency was the most
common, followed by zinc deficiency. Anemia affected 34% of children.
16 Overweight and Obesity in Children and Adolescents (0–19 years) in IndiaYou can also read