PART 2 THE CHANGING SHAPE OF THE CPG DEMAND CURVE - COVID-19 and Navigating the Path Ahead - IRi
←
→
Page content transcription
If your browser does not render page correctly, please read the page content below
COVID-19 and Navigating the Path Ahead

PART 2 ̶ THE CHANGING
SHAPE OF THE CPG
DEMAND CURVE
May 15, 2020

                         Read Other CPG Demand Curve-Focused Reports:
                         Part 1 - The Changing Shape of the CPG Demand Curve (4-24-2020)
Executive Summary                        MEAT
Meat and Millennials’ Impact             • While retail inflation has increased, wholesale prices
                                           have soared.
on CPG Demand Curve                      • Larger pack sizes and unused promotion allowances
                                           have tempered higher meat prices for consumers.
COVID-19 continues its reach             • Instability at the plant-level has consumers worried
beyond personal health to CPG              and short-term capacity uncertain.
Demand, Inflation, Supply Chain and
more. IRI is tracking these shifts and
their impact on changing the CPG
                                         SUPPLY CHAIN
Demand Curve. In this week’s report,
                                         • Supply chain challenges for meat provide a cautionary
we take a closer look at the Meat          note to other categories.
industry, which has been shaken by       • Supply of products continues to be lower than pre-
increased demand and supply chain          COVID-19 levels. To help manufacturers meet increased
                                           at-home demand, IRI has launched the IRI CPG Supply
challenges. We also observe the role       Index™ that provides a granular view of in-stock levels
Millennials play in changing the CPG       across departments, aisles, regions and states.
demand curve.

 HOW CAN IRI HELP?                       MILLENNIALS
 • The IRI COVID-19 Dashboard            • Largest portion of U.S. population is vulnerable to
                                           economic fall-out.
 • IRI COVID-19 Impacts
                                         • From extremely concerned to relatively relaxed,
 • The IRI CPG Demand Index™               Millennials demonstrate different levels of COVID-19
                                           concerns and behaviors.
 • IRI Inflation Tracker™
                                         • Retailers and manufacturers can help Millennials see
 • NEW: IRI Supply Index                   value beyond price and ease their concerns for safety.

                                                                                                     © 2020 Information Resources Inc. (IRI). Confidential and Proprietary.   2
COVID-19
Navigating the
 Path Ahead

Meat Impact on
 the Changing
  Shape of the
 CPG Demand
     Curve

                 © 2020 Information Resources Inc. (IRI). Confidential and Proprietary.   3
Meat is the Star Performer in
     Market Context            Year of Pandemic-Driven Growth
     and Conditions                                  39.8%
• Roughly two months into                                            36.6%
  the COVID-19 pandemic,
  grocery shopping
  purchase patterns remain
  strong
• Total Meat (Fresh +                        23.6%                                    23.8%
  Processed) emerged as                                      22.7%
  the sales leader vs. all
  major store departments                                                     18.1%
                                   15.3%
• Most recent 4 weeks          13.3%
                                                                                                       14.7%        14.0%
  dollar (w/e 5/3/20) growth                                                                                    12.0%
  is +40% and building                                                                          8.9%                                8.7%
  momentum as shoppers
  stock up in response to
  extensive media coverage                                                                                                                 3.2%
  of processing plant
  closings and to meet
                                Total Store Total Fresh & Total Frozen            F&B (ex.         Produce        Refrigerated        Total
  demands of more in-home      with Perimeter Processed (ex. Poultry)              Fresh                          Departments       Nonedibles
  meal occasions                                Meat                             Perimeter)

                                                               YTD 2020              Latest 4 WE 5-3-20
                                                                Meat Dollar Sales Growth

                                 Source: IRI MULO POS data for periods indicated – Fixed and Random Weight items integrated
                                                           © 2020 Information Resources Inc. (IRI). Confidential and Proprietary.          4
Meat Dollar Sales Continue to Outpace Volume Sales, With Gap Growing
Fresh Meat Sales by Week During COVID-19 Crisis
• Increasing price inflation accounts for growing gap between dollar sales and volume sales
• Over the last four weeks, price per volume is up ~13% vs. year ago
• Consumer fears of potential product shortages fueled stock-up on meat products, even
  in light of implied price increases
                                         91.8%
                            80.3%        78.0%

                                    71.6%                                                                                                                51.3%
                                                              36.8%                 43.6%                                        49.7%
                                                                   41.4%

                                                      28.5%          34.5%          36.4%                       17.1%                                        37.2%
                                                                                                                                              34.8%
                8.1%
    -0.9%              5.2%                                                                                 2.7%
   -3.9%
       3.1.20      3.8.20      3.15.20      3.22.20       3.29.20       4.5.20              4.12.20               4.19.20                 4.26.20                 5.3.20

                                                 Meat Dollar Sales           Meat Volume Sales

                                                                             Source: IRI MULO POS data for periods indicated – Fixed and Random Weight items integrated
                                                                                                       © 2020 Information Resources Inc. (IRI). Confidential and Proprietary.   5
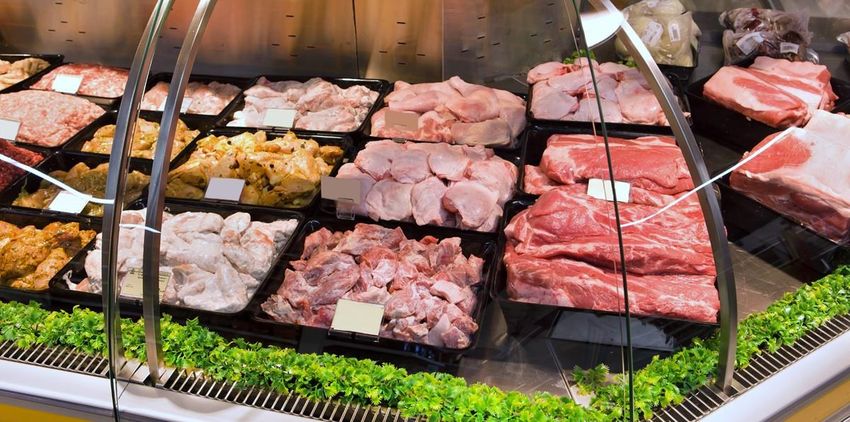
As Consumers Buy More Meat for At-Home Occasions, Key
Consumer Purchase Metrics Show Considerable Growth vs. 2019
The Meat Department Has Benefitted From Growth
On Sales, Buyers, Trips and Dollars / Trip
                    Latest 4 Weeks Ending 5.3.2020 vs. YA
            58.4

    36.4

                                 18.3                           19.4     17.9
                                                    13.5
                                            11.4

                        2.6

   Dollar Sales %   Buyers % Change vs. Product Trips per     Dollars per Trip %
   Change vs. YA            YA         Buyer % Change vs.      Change vs. YA
                                              YA

                        All Trip Missions   Pantry Stocking

                                                                                   © 2020 Information Resources Inc. (IRI). Confidential and Proprietary.   6
Pork, Beef, Turkey and Chicken All Contributed to Recent Total Meat Increases

         Fresh Protein Sales – Dollar and Volume                                                Retail Meat & Protein Price per Volume (2019 & 2020)
                                                                                                                            $5.38
                                                  50.6%                                                                $4.83
                 45.5%
 39.3%                                                  40.7%                                         $3.81
                                                                 35.4%                           $3.46
                       34.6%                                                                                                                                                                 $3.22 $3.34
                                  29.5%
      26.4%                            24.1%                                                                                                                         $2.61 $2.83
                                                                       23.1%                                                                $2.35 $2.46

                                                                                                     10%                   11%                     5%                     8%                      4%

 MEAT TOTAL      Beef Total -   Chicken Total -   Pork Total -   Turkey Total                  MEAT TOTAL              Beef Total -        Chicken Total -           Pork Total -           Turkey Total
                   Fresh            Fresh           Fresh                                                                Fresh                 Fresh                   Fresh

           Dollar Sales - 4 WE 5.3.20     Volume Sales - 4 WE 5.3.20                                                      5.3.19      5.3.20       PPV % Chg. vs. YAG

• All proteins experienced substantial dollar sales                                            • Beef, up 11% vs. YAG, accounts for majority of retail
  growth during latest 4 weeks.                                                                  meat price increases due to tight supply; last week’s
                                                                                                 production was 32% below 2019 volumes.
• With the exception of chicken, all meat categories
  showed price increases of 10% or more vs. year ago.                                          • Retail price increases for pork, chicken and turkey
                                                                                                 have been more moderate than beef but still
                                                                                                 substantial vs. YAG.

                                                                          Source: IRI MULO POS data for periods indicated – Fixed and Random Weight items integrated, 4-weeks ending 5/3/2020.
                                                                                                                             © 2020 Information Resources Inc. (IRI). Confidential and Proprietary.        7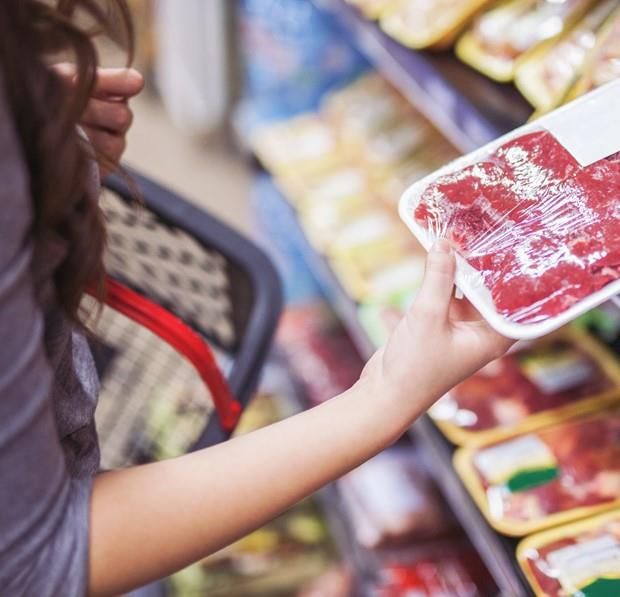
Continued Short-Term Stress as Meat Wholesale Markets Remain Volatile

                                                         U.S. Wholesale Beef and
                                                         Pork Pricing (USDA)
                                                         • Wholesale beef and pork
                                                           prices doubled in April.
                                                         • Recent pork production is
                                                           down ~24% from 2019
                                                           levels, while beef is 32%
                                                           below 2019 volumes.
                                                         • However, stress is short-
                                                           term and pork should
                                                           rebound to 2019 levels;
                                                           beef will improve, but
                                                           remain down 5% from 2019.

                                                                                CLICK HERE FOR MORE!

                                                                                           Source: Bloomberg / USDA
                                                   © 2020 Information Resources Inc. (IRI). Confidential and Proprietary.   8
Processors Simplify Supply Chains by Reducing Items per
Store and Focusing On Higher Velocity Items and Larger Packs
Average Items Per Store Selling Per Week

                        353.2
                                                                             349.4
                                                                 346.8
                                                      342.9                              343.4        344.2
342.5                342.5
                                339.4      339.5
   334.7 334.9
              334
                                   329.8

                                                         317.9       317.8
                                                                                 313.4
                                                                                             309.4           309.2
                                              307.5

 March 1   March 8   March 15 March 22 March 29        April 5    April 12    April 19    April 26       May 3

                                               2019    20202

                                                                                          Source: IRI MULO POS data for periods indicated – Fixed and Random Weight items integrated
                                                                                                                    © 2020 Information Resources Inc. (IRI). Confidential and Proprietary.   9
IRI Supply Chain Index™ Shows Meat Supply Challenged to Meet Demand
% In-Stock

                                                                   CLICK HERE FOR MORE!

                                                                                   Source: IRI CPG Supply Index
                                              © 2020 Information Resources Inc. (IRI). Confidential and Proprietary.   10
IRI Supply Index Illustrates Meat Supply Chain
Stress Impacting U.S. In-Stock Positions
% In-Stock
• Daily meat distribution is down ~18ppts from pre-COVID-19 levels.
• Consumers are encountering sparse inventory levels and out-of-stocks on key items.
• A growing number of retailers are enforcing purchase limits on total number of meat packages.
• A combination of constrained supply and stock-up buying continues to stress the meat system.
• President Trump Executive Order on April 29 cites Defense Production Act to keep plants operating.
• Starting May 1, processing plants that were closed to address COVID-19 outbreaks are reopening.
CLICK HERE FOR MORE!
Source: IRI CPG Supply Index
© 2020 Information Resources Inc. (IRI). Confidential and Proprietary. 11Key Considerations Moving Forward
Demand / Pricing Considerations Supply Considerations
• Wholesale prices have recently soared • Speed with which processors create safe work environments directly
considerably more than retail prices impacts capacity and throughput
• Retailer long-term purchase contracts have • Workers’ health and safety concerns will impact attendance even if
dampened impact of wholesale increases plants re-open
• Contracted promotional allowances have • Supply chain flexibility must manage both retail and foodservice demand
absorbed some price increases for retailers shifts as markets open / close
• Larger price increases at retail will come soon • The USDA forecasts only minor impact to annual volume, and it is clear
if plants cannot re-establish full capacity that the supply shortage has bottomed and will improve
© 2020 Information Resources Inc. (IRI). Confidential and Proprietary. 12COVID-19
Navigating the
Path Ahead
Millennials
Impact on the
Changing
Shape of the
CPG Demand
Curve
© 2020 Information Resources Inc. (IRI). Confidential and Proprietary. 13All Generations Are Impacted by the Health and Economic Toll of COVID-19
But the Most Lasting Shifts will Occur Among Millennials and Older Gen Z
BABY SILENT
GEN Z MILLENIALS GEN X BOOMERS GENERATION
1996 – 2010 1977 – 1995 1965 – 1976 1946 – 1964 1945 and prior
(ages 10-24) (ages 25-43) (ages 44-55) (ages 56-74) (ages 75+)
Widespread Columbine Iranian Hostage Vietnam Great Depression
Terrorism: ISIS, Shootings Crisis
Boston Marathon Civil Rights WWII
9/11 Challenger Disaster Movement
Bombings Korean War
Hurricane Katrina Collapse of JFK / MLK
Mass Shootings: The Cold War
Berlin Wall Assassinations
Sandy Hook,
Parkland, Orlando AIDS Epidemic
The Great Recession
© 2020 Information Resources Inc. (IRI). Confidential and Proprietary. 14Millennials are Among the Hardest Hit By the
Health and Financial Fallout of COVID-19
THEIR JOBS ARE AT RISK THEY’RE NOT TAKING THEY’RE ALSO
THIS LIGHTLY PARENTS
45% of 18-29 year-olds and
31% of 31-38 year-olds have 55% are extremely Two-thirds of Millennials in
experienced work reductions concerned about peak child bearing years (30-
due to the coronavirus the coronavirus 38 year-olds) have children
50%
45% 43%
35%
31%
25%
Working Less / Furloughed / Lost Job HH Income at Risk Because of Coronavirus
Because of Coronavirus
Total Younger Millennials Older Millennials
ages 18-29 ages 30-38
Source: IRI Survey fielded 5/1-5/3 among National Consumer Panel representing Total US Primary Grocery Shoppers / 1 Centers for Disease Control and Prevention / 2 SOURCE: www.census.gov
© 2020 Information Resources Inc. (IRI). Confidential and Proprietary. 15Already Financially Vulnerable,
Millennials Expect the Economic Crisis
to Last Longer Than the Health Crisis
~40%
of Millennials have
had their work Expected Duration Expected Duration
hours reduced or of Health Crisis of Economic Crisis
lost their jobs as a
34% 36%
result of the COVID- 42%
19 crisis to date 73% 74% 67%
21% 23%
20%
$497.6B 26%
29% 25%
13% 10%
13%
student loan debt 13% 13% 10%
8% 15%
10% 8% 5%
among 15.1MM 3%
borrowers aged 25-341 Total Younger Older
Millennials Millennials
Total Younger Older
Millennials Millennials
7+ Months 4-6 Months 2-3 Months 1 Month or Less
© 2020 Information Resources Inc. (IRI). Confidential and Proprietary. 16COVID-19 Impacts Consumers in Different Ways
With Three Distinct Mindsets for Millennials
Consumers of All Ages Will Move Through the COVID- Three COVID-19 Crisis Driven Mindsets are
19 Crisis and Beyond Based on a Convergence of Disproportionately Prominent Among Millennials
Influencing Factors; Several ‘Mindsets’ Emerge
Concerned
because of restrictions created to
My household’s income is at risk
and Constrained
Concerned &
Constrained (Millennial Index = 208)
curb the coronavirus
Concerned &
Passive Have an “expect and prepare
for the worst” approach to
COVID-19: practical, self-
We Got This and financially
It Is restricted.
What It Is
It Is What It Is
(Millennial Index = 157)
We Got This Concern both for health
What’s all
the Fuss (Millennial Index = 191) and economy but
Afraid & accepting. Believe that
Insulated Optimistic but focused COVID-19 is overblown
more on health- impacts and return to normal will
of COVID-19 than happen soon.
financial; confident
they’ll recover.
Extremely concerned about COVID-19
Source: IRI COVID-19 Segmentation, April, 2020
© 2020 Information Resources Inc. (IRI). Confidential and Proprietary. 17Millennials are Increasing Their Spend in Channels That Support Their Mindset
% Chg. vs. YAG in Dollars / 1,000 HHs (4 WE 4/12/20 vs. 4/14/19)
Concerned &
We Got This It Is What It Is
Constrained
MOST CONCERNED LEAST CONCERNED
TOTAL
Online shopping addresses In addition to price, these Online spending changed
physical safety and enables Millennials find more to least; greatest shifts to Other
easy price comparisons like at Dollar stores Outlets, Grocery, Dollar
ALL OUTLETS 13% 33% 16% 17%
Internet 39% 142% 43% 9%
Dollar 24% 28% 56% 27%
Grocery 18% 10% 25% 30%
Walmart Total 11% 61% 16% 8%
Drug 5% 53% -12% 21%
Club 2% 42% 17% -17%
Mass Merch / Supercenter -7% 28% -21% 13%
Specialty (Other Outlets) -21% -59% -3% 48%
Source: Total U.S. All Outlet Sales Linked to actual purchase behavior by National Consumer Panel representing Total US Primary Grocery Shoppers, April, 2020
© 2020 Information Resources Inc. (IRI). Confidential and Proprietary. 18Confidence Mitigates the Impulse to Stock Up; Two-Thirds of
Concerned & Constrained Stock Up for Two Weeks or More
Being more anxious than other groups, 65% of Concerned & Constrained demonstrate
Concerned & Constrained are stocking up for 2 weeks pantry stocking behavior; It Is What It Is
or more, compared to fewer than half of It Is What It Is. look to have meals on hand.
% Buying Groceries to Last For… % Chg. vs. YAG in $/1,000 HHs (4 WE 4/12/20 vs. 4/14/19)
Concerned & We Got It Is
TOTAL
22% 11% Constrained This What It Is
24%
3 Weeks TOTAL STORE 14% 33% 16% 17%
or More
Edible 22% 40% 32% 21%
Bakery 12% 2% 14% 15%
36%
Dairy 17% 23% 14% 19%
49%
41%
2 Weeks Deli 26% 46% 16% 40%
Frozen 20% 40% 17% 31%
Nonedible 14% 54% 9% 16%
23% Health & Beauty -6% 4% -11% -11%
1 Week 19% 22%
General Merch -17% -1% -18% 8%
GREEN = >10% Positive Change Total U.S. (4-Region Total) - All Outlets
Concerned & We Got This It Is What It Is RED = Any Negative Change
Constrained
Source: Total U.S. All Outlet Sales Linked to actual purchase behavior by National Consumer Panel representing Total US Primary Grocery Shoppers, April, 2020
© 2020 Information Resources Inc. (IRI). Confidential and Proprietary. 19Millennials Have a New Appreciation
Concerned & for Cooking, and Especially Baking
Constrained spending
more on the basics % Chg. Vs. YAG in Dollars/1,000 HHs
(4 Weeks ending 4/12/20 vs. 4/14/19)
We Got This spend
more on convenience Butter/Butter Blends Margarine/Spreads
and better quality items
(e.g., baking mixes, 71% 83%
28% 11% 16% 32% 6%
butter vs. margarine)
-1%
It Is What It Is show
the most limited changes Baking Mixes Baking Needs
vs. year ago 223%
152%
72%
111% 98%
32% 50% 49%
more
% Cooking 42% often
at Home
from 48% about
the same Spices/Seasonings Sugar
Scratch
6% less
often 137% 173%
vs. Before 23%
60% 30%
70% 36%
Coronavirus 4% n/a
-4%
Total Concerned & Constrained We Got This It Is What It Is
Source: Total U.S. All Outlet Sales Linked to actual purchase behavior by National Consumer Panel representing Total US Primary Grocery Shoppers, April, 2020
© 2020 Information Resources Inc. (IRI). Confidential and Proprietary. 20The Different Needs Sets for Home Cooking
“We Got This” Demonstrate the Biggest Commitment to Scratch
Cooking and “It Is What It Is” Gravitate to Prepared Options
TOP LARGEST INCREASES IN % HOUSEHOLDS BUYING FOR FOOD VS. YAG (4 WEEKS ENDING 4/12/20 VS. 4/14/19)
Concerned & Constrained We Got This It Is What It Is
Increase in $/1,000 Increase in $/1,000 Increase in $/1,000
HHs Buying HHs HHs Buying HHs HHs Buying HHs
Frankfurters 87% 46% Baking Mixes 103% 223% Baking Mixes 83% 152%
Mustard, Ketchup 90% 120%
Margarine / Spreads 64% 83% Hot Cereal 64% 141%
Jelly/Jam/ Honey 77% 123%
Refrigerated 63% 112% Tomato Products 61% 103%
Side Dishes
Baking Needs 67% 98%
Shelf Stable Meat Shelf Stable
60% 102% Sugar 62% 173% 60% 123%
and Ref. Ham Dinners
Cream Cheese / Dry Packaged
Mayonnaise 55% 124% 54% 30% 59% 53%
Spreads Dinners
Butter / Butter
Shelf Stable Seafood 55% 147% 53% 71% Vegetables 54% 76%
Blends
Cream Cheese / Nut Butter 51% 50%
53% 102% Frankfurters 49% 87%
Spreads
Processed Cheese 50% 39%
Shelf Stable Meat 49% 53%
Shelf Stable Seafood 49% 103% and Ref. Ham
Source: Total U.S. All Outlet Sales Linked to actual purchase behavior by National Consumer Panel representing Total US Primary Grocery Shoppers, April, 2020
© 2020 Information Resources Inc. (IRI). Confidential and Proprietary. 21Concerned & Constrained Have Broadened “Healthy” Product
Buying; Their Experiences Will Fuel Future Purchase Decisions
% Change vs. YAG / (4 Weeks ending 4/12/20 vs. 4/14/19)
Concerned &
Total We Got This It Is What It Is
Constrained
HHs $/1,000 HHs $/1,000 HHs $/1,000 HHs $/1,000
Buying HHs Buying HHs Buying HHs Buying HHs
FRESH PRODUCE
+13% +24% +34% +39% -4% +1% +19% +37%
VITAMINS
-2% +12% +21% +32% -16% +74% -9% +7%
INTERNAL ANALGESICS
+16% +27% +56% +175% -18% +2% -5% -13%
COLD / ALLERGY / SINUS
+15% +21% +11% +5% +2% -15% +49% +80%
Source: Total U.S. All Outlet Sales Linked to actual purchase behavior by National Consumer Panel representing Total US Primary Grocery Shoppers, April, 2020
© 2020 Information Resources Inc. (IRI). Confidential and Proprietary. 22Post-COVID-19, Millennials are Likely to Put a Much Greater
Emphasis on Enhancing and Maintaining Health and Wellness
Total consumer responses to a weekly survey report their anticipated changes in behavior based on COVID-19. Millennials
frequently over index compared to total generational responses. They are more likely to attend large events, to eat healthier
post-pandemic, limit visits to stores, focus on fitness and personal health, as well as disinfect more at home.
Lesser Shift Moderate Shift Bigger Shift
31% - focus more on my health
Gen Z or Younger Millennial (18 to 29) (117 index)
39% - use HH disinfecting products more often
22% - change my eating habits to be healthier Gen Z or Younger Millennial (131 index)
Gen Z or Younger Millennial (18 to 29) (163 index) 40% - use hand sanitizer more often
23% - limit shopping in stores 58% - wash hands more frequently / thoroughly
11% - plan fewer trips to other countries Gen Z or Younger Millennial (18 to 29) (118 index)
12% - travel less 24% - focus on fitness / working out more often
Gen Z or Younger Millennial (18 to 29) (146 index)
18% - attend large events less often
Gen Z or Younger Millennial (18 to 29) (115 index)
18% - avoid social gatherings
Source: IRI Survey fielded 5/1-5/3 among National Consumer Panel representing Total US Primary Grocery Shoppers
© 2020 Information Resources Inc. (IRI). Confidential and Proprietary. 23Millennials Won’t Rush Back to Their Old Ways of Doing
Things Once Shelter-In-Place Restrictions are Lifted
Plans to Return to Activities After Stay-at-Home is Lifted
“I’ll go back to my usual way of doing this as soon as possible after restrictions are lifted.”
Go to the Gym /
Fitness Classes Go Grocery Go to Work
Go to a Gen Z or Younger Millennial Dine Out at Shopping at Stores at a Location
Nail Salon (18 to 29) (122 index) Restaurants More Frequently Outside My Home
Later / Cautious Approach Early / Eager Approach
Go to Bars / Clubs My young child / children Go to an Go Shopping at Non- Go to a Hair Salon
Gen Z or Younger will go to daycare or I will Entertainment Venue Grocery Stores (Clothing or Barbershop
Millennial (18 to 29) have a childcare provider (Movie Theater, Stores, Furniture, etc.)
(133 index) come to my home** Bowling, etc.)
Gen X (39 to 54) Gen Z or Younger Millennial
(143 index) (18 to 29) (252 index)
Older Millennial (30 to 38)
(215 index)
Source: IRI Survey fielded 5/1-5/3 among NCP representing Total U.S. Primary Grocery Shoppers / *Base: Working Outside Home / **Base: Have Kids Under 6 / Index is Compared to Total Generational Response
© 2020 Information Resources Inc. (IRI). Confidential and Proprietary. 24Programming Content Tells a Story
About the Message That Will Resonate
The amount of time Millennials
spend on media platforms,
including cable, internet at home,
magazines, newspapers, radio
and TV, is relatively consistent,
but what they’re consuming
differs among groups.
Concerned &
We Got This It Is What It Is
Constrained
PAST 7 DAYS VIEWING
Programming Distinctions Provide Further
BBC America 130 110 119
Evidence of the COVID-19 Mindset Differences
BBC World News 128 118 103
• Broad-based news programming is disproportionately MSNBC 122 114 117
consumed by those who are most worried and
CNN 126 119 112
economically fragile due to COVID-19.
CNBC 118 109 104
• Those who are concerned but confident stand out
Fox News 108 101 121
for their viewing of HBO.
HBO 118 121 94
• Those who are largely disengaged from the crisis
stand out for their viewing of Fox News, and HGTV HGTV 108 116 120
Source: IRI ShopperSights
© 2020 Information Resources Inc. (IRI). Confidential and Proprietary. 25Moving Forward – Address the Varying
Needs of the Millennial Generation
Build Confidence
Use technology and positive reinforcement to create more personalized
connections to help Millennials through what they don’t know or what they
may want to try, be it budget stretching or meal prep.
Boost Safety and Health
Communicate commitments to safety, whether in-store or on-pack.
Showcase strategies that support wellness goals.
Support the You-Only-Live-Once Connection
Demonstrate how your products or shopping experiences move life ‘beyond the
ordinary’ and into something special. Use social media and/or contests to celebrate.
Create Value Through Ease
From intuitive online grocery shopping and apps, to quick meal
planning ideas, the Millennial value equation is more than low prices.
Reframe Price
Help these shoppers understand cost per meal, or ways to extend/expand product uses.
Bring the Out-of-Home Experience In-Home
Millennials are not in a hurry to resume out-of-home activities; help them
DIY varying aspects of their lives, including meal-, cocktail- and hair color kits.
Combat Kid Boredom
Two thirds of 30-38 year-olds have kids under 18. Become a trusted source
for fun and learning and facilitate kid involvement in meal planning and prep.
© 2020 Information Resources Inc. (IRI). Confidential and Proprietary. 26Insights and Strategic
Guidance for Better Decisions
IRI’s Online Resources Include Real-Time
Updates and Weekly Reports Which Track
the Impact of the Virus on CPG and Retail
The IRI COVID-19 lmpact
Includes COVID-19 impact analyses, dashboards
and the latest thought leadership on supply chain,
consumer behavior, channel shifts for the U.S.
AND international markets
The COVID-19 Dashboard and
The IRI CPG Demand Index™
& IRI Inflation Tracker™
Accessible through the insights portal to
track the daily impact of COVID-19.
This includes the new IRI CPG Demand
Index™, top selling and out of stock
categories across the country and
consumer sentiment on social media
© 2020 Information Resources Inc. (IRI). Confidential and Proprietary. 27IRI CPG Demand Index™
The IRI CPG Demand Index™ provides a
standard metric for tracking changes in
spending on consumer packaged goods. It
measures weekly changes in consumer
purchases, by dollar sales, against the year-
ago period across departments including fixed
and random weight products, grocery aisles
and retail formats. The IRI CPG Demand
Index™ is available for eight U.S. regions and
all U.S. states.
CLICK HERE FOR MORE!
© 2020 Information Resources Inc. (IRI). Confidential and Proprietary. 28IRI CPG Inflation Tracker™
The IRI CPG Inflation Tracker™ provides the
well-known price per unit metric for tracking
changes in pricing of consumer packaged
goods. It provides weekly changes in
consumer prices, price per unit against the
year-ago period across departments including
fixed and random weight products, grocery
aisles and retail formats. The IRI CPG
Inflation Tracker™ is available for eight U.S.
regions and all U.S. states.
CLICK HERE FOR MORE!
© 2020 Information Resources Inc. (IRI). Confidential and Proprietary. 29IRI CPG Supply Index™
The IRI CPG Supply Index™ provides a
standard metric for tracking changes in
product availability (i.e. in-stock rates) in
stores for consumer packaged goods. It
measures weekly changes in product
availability against the baseline across
departments and retail formats. The IRI
CPG Supply Index™ is available for eight
U.S. regions and all U.S. states.
CLICK HERE FOR MORE!
© 2020 Information Resources Inc. (IRI). Confidential and Proprietary. 30IRI Global Headquarters
CONTACT US 150 North Clinton Street
Chicago, IL 60661-1416
FOR MORE IRI@IRIworldwide.com
+1 312.726.1221
INFORMATION Follow IRI on Twitter: @IRIworldwide
© 2020 Information Resources Inc. (IRI).
© 2020 Information Resources Inc. (IRI). Confidential
Confidential and
and Proprietary.
Proprietary. 31 31You can also read