Pharmaceutical Needs Assessment - Consultation - Portsmouth City - Community Pharmacy ...
←
→
Page content transcription
If your browser does not render page correctly, please read the page content below
Pharmaceutical
Needs Assessment
Consultation

Portsmouth City

        Pharmaceutical Needs Assessment for Portsmouth City 2015 ·www.portsmouth.gov.uk
                                                                  1
1. Contents

1. Contents
1     Contents			                                                 3
2     Executive Summary		                                         6
      2.1     Key findings and recommendations                    6
3     Introduction			                                             7
      3.1     Definition and purpose of the PNA                   7
      3.2     Historical and Legal Background                     7
4     Process for producing the Pharmaceutical
      Needs Assessment		                                          8
5     Localities			                                              10
      5.1     North Locality Profile                             10
      5.2     Central Area Locality Profile                      14
      5.3     South Area Locality Profile                        18
6     Portsmouth city Demography and health needs                22
      6.1     Socio-economic		                                   28
      6.2     Crime and disorder		                               30
      6.3     Economy		                                          31
      6.4     Major regeneration projects                        32
      6.5     Students		                                         32
      6.6     Lifestyle and behaviour                            32
		6.6.1               Smoking		                                  32
		6.6.2               Alcohol		                                  33
		6.6.3               Excess weight and physical activity        35
		6.6.4               Substance misuse                           36
      6.7     Sexual health		                                    37
		6.7.1               Teenage conception and abortions           37
      6.8     Skin cancer		                                      39
      6.9     Screening and protection                           39
      6.10    Lesbian, gay, bisexual and transgender community   40
      6.11    Long term conditions                               40
		6.11.1              Prevalence and modelled prevalence of
			                   long term conditions                       41
			 6.11.1.1                       Hypertension                  42
			 6.11.1.2                       Diabetes                      42
			 6.11.1.3                       Coronary heart disease        42
			 6.11.1.4                       Chronic obstructive
				                               pulmonary disease             42
			 6.11.1.5                       Asthma                        42
			 6.11.1.6                       Stroke                        42

2 · Pharmaceutical Needs Assessment for Portsmouth City 2015
1. Contents

     6.12   Physical disability		                                           42
     6.13   Life expectancy		                                               43
     6.14   Mortality		                                                     43
     6.15   Mental health		                                                 44
     6.16   Armed Forces personnel and veterans                             45
     6.17   Prison health		                                                 45
     6.18   Adults with autistic spectrum conditions                        45
     6.19   Dementia		                                                      46
     6.20   Learning disabilities		                                         46
     6.21   Carers			                                                       46
     6.22   People threatened with homelessness                             47
     6.23   Gypsies and travellers                                          47
7    Current Pharmaceutical Services                                       48
     7.1    Community Pharmacy                                              48
     7.2    Distance Selling Pharmacies                                     48
     7.3    Dispensing Doctor		                                             48
     7.4    Local Pharmaceutical Services Scheme                            48
     7.5    Dispensing Appliance Contractor                                 49
     7.6    Pharmacies close to Portsmouth boundaries                       49
     7.7    Pharmaceutical Needs assessment map                             49
8    NHS Pharmaceutical Services                                           51
     8.1    Access to Pharmaceutical Services                               51
		8.1.1              Opening hours                                          51
		8.1.2              100 hour core hour of service pharmacies               51
		8.1.3              Opening hours Morning                                  52
		8.1.4              Opening Hours Lunchtime                                53
		8.1.5              Opening Hours Evening                                  54
		8.1.6              Saturday opening                                       55
		8.1.7              Sunday opening                                         56
		8.1.8              Bank Holiday                                           57
		8.1.9              Access Distance                                        57
		8.1.10             Access for residents with additional needs             62
     8.2    Essential Services		                                            62
		8.2.1              Dispensing NHS prescriptions                           63
		8.2.2 Repeat Prescribing and Electronic
			 Prescription Service                                                    63
     8.3    Advanced Services		                                             64
		8.3.1              Medicine Use Reviews                                   64
		8.3.2              New Medicine Service                                   65

                  Pharmaceutical Needs Assessment for Portsmouth City 2015 · 3
1. Contents

		8.3.3                Appliance Use Reviews                       65
		8.3.4                Stoma Customisation Services                65
       8.4     Enhanced Services		                                 65
9      Consultation			                                             68
9.1    Consultation Requirements                                   68
9.2    Publication of draft PNA		                                  68
9.3    Consultation period		                                       68
9.4    Consultation Activities		                                   68
       9.4.1   Consultation questions                              68
       9.4.2   Consultation with professional stakeholders         68
       9.4.3   Consultation with the public                        69
10     Responses from the consultation                             70
       10.1    Summary		                                           70
       10.2    Response to written comments made by stakeholders   72
		10.2.1               Comments about the production of the PNA    72
		10.2.2               Sites of Pharmacies                         73
		10.2.3               Opening hours of pharmacies                 75
		10.2.4               Quality of Service                          75
       10.3    Recommendation		                                    75
11     Conclusion			                                               76
12     Recommendations		                                           77
13     Appendix A – Terms of Reference                             78
14     Appendix B – Portsmouth Community Pharmacy.
       Pioneers of Healthy Living Pharmacy                         80
       14.1    Pharmacy Facts		                                    80
       14.2    Healthy Living Pharmacy (HLP)                       81
       14.3    Lifestyle services		                                82
		14.3.1               Stop Smoking                                82
		14.3.2               Alcohol Awareness                           82
		14.3.3               Healthy Weight                              82
		14.3.4               NHS Health Checks                           83
       14.4    Sexual Health Services                              83
		14.4.1               Emergency Hormonal Contraception            83
		14.4.2               Chlamydia Screening                         84
		14.4.3               Condom Distribution                         84
       14.5    Harm Reduction Services                             84
		14.5.1               Supervised Consumption                      85
		14.5.2               Needle Exchange                             85

 4 · Pharmaceutical Needs Assessment for Portsmouth City 2015
1. Contents

     14.6   NHS Portsmouth Clinical Commissioning Group Services            85
		14.6.1            Medicine Concordance                                    86
		14.6.2            Minor Ailments                                          86
     14.7   Other local services and activities                             87
		14.7.1            Targeted Respiratory Medicine
			                 Use Reviews (MUR)                                       87
		14.7.2            Healthy Start Vitamins                                  87
		14.7.3            Dementia and Elder Friendly Pharmacy initiatives        87
		14.7.4            Carers signposting service                              88
		14.7.5            Men’s Health Promotion                                  88
		14.7.6            Outreach work                                           88
     14.8   Development and training of the workforce                       88
     14.9   Commissioning in the future for community pharmacy              89
15   Appendix C Equality Impact Assessment                                 90

                  Pharmaceutical Needs Assessment for Portsmouth City 2015 · 5
2. Executive Summary

                                  2. Executive Summary
                                  The Health and Social Care Act, 2012 transferred responsibility for producing a
                                  Pharmaceutical Needs Assessment (PNA) from Primary Care Trusts to Health and
                                  Wellbeing Boards, within local authorities.

                                  2.1 Key findings and recommendations
                                  • In Portsmouth there are 41 community pharmacies and one dispensing appliance
                                    contractor1.
                                  • The PNA has not identified any gaps in current pharmaceutical provision.
                                  • There is good geographical distribution of pharmacies, with the majority of the
                                    resident population living within 500 metres of a community pharmacy.
                                  • The density of pharmacies located across the city gives patients a choice of local
                                    pharmacies for pharmaceutical services.
                                  • The opening hours of local pharmacies provide residents and visitors with a good
                                    level of access to services. Residents are able to use these services from early in
                                    the morning to late in the evening and on Saturday and Sundays. The additional
                                    opening hours provided by the ‘100 hour’ pharmacies have provided an extension
                                    to these hours.
                                  • All pharmacies provide the full range of Essential Pharmaceutical Services.
                                  • All pharmacies provide at least one Advanced Pharmaceutical Service and there is
                                    access to all advanced services within the city.
                                  • Local services are largely commissioned by Public Health within Portsmouth City
                                    Council and NHS Portsmouth Clinical Commissioning Group (CCG). These are
                                    available from many pharmacies spread across the city. The delivery of these
                                    services, particularly in areas of deprivation has widened access for target groups
                                    of the population. The award winning Healthy Living Pharmacy scheme, piloted
                                    in Portsmouth in 2010 continues to be the basis of commissioning of services
                                    from community pharmacies. The Healthy Living Pharmacy scheme has gained
                                    widespread support, has been rolled out across many areas of the country and has
                                    attracted interest from several other countries. The city is committed to continuing
                                    its support for this programme.
                                  • There is potential for community pharmacy to further support local and national
                                    health and wellbeing priorities and contribute to the work to reduce health
                                    inequalities.

1.   Dispensing Appliance
     contractor supplies only
     appliances such as stoma
     care and does not dispense
     medicines

                                   6 · Pharmaceutical Needs Assessment for Portsmouth City 2015
3. Introduction

3. Introduction

3.1 Definition and purpose of the PNA
The statutory Pharmaceutical Needs Assessment (PNA) is a statement of current
pharmaceutical services provided in the local area, assesses whether or not the
pharmaceutical services provision is satisfactory for the local population and identifies
any perceived gaps in the provision.
It is a key commissioning tool that will be used to inform and support the future
commissioning of pharmaceutical services in Portsmouth. If a person (a pharmacist,
a dispenser of appliances or in some circumstances and normally in rural areas, a
General Medical Practitioner (GP)) wants to provide pharmaceutical services, they
are required to apply to the NHS to be included on the pharmaceutical list. The PNA
will be used by NHS England, as a basis for making decisions, when applications are
received to enter or amend the entry on the list of pharmaceutical service providers
within the Health and Well Being Board area. This includes to:
• Determine market entry of new NHS pharmaceutical service providers.
• Determine relocation or change of business premises of existing pharmaceutical
  service providers.
• Determine changes of pharmaceutical services provided by any current individual
  pharmaceutical services provider. It may also be used by Portsmouth City Council
  and NHS Portsmouth Clinical Commissioning Group (CCG) to inform local
  commissioning decisions.

3.2 Historical and Legal Background
The Health Act 20092 sets out the minimum standards for PNAs and the use of PNAs
as the basis for determining market entry to NHS pharmaceutical services provision.
The Regulations came into force in May 2010 and required PCTs to develop and                2.   National Health Service Act
publish their first PNA under these Regulations by 1 February 2011.                              2009 available at http://
                                                                                                 www.legislation.gov.uk/
Portsmouth City Teaching PCT developed and published its first PNA3 under the new                ukpga/2009/21/contents
                                                                                            3.   Portsmouth Pharmaceutical
regulations in 2011.                                                                             Needs Assessment 2011
The Health and Social Care Act 20124 brought about major reforms to the NHS. From                available at http://www.
                                                                                                 hants.gov.uk/pccjsna/API_
April 2013, PCTs were abolished and their duties transferred to other organisations.             STR_JSNA_SERV_PHARM_
Responsibility for developing, updating and publishing a local PNA was transferred to            PharmNeedsAx2010.pdf
Health and Wellbeing Boards. In addition this Act also transferred the responsibility of    4.   Health and Social Care Act
                                                                                                 2012 available at http://
using the PNA as the basis for determining market entry to a pharmaceutical list and             www.legislation.gov.uk/
dispensing doctor list from the PCT to NHS England.                                              ukpga/2012/7/contents/
                                                                                                 enacted
The NHS (Pharmaceutical Services and Local Pharmaceutical Services) Regulations             5.   The NHS (Pharmaceutical
20135 set out the legislative basis for developing and updating PNAs. The National               Services and Local
Health Service (Pharmaceutical and Local Pharmaceutical Services (Amendment                      Pharmaceutical Regulations)
                                                                                                 2013 available at http://
and Transitional Provision) Regulations 20146 have been published to amend these                 www.legislation.gov.uk/
regulations following a report published by the Joint Committee on statutory                     uksi/2013/349/contents/
                                                                                                 made
instruments.
                                                                                            6.   The National Health Service
The first PNA to be produced by Portsmouth Health and Wellbeing Board must be                    (Pharmaceutical and Local
                                                                                                 Pharmaceutical Services)
published by 1st April 2015 to comply with these regulations. This document has                  (Amendment and Transitional
been produced to satisfy this requirement.                                                       Provision) Regulations available
                                                                                                 at http://www.legislation.
                                                                                                 gov.uk/uksi/2014/417/
                                                                                                 contents/made

                      Pharmaceutical Needs Assessment for Portsmouth City 2015 · 7
4. Process for producing the Pharmaceutical Needs Assessment

                                   4. Process for producing the
                                      Pharmaceutical Needs Assessment
                                   The PNA has been undertaken in line with the requirements of the NHS
                                   (Pharmaceutical Services and Local Pharmaceutical Services) Regulations 2013 under
                                   the guidance of the PNA advisory group.
                                   The advisory group has also followed guidance contained within Pharmaceutical Needs
                                   Assessment, Information Pack for Local Authorities Health and Wellbeing Boards7.
                                   Representatives have also attended workshops organised by NHS England and taken
                                   advice from contributors to the previous Portsmouth PNA (2011), Healthwatch
                                   Portsmouth, the Local Pharmaceutical Committee and from other city council officers.
                                   The Portsmouth PNA has been in development from April 2014 until its official
                                   publication on April 1st 2015. The process has had many steps; the key stages are
                                   outlined below.

                                   Stage 1: Formation of an advisory group
                                   The group has representation from key stakeholders and is hosted by Public Health
                                   Portsmouth, and reports to the Director of Public Health.
                                   The group oversees the development of the PNA and ensures that the PNA conforms
                                   to the relevant regulation and statutory requirements on behalf of the Health and
                                   Wellbeing Board.
                                   Key stakeholders have included representation from Public Health Portsmouth,
                                   NHS Portsmouth CCG, NHS England Wessex Area Team, and Chief Officer of the
                                   Local Pharmaceutical Committee. Expertise and advice has also been sort from
                                   Portsmouth City Council Planning, Transport and Communications departments
                                   and Healthwatch Portsmouth.

                                   Stage 2: Collation of information and data
                                   Collation and summary of current local pharmaceutical service provision:
                                   Every existing local pharmacy has completed a detailed questionnaire about their
                                   services as of July 2014. National and locally held statistics have been examined to
                                   determine levels of activity in delivering current services.
                                   Joint Strategic Needs Assessment for Portsmouth has been extensively used to give
                                   an overview of major healthcare and wellbeing needs of the local population.
                                   Local policies including NHS Portsmouth CCG and Portsmouth City Council health
                                   and wellbeing related policies, the city’s development plans, housing plans and
                                   transport network.
                                   Use of national and locally held data on prescribing and the delivery of essential and
                                   advanced services.
7.   Pharmaceutical Needs
     Assessment, Information
     Pack for Local Authorities
                                   Stage 3: Analysis
     Health and Wellbeing Boards
     available at https://www.
                                   Analysis of the information collated to identify any gaps of pharmaceutical provision
     gov.uk/government/            within the locality. Draft consultation document completed in line with national
     uploads/system/uploads/       guidance and approved by the advisory group.
     attachment_data/
     file/197634/Pharmaceutical_
     Needs_Assessment_
     Information_Pack.pdf

                                    8 · Pharmaceutical Needs Assessment for Portsmouth City 2015
4. Process for producing the Pharmaceutical Needs Assessment

Stage 4: Draft PNA
The draft PNA is shared with the Health and Wellbeing Board prior to consultation.
(October 2014.)

Stage 5: Consultation
Professional stakeholder and public consultation will be held from November 2014 to
January 2015. (A detailed consultation description will be published as an additional
section to this draft after the consultation.)

Stage 6: Review of consultation responses
Collation of responses to consultation (February 2015) Consideration of the
comments will be made by the advisory group and the PNA will be reviewed and
amended at this stage in light of this consultation exercise. (This will be published as
an additional section to this draft.)

Stage 7: Publication
The final document will be presented to the Health and Wellbeing Board for approval
before the planned publication of the PNA by 1st April 2015.

                       Pharmaceutical Needs Assessment for Portsmouth City 2015 · 9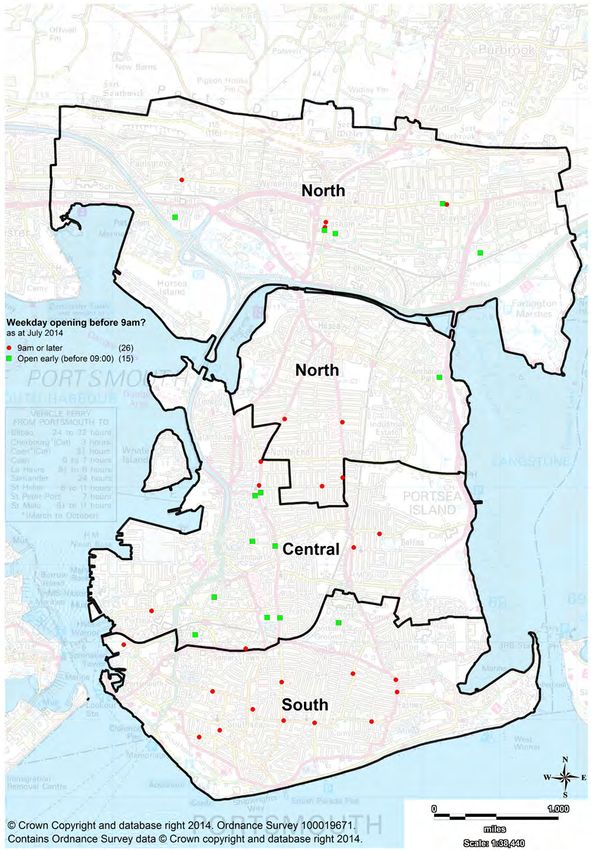
5. Localities

5. Localities
The steering group has divided Portsmouth into three localities for the purpose of
producing this Pharmaceutical Needs assessment:
North encompassing five electoral wards of Drayton and Farlington, Cosham,
Paulsgrove, Hilsea and Copnor.
Central encompassing four electoral wards of Charles Dickens, Nelson, Baffins and
Fratton wards.
South encompassing five electoral wards of St Thomas, St Jude, Central Southsea,
Milton and Eastney and Craneswater.
These localities are electoral ward based and reflect the divisions used by the local
authority in other departments such as children’s services. Similar size populations
are resident in each locality. Using an electoral ward base approach facilitates the use
of statistics and other public health information held within the local authority. This
method of division is familiar to Councillors and local authority staff. NHS Portsmouth
CCG is also looking to commission community services on a locality basis, North,
Central and South.

5.1 North Locality Profile
The North locality comprises of five wards Paulsgrove, Cosham and Drayton and
Farlington, all north of Hilsea moat, and Hilsea and Copnor, the two northern-most
wards on Portsea Island.
The M27 bisects this locality. All three road routes, which provide the on/off access to
Portsea Island, plus the railway line, are in the North.

Population
68,100 people live in the North locality (Hampshire County Council population
forecasts). The North locality has higher proportions of 45-64 year olds (32.5% of
North population) and over 65 years of age (16.8%) compared to Central and South
areas.

Employment
The large employers in this area include Portsmouth Hospitals NHS Trust (Queen
Alexandra Hospital), Highbury College, IBM, Alenia Marconi and the businesses
located at Lakeside North Harbour Business Park. There are light industrial estates
and business areas at Anchorage Park, Port Solent, and O’Jays industrial parks and in
Fitzherbert Road and Broad Oak areas.
Large retail outlets are at Port Solent, Ocean Park and Anchorage Park, with
shopping centres in Cosham and North End and smaller centres in Paulsgrove, Hilsea
and Drayton. There are two superstores in the area, Tesco and Morrison’s, both of
which have a pharmacy associated with the store.

NHS services
The CCG member practices in this locality are Wootton Street surgery, Northern Road
Surgery, Drayton Surgery, North Harbour Medical Practice and two surgeries of the
Portsdown Practice (one site in Cosham and one in Paulsgrove).

 10 · Pharmaceutical Needs Assessment for Portsmouth City 2015
5. Localities

Queen Alexandra Hospital, provided by Portsmouth Hospitals NHS Trust, is located
in the North of the city. This is the main acute hospital for the area supporting
residents in Portsmouth City and also areas of Fareham and Gosport and South East
Hampshire. This hospital hosts the local major Accident and Emergency department.
The current GP out-of-hours provider operates a primary care centre at Queen
Alexandra Hospital.
There are eight dental practices providing NHS dental services located in the Northern
locality.
The Paulsgrove and Wymering Healthy Living centre is located in Paulsgrove and
provides information about health care and local health services.
There are 14 community pharmacies in the area, including two located in major
supermarkets, four in the Cosham shopping area, one in Paulsgrove and two in
the Drayton shopping area. In the Portsea wards of Hilsea and Copnor there are
three pharmacies in the Copnor area, one at Anchorage Park located within the
supermarket, and one in the Hilsea area.
Two of these pharmacies are ‘100’ hour pharmacies providing evening and weekend
services. A further three pharmacies routinely open on Sunday.

Poverty
About 3,085 children live in poverty in North locality. Children in these families live
in families either in receipt of out-of-work benefits or in receipt of tax credits with a
reported income less than 60% of median income. At ward level this ranged from
32.2% of children in Paulsgrove to 6.2% in Drayton & Farlington.

Self-Reported quality of health
The area has a mixed profile of self-reported ‘bad’ or ‘very bad’ health. Highest
levels of self-reported ‘bad’ or ‘very bad’ health are recorded in Northarbour, Central
Paulsgrove and Cheltenham Road areas. Other areas have significantly lower levels of
self-reported ‘bad’ or ‘very bad’ health, compared to England.
See page 12 for map of the North locality of Portsmouth showing the
location of pharmacies and other key sites, as at July 2014.

                      Pharmaceutical Needs Assessment for Portsmouth City 2015 · 11
5. Localities
Figure 1. Map of the North locality of Portsmouth showing the location of
pharmacies and other key sites, as at July 2014.
Pharmacies in the North
locality (sorted by left
to right on the map)
28. Tesco Pharmacy
29. Rowlands Pharmacy
23. Rowlands Pharmacy
20. The Pharmacy
25. Everett (HJ)
Chemists Ltd
26. Lloyds Pharmacy
24. Boots the
Chemists Ltd
27. Lloyds Pharmacy
19. Copnor Pharmacy
21. Venthams Pharmacy
38. Morrison’s Pharmacy
41. Drayton Community
Pharmacy
15. Rowlands Pharmacy
16. Sainsbury’s Pharmacy
12 · Pharmaceutical Needs Assessment for Portsmouth City 20155. Localities
Legend
Standard 40 hr
pharmacy (36)
100 hr Pharmacy (5)
Dispensing Appliance
Contractor
GP surgery
Dental practice
Optician
Queen Alexandra
Hospital
St. Mary’s Hospital
and St. James’
Hospital
Minor Injuries Unit
(St Mary’s Treatment
Centre)
Health Centre
Healthy Living Centre
Walk-in centre
Children’s home
Care Home (Nursing
or Residential)
Local authority
locality boundary
Electoral ward
boundary
Allotment
Marshes / shrubs
Open Space (Public
and private land)
General area of
social housing
Naval property
Portsdown Hill
Railway station
Railway
Sea (high water
mark)
Park and Ride
Pharmaceutical Needs Assessment for Portsmouth City 2015 · 135. Localities 5.2 Central Area Locality Profile The Central locality comprises of four electoral wards crossing the centre of Portsea Island: - Nelson, Charles Dickens, Fratton and Baffins. Population 64,340 people live in the Central locality (Hampshire County Council population forecasts). Central has higher proportions of 0-4 year olds (7.9% of Central population) compared to Central and South areas. Employment The larger employers based in this area are Portsmouth City Council, University of Portsmouth, Royal Navy, the international ferry port, historic dockyards and Royal Mail, plus the major retail employers for the Commercial Road shopping area. Other shopping areas include North End, Fratton Road and the Fratton Park retail area. There are several small business and light industrial estates e.g. Warren Avenue, Pompey Centre and Victory Business Centre. NHS services The CCG member practices are Sunnyside Surgery, Lake Road Practice, Hanway Group Practice, Derby Road Practice, Baffins Surgery, Queens Road Surgery, John Pounds Surgery, Somerstown Practice, Southsea Medical Centre and Kirklands. The Guildhall Walk Healthcare and Walk in Centre is located on the south eastern boundary of this area, providing GP and minor injury services every day of the year. There are five dental practices providing NHS dental services in the Central locality. There are 14 community pharmacies in the area. Three of these pharmacies are ‘100’ hour pharmacies providing evening and weekend services. A further three pharmacies routinely open on Sunday. 14 · Pharmaceutical Needs Assessment for Portsmouth City 2015
5. Localities

Poverty
About 4,605 children live in poverty in Central locality. This is 45% of all children
living in poverty in the city. Children in these families live in families either in receipt
of out-of-work benefits or in receipt of tax credits with a reported income less than
60% of median income. At ward level this ranged from 47.5% of children in Charles
Dickens to 16.7% in Baffins.

Self-reported quality of health
Central locality has significantly higher levels of self-reported ‘bad’ or ‘very bad’
health. This includes areas such as Blackfriars, Landport, City Centre North, Bridge
Centre, Sultans Road South, Church Road, Stamshaw, Whale Island South and St
Mary’s areas.
Central locality has some of the highest city rates for people reporting a long-term
health problem or disability that limits day to day activities a lot.
Mortality rates in Central are significantly higher than England generally but
specifically for premature mortality from cancer, circulatory disease and coronary
heart disease. The lifestyle causes of many of these diseases are smoking and
drinking excess alcohol.
See page 16 for map of the Central locality of Portsmouth showing the
location of pharmacies and other key sites, as at July 2014.

                      Pharmaceutical Needs Assessment for Portsmouth City 2015 · 15
5. Localities
Figure 2. Map of the Central locality of Portsmouth showing the location of
pharmacies and other key sites, as at July 2014.
Pharmacies in the
Central locality
(sorted by left to
right on the map)
6. Merali Pharmacy
39. Lalys Pharmacy
3. Boots The Chemist Ltd
5. Lloyds Pharmacy
2. Berry (RJ) Ltd
9. Rowlands Pharmacy
7. Boots The Chemist Ltd
8. City Pharmacy
40. Lalys Pharmacy
1. Asda Pharmacy
4. Lalys Pharmacy
22. Rowlands Pharmacy
18. Lloyds Pharmacy
17. Bobat Pharmacy
16 · Pharmaceutical Needs Assessment for Portsmouth City 20155. Localities
Legend
Standard 40 hr
pharmacy (36)
100 hr Pharmacy (5)
Dispensing Appliance
Contractor
GP surgery
Dental practice
Optician
Queen Alexandra
Hospital
St. Mary’s Hospital
and St. James’
Hospital
Minor Injuries Unit
(St Mary’s Treatment
Centre)
Health Centre
Healthy Living Centre
Walk-in centre
Children’s home
Care Home (Nursing
or Residential)
Local authority
locality boundary
Electoral ward
boundary
Allotment
Marshes / shrubs
Open Space (Public
and private land)
General area of
social housing
Naval property
Portsdown Hill
Railway station
Railway
Sea (high water
mark)
Park and Ride
Pharmaceutical Needs Assessment for Portsmouth City 2015 · 175. Localities 5.3 South Area Locality Profile The South locality comprises of five electoral wards crossing the southern part of Portsea Island:St Thomas, St Jude, Central Southsea, Eastney and Craneswater and Milton. Population 73,680 people live in the South locality (Hampshire County Council population forecasts). South has higher proportions of 20-24 year olds (17.2% of South population) compared to North and Central areas. This is largely due to the city’s University and other college facilities. Employment The larger employers in this area are in retail, leisure and NHS. Retail areas include Gunwharf Quays, Palmerston Road and Albert Road/Highland Road areas. The NHS has two major sites at St Marys and St James. The South has several major hotels along the seafront as well many smaller hotels and bed and breakfast establishments. NHS services The CCG member practices are Heyward Surgery, Osborne Practice, University Surgery, Waverley Road Surgery, Eastney Practice, Ramillies Practice, Salisbury Road Surgery, Devonshire Practice , Milton Park Practice ( 2 sites). There are 12 dental practices providing NHS dental services in the Southern locality. The University of Portsmouth Dental Academy is also in the South locality and provides patient services. 18 · Pharmaceutical Needs Assessment for Portsmouth City 2015
5. Localities

The NHS St Marys Treatment Centre is located in the east of this region providing
treatment for minor illness and injuries plus a range of diagnostic services. The St
Marys hospital campus provides many community based services including integrated
sexual health service, phlebotomy services, harm reduction services, therapy services
as well as community beds.
St James hospital is also located in this area. It is home to some of the adult
mental health services provided by NHS Solent trust and the NHS Portsmouth CCG
headquarters.
There are 13 community pharmacies in the area. One pharmacy routinely opens on
Sunday. Though there are no 100 hour pharmacies in this area, there are two located
close to the southern boundary of the Central locality which are easily accessible.

Poverty
About 2,490 children live in poverty in South locality. This is 24% of the all children
living in poverty in the city. Children in these families live in families either in receipt
of out-of-work benefits or in receipt of tax credits with a reported income less than
60% of median income. At ward level this ranged from 36.2% of children in St
Thomas to 16.1% in St Jude.

Self-reported quality of Health
South has significantly lower levels of self-reported ‘bad’ or ‘very bad’ health
compared to the rest of the city, but comparatively higher rates were reported in
the area of Somerstown, which is mainly located within St Thomas ward.
See page 20 for map of the South locality of Portsmouth showing the
location of pharmacies and other key sites, as at July 2014.

                      Pharmaceutical Needs Assessment for Portsmouth City 2015 · 19
5. Localities
Figure 3. Map of the South locality of Portsmouth showing the location of
pharmacies and other key sites, as at July 2014.
Pharmacies in the
South locality
(sorted by left to
right on the map)
13. Boots The Chemist Ltd
12. Rowlands Pharmacy
14. Rowlands Pharmacy
10. Boots The Chemist Ltd
11. Rowlands Pharmacy
31. Lalys Pharmacy
30. Goldchem Pharmacy
33. Rowlands Pharmacy
35. Lloyds Pharmacy
32. Rowlands Pharmacy
34. Lloyds Pharmacy
36. Rowlands Pharmacy
37. Rowlands Pharmacy
20 · Pharmaceutical Needs Assessment for Portsmouth City 20155. Localities
Legend
Standard 40 hr
pharmacy (36)
100 hr Pharmacy (5)
Dispensing Appliance
Contractor
GP surgery
Dental practice
Optician
Queen Alexandra
Hospital
St. Mary’s Hospital
and St. James’
Hospital
Minor Injuries Unit
(St Mary’s Treatment
Centre)
Health Centre
Healthy Living Centre
Walk-in centre
Children’s home
Care Home (Nursing
or Residential)
Local authority
locality boundary
Electoral ward
boundary
Allotment
Marshes / shrubs
Open Space (Public
and private land)
General area of
social housing
Naval property
Portsdown Hill
Railway station
Railway
Sea (high water
mark)
Park and Ride
Pharmaceutical Needs Assessment for Portsmouth City 2015 · 216. Portsmouth city demography and health needs
6. Portsmouth city demography
and health needs
Portsmouth is located on the south coast of England within the county of Hampshire.
In 2015, 211,517 people are estimated to be resident in Portsmouth - an increase of
about 1,500 (0.5%) compared to 2014. As at 1st April 2014, 218,374 people were
registered with Portsmouth City GP Practices–although the vast majority are resident
to Portsmouth, not all registered patients live in Portsmouth and the Portsdown GP
practice has one of its surgeries (Crookhorn surgery) located outside of Portsmouth,
which increases the registered population. The workday population at the time of
the 2011 census was 217,960 (ie either in employment in Portsmouth, or not in
employment but living in Portsmouth). The workplace population at the time of
the 2011 census was 109,456 (residents aged 16 to 74 years in employment in
Portsmouth a week before the census).
Portsmouth is a compact city covering 15.5 square miles–80% of the population
lives on Portsea Island. The city continues to be the most densely populated local
authority area outside London (50.7 people per hectare).
Where possible this section has also has taken account of the localities North, Central
and South, when describing the health needs of the city.
Figure 4. Resident population estimates and projections by gender and 5
year age bands, Portsmouth City, 2015 estimate compared to 2018 estimate.
Male population
estimate 2015 Resident population estimates and projections by gender and 5 year age bands Portsmouth City
2015 - 2018
Male population
estimate 2018 90+
Female population 85-89
estimate 2015 80-84
75-79
Female population 70-74
estimate 2018 65-69
60-64
Source: ONS 2011 Census-based 55-59
mid-2012 subnational population 50-54
projections. 45-49
40-44
35-39
30-34
25-29
20-24
15-19
10-14
5-9
1-4
0
20000 15000 10000 5000 0 5000 10000 15000 20000
Resident population (number)
22 · Pharmaceutical Needs Assessment for Portsmouth City 20156. Portsmouth city demography and health needs
Figure 5. 2011 Census resident population by gender and 5 year age bands,
Portsmouth City compared to England
Resident population by gender and 5 year age bands from Census 2011 and Hampshire Males census 2011
County Council Small Area Population Forecasts (2001 Census based for 2011), Portsmouth
Males HCC forecast
85+ Females census 2011
80-84 Females HCC forecast
75-79
70-74
Source: ONS Census, 2011. HCC
65-69
Small Area Population Forecasts
60-64 for 2011
55-59
50-54
45-49
40-44
35-39
30-34
25-29
20-24
15-19
10-14
5-9
0-4
15000 10000 5000 0 5000 10000 15000
Resident population (number)
Portsmouth has a comparatively high proportion of young people aged 20-24 years,
compared to England, due to the city’s University and colleges (12% compared with
7% nationally). (Figure 5)
The population is predicted to increase by over 4,200 from 2015 to 2018; and
increase by nearly 21,000 between 2015 to 2030. (Table 1 and Figure 6)
Table 1. Long term population projections for Portsmouth, 2012 to 2037
Age Year
group
2012 2015 2018 2021 2024 2027 2030 2037
0-15 37913 38677 40058 41157 41553 41572 41744 42121
16-64 140443 142919 144758 145740 147068 148987 150139 152892
65+ 28480 29920 30971 32435 34667 37401 40353 45913
All ages 206836 211517 215787 219333 223288 227959 232236 240925 Source: ONS 2011 Census-based
mid-2012 subnational population
75+ only 13694 14010 14512 15670 17642 18714 19796 23822 projections.
Pharmaceutical Needs Assessment for Portsmouth City 2015 · 236. Portsmouth city demography and health needs
Figure 6. Long term population projection by age group, Portsmouth UA,
2012-2037.
Long term population projection by age group, Portsmouth UA, 2012-2037
0-15 16-64 65+
180000
160000
Population projections (numbers)
140000
120000
100000
80000
60000
40000
20000
0
2012
2013
2014
2015
2016
2017
2018
2019
2020
2021
2022
2023
2024
2025
2026
2027
2028
2029
2030
2031
2032
2033
2034
2035
2036
2037
Year
Source: ONS 2011 Census-based
mid-2012 subnational population
In 2015, the North locality of the city is estimated to have a more even spread of
projections. residents across age bands than the Portsmouth average. The North is estimated to
have a greater proportion than the Portsmouth average in residents aged 45 years
and over, but less than average in ages 15-39 years (Figure 7). However, by 2018,
the population in the North is forecast to increase the most for those aged 20-24
years, aged 55-59 years and aged 70-74 years; whilst, the population is predicted to
decrease the most in ages 40-49 years (Figure 8).
Figure 7. Resident population estimates by gender and 5 year age band,
North locality compared to all Portsmouth, 2015.
Males North Portsmouth Resident population estimates by gender and 5 year age band
HCC SAPF 2015 North locality compared to all Portsmouth, 2015
Males Portsmouth
90+
HCC SAPF 2015
85-89
Females North Portsmouth 80-84
HCC SAPF 2015 75-79
70-74
Females Portsmouth
65-69
HCC SAPF 2015
60-64
55-59
Source: Hampshire County 50-54
Environment Department’s 2011 45-49
Census, 2013-based Small Area 40-44
Population Forecasts 35-39
30-34
25-29
20-24
15-19
10-14
5-9
1-4
0
15 10 5 0 5 10 15
Resident population (%)
24 · Pharmaceutical Needs Assessment for Portsmouth City 20156. Portsmouth city demography and health needs
Figure 8. Resident population estimates and projections by gender and 5 year
age band, North locality, 2015 compared to forecasted 2018.
Resident population estimates and projections by gender and 5 year age band Males population
North locality, Portsmouth 2015 to 2018 estimate 2015
Males population
90+ estimate 2018
85-89 Females population
80-84 estimate 2015
75-79
70-74 Females population
65-69 estimate 2018
60-64
55-59
Source: Hampshire County
50-54
Environment Department’s 2011
45-49
Census, 2013-based Small Area
40-44 Population Forecasts
35-39
30-34
25-29
20-24
15-19
10-14
5-9
1-4
0
7000 5000 3000 1000 1000 3000 5000 7000
Resident population (number)
In 2015, the Central locality of the city is estimated to have a similar pattern across
all age groups compared to the Portsmouth average. However, the Central locality
is estimated to have a greater proportion than the Portsmouth average in residents
aged 0-19 years and in under 50 years in general (except the aged 20-24 years group)
(Figure 9). By 2018, the population in the Central locality is forecast to increase the
most for those aged 10-14 years, aged 50-64 years and aged 70-74 years; whilst, the
population is predicted to decrease the most in aged 30-34 years (Figure 10).
Figure 9. Resident population estimates by gender and 5 year age band,
Central locality compared to all Portsmouth, 2015.
Resident population estimates and projections by gender and 5 year age band Males Central Portsmouth
Central locality compared to all Portsmouth, 2015 HCC SAPF 2015
Males Portsmouth
90+ HCC SAPF 2015
85-89
80-84 Females Central Portsmouth
75-79 HCC SAPF 2015
70-74
Females Portsmouth
65-69
HCC SAPF 2015
60-64
55-59
50-54 Source: Hampshire County
45-49 Environment Department’s 2011
40-44 Census, 2013-based Small Area
35-39 Population Forecasts
30-34
25-29
20-24
15-19
10-14
5-9
1-4
0
15 10 5 0 5 10 15
Resident population (%)
Pharmaceutical Needs Assessment for Portsmouth City 2015 · 256. Portsmouth city demography and health needs
Figure 10. Resident population estimates and projections by gender and 5
year age band, Central locality, 2015 compared to forecasted 2018.
Males population Resident population estimates and projections by gender and 5 year age band
estimate 2015 Central locality Portsmouth, 2015 to 2018
Males population
estimate 2018 90+
85-89
Females population 80-84
estimate 2015 75-79
70-74
Females population
65-69
estimate 2018
60-64
55-59
Source: Hampshire County 50-54
Environment Department’s 2011 45-49
Census, 2013-based Small Area 40-44
Population Forecasts 35-39
30-34
25-29
20-24
15-19
10-14
5-9
1-4
0
7000 5000 3000 1000 1000 3000 5000 7000
Resident population (number)
In 2015, the South locality of the city is estimated to proportionally have a much
larger population of young persons aged 20-39 years compared to the Portsmouth
average, with the 20-24 years age group being disproportionately larger than the
Portsmouth average, primarily due to the vast majority of students being located in
the South. The South is also estimated to have a lower proportion of age 0-14 years
and 40-79 years than the Portsmouth average (Figure 11). However, by 2018, the
population in the South is forecast to increase the most for those aged 10-14 years,
aged 45-64 years and aged 70-74 years; whereas, the population is predicted to
decrease the most in aged 30-34 years and aged 65-69 years (Figure 12).
Figure 11. Resident population estimates by gender and 5 year age band,
South locality compared to all Portsmouth, 2015.
Males South Portsmouth Resident population estimates and projections by gender and 5 year age band
HCC SAPF 2015 South locality compared to all Portsmouth, 2015
Males Portsmouth 90+
HCC SAPF 2015 85-89
Females South Portsmouth 80-84
HCC SAPF 2015 75-79
70-74
Females Portsmouth 65-69
HCC SAPF 2015 60-64
55-59
Source: Hampshire County 50-54
Environment Department’s 2011 45-49
Census, 2013-based Small Area 40-44
Population Forecasts 35-39
30-34
25-29
20-24
15-19
10-14
5-9
1-4
0
20 15 10 5 0 5 10 15 20
Resident population (%)
26 · Pharmaceutical Needs Assessment for Portsmouth City 20156. Portsmouth city demography and health needs
Figure 12. Resident population estimates and projections by gender and 5
year age band, South locality, 2015 compared to forecasted 2018.
Resident population estimates and projections by gender and 5 year age band Males population
South locality, Portsmouth, 2015 to 2018 estimate 2015
Males population
90+ estimate 2018
85-89
80-84 Females population
75-79 estimate 2015
70-74
Females population
65-69
estimate 2018
60-64
55-59
50-54 Source: Hampshire County
45-49 Environment Department’s 2011
40-44 Census, 2013-based Small Area
35-39 Population Forecasts
30-34
25-29
20-24
15-19
10-14
5-9
1-4
0
7000 5000 3000 1000 1000 3000 5000 7000
Resident population (number)
Important themes are:
• An ageing society. Between 2015 and 2030 the population aged 65+ years is
estimated to increase by 35% and those aged 75+ years by 41%. The working age
population (16–64 years) is estimated to increase by 5%, and those aged less than
16 years are expected to increase by 8%.
• At the time of the 2011 Census, Portsmouth had a lower percentage of residents
from Black and minority ethnic (BME) communities (people identifying with an
ethnicity other than White English/Welsh/Scottish/Northern Irish/British) compared
to in England (16% compared to 20%). However, 32,800 residents make
Portsmouth a diverse multi-ethnic community. All BME groups (except Mixed) have
a larger proportion of their group of working age than the White British group
(Figure 13). Of the localities in Portsmouth, the South is the most ethnically diverse
with 22% of the population belonging to BME groups, compared to 16% of the
Portsmouth population (Figure 14).
Figure 13. Proportion of population by ethnic group and broad age group,
Portsmouth UA, 2011.
Resident population by ethnic group and broad age group Portsmouth City, 2011 0-15 years old
100% 119 395 61 55 16-64 years old
90% 26,782
65 years and older
80%
% of total population
2,756
70% Source: 2011 Census Table
2,784 DC2101EW
60% 1,697
9,387
50% 123,220
40%
30%
20% 2,592
10% 2,692 932 404
31,180
0%
White Mixed Asian or Black or Other
Asian British Black British ethnic group
Pharmaceutical Needs Assessment for Portsmouth City 2015 · 276. Portsmouth city demography and health needs
Figure 14. Number of people by ethnicity and locality, Portsmouth UA, 2011.
White British Ethnicity of resident population; persons ,all ages
White Other Portsmouth City localities, 2011
Mixed 80000
Asian or Asian British
Black or Black British
70000
Other ethnic group
Source: 2011 Census : QS211EW,
Office for National Statistics 60000
Number of Portsmouth Residents
50000
40000
30000
20000
10000
0
North Central South
6.1 Socio-economic
Portsmouth is ranked 84th of 324 local authorities (excluding counties; and where
one is the most deprived). Deprivation can be experienced in several forms: the index
of multiple deprivation (IMD) comprises seven domains: income; employment; health
deprivation and disability; education, skills and training; barriers to housing and
services; crime; and living environment. The IMD is assigned to Census derived small
administrative areas of about 1500 people named Lower Super Output Areas (LSOAs)
of which there are 125 LSOAs in Portsmouth as at 2011 Census. Twenty-nine of 125
LSOAs in Portsmouth are in the 20% most deprived in England. Of the 29 LSOAs (in
the most deprived 20% in England), 11 (of 44) LSOAs are in the North locality; 15
(of 39) in Central locality; and three (of 42) are in the South. (Figure 15)
28 · Pharmaceutical Needs Assessment for Portsmouth City 20156. Portsmouth city demography and health needs
Figure 15. Map of Portsmouth with the England Rank of IMD 2010 score in
deciles by 2011 Census LSOAs overlaid by localities and pharmacies.
Pharmaceutical Needs Assessment for Portsmouth City 2015 · 296. Portsmouth city demography and health needs
The most commonly used threshold for income poverty is below 60% of median
income. In 2013, the median income in Portsmouth is £24,564; therefore,
income below £14,740 can be considered income deprived8. It is estimated that
approximately 27,700 households (excluding student households) in Portsmouth have
a net annual income below 60% of the median income (35% of households)–in the
North locality of the City, it is estimated that there are about 8,400 households (30%)
below the threshold; the Central locality with roughly 10,700 households (41%)
below the threshold; and the South locality of the City about 8,600 households
(34%) below the threshold of income poverty.
Childhood poverty is a major challenge - just over a quarter of children aged
under 16 years in the city live in low-income families (25.2%, in 2011); the highest
proportion of children aged under 16 years in low-income families are in Central
locality (32.1%), followed by South (23..5%) and then North (19.3%). However,
there are wide variations of income and children in poverty in these localities–in the
North locality the LSOA with the highest proportion of children aged under 16 years
in low-income families is in the Northarbour area (56%); the LSOA in Central with
the highest proportion is Portsmouth City Centre (58.7%); and the LSOA in South
with the highest proportion is the Sackville Street area (55.7%).
Based on data from 2008, the Income Deprivation Affecting Older People Index
(IDAOPI) (a sub-domain of IMD 2010) estimated that 18% of people aged 60 years
and over in the City lived in income-deprivation (15%, 24% and 17% in the North,
Central and South localities respectively).
The most recent Annual Population Survey, for the period April 2013 to March
2014, shows that Portsmouth’s employment rate was higher than the four previous
rolling quarterly periods–71.7% compared to 71.4% the previous year (April 2012
to March 2013); however this is not statistically significantly different to any of
the previous periods. Portsmouth’s employment rate has fluctuated but in general
remains similar since April 2011 to March 2012. As at March 2014, unemployment
jobseeker allowance claimant rates were highest in three of the electoral wards in
Central locality: Charles Dickens (5.1% of working age population), Nelson (3.5%),
and Fratton (3.3%); and Paulsgrove (3.3%) in the North locality. The median duration
of unemployment increased from 13.0 weeks at March 2011 to 21.9 weeks at March
2013; and again to 22.3 weeks at March 2014.
The percentage of Portsmouth’s young people obtaining five or more GCSEs
(including English and Maths) at grades C or above was 47.6% in 2012/13. There
had been a year on year increase between 2006/07 (33.1%) and 2011/12 (52.4%),
but a decrease in 2012/13.
The percentage achieving these grades in 2012/03 was still considerably lower than
the percentages for England (60%) and the South East region (62%).
In 2012, the percentage of Portsmouth young people aged 16-18 years not in
education, employment or training (NEET) was 7.8%. This is higher than England
(5.7%), the South East region (5.4%) and four of Portsmouth’s ONS statistical
comparators. Compared to 2011, the percentage NEET decreased for England and
the South East; however, the percentage NEET increased for Portsmouth.
6.2 Crime and disorder
Overall, levels of recorded crime and anti-social behaviour fell in Portsmouth during
2013/14 (8% and 11% respectively), although there were some exceptions to this
trend. The following increased in Portsmouth in 2013/14: most serious violence
8. Annual Survey of hours by 8%, sexual offences by 25%, non-domestic burglary by 19%, theft of a motor
and earnings, Nomis, ONS. vehicle by 55%, cycle theft by 15% and business robbery by 250%.
Accessed July 2014.
30 · Pharmaceutical Needs Assessment for Portsmouth City 20156. Portsmouth city demography and health needs
Domestic abuse continues to be the largest category of violence, accounting for
over 32% of assaults (including assaults by spouse/partner not flagged as domestic).
15.4% of assaults took place in the designated night time economy areas or at
licenced premises.
In 2013/14, the Crime Survey for England and Wales (CSEW) found that 12% of
residents nationally perceived there to be a high level of anti-social behaviour in their
local area. In comparison, the 2014 Community Safety Survey found that 11% (n95)
of residents strongly agreed that anti-social behaviour is a big problem in the area
where they live. (NB There is methodological differences in these surveys and the
questions asked so this is not directly comparable.)
6.3 Economy
Portsmouth has over 6,000 businesses within its boundaries. The city has a broad
employment base with the largest sectors being engineering, manufacturing,
tourism, retail and leisure, business services and public administration.
Like many urban areas, Portsmouth has a net influx of workers (estimated at 18,000
people per working day) commuting into the city. The city a has a strong tourist
industry linked to its seaside location, international ferry port, historic dockyard
and commercial districts - notably the areas of Commercial Road, Port Solent and
Gunwharf Quays.
Portsmouth is an employment hub for the wider region, attracting more commuters
in, than sending out – particularly from Havant. However, Portsmouth residents still
contribute a significant amount to other local economies, with Portsmouth residents
holding 21% of Havant’s workplace jobs. There is a similar pattern with commuting
flows to Gosport. Collectively, residents from the neighbouring authorities of Havant,
Fareham and Gosport constitute 24% of Portsmouth’s workforce. Portsmouth is the
second largest employment area for Havant, Fareham and Chichester residents, with
a quarter of Havant’s employed residents working in Portsmouth. In-commuters are
over represented in the workplace in the mainland wards.
Portsmouth is home to just over 40% of the working age population of the South
East Hampshire area but provides nearly 50% of its jobs. Portsmouth has a strong
influence and inter-dependence with the surrounding area, most notably on the
economies of Havant and Gosport.
Further analysis indicates that Portsmouth is importing a large proportion of its
workforce for more senior occupations from outside of Portsmouth. This goes some
way to explain the disparity between higher workplace wages to lower resident wages.
The sectors representing the largest proportion of employment in Portsmouth are:
‘Health’ (15.1%, 15,000 employees) and ‘Public administration’ (14.4%, 14,400
employees). Portsmouth has a specialisation in ‘information and communication’,
although this is in line with the South East generally. Portsmouth also has a
disproportionately large ‘manufacturing’ sector compared to comparator cities,
although it is in line with the national average. Portsmouth has a small but massively
over represented ‘aerospace and defence’ industry. The same is also true to a certain
extent for the ‘advanced engineering’ and ‘marine’ sector, which are responsible for 9. Executive summary -
a disproportionately large amount of employment in Portsmouth compared to the Portsmouth Local Economic
national average. The voluntary and community sector is vital to the prosperity and Assessment (produced for
Portsmouth City Council by
well-being of Portsmouth, making a valuable contribution to the economic and social the University of Portsmouth’s
regeneration of the city. The creative, cultural and leisure sector provides significant CEAP), Portsmouth JSNA:
http://www.hants.gov.uk/
direct and indirect employment and acts as a catalyst for enhancing employment
pccjsna/API_STR_JSNA_SEC_
prospects, urban regeneration and investment in the city. Portsmouth’s cultural life is EMP_ECON_AREA_AX2012_
one of the key factors in drawing people to live in and visit the city.9 SUMMARY.pdf Accessed 18
July 2014
Pharmaceutical Needs Assessment for Portsmouth City 2015 · 316. Portsmouth city demography and health needs
6.4 Major regeneration projects
Major regeneration projects have been identified in several areas of Portsmouth,
including The Hard, Somerstown, and City Centre North, Commercial Road and
Edinburgh Road and the regeneration of Tipner (an area in the Central locality).
However, it is not anticipated that there will be any significant housing changes
before 2018 and their impact will be considered in a later PNA. Further details on
regeneration can be found on the Portsmouth City Council website:
https://www.portsmouth.gov.uk/ext/the-council/policies-and-strategies/
regeneration-strategy.aspx
6.5 Students
In the last academic year (2013/14), the University of Portsmouth had almost 21,000
registered students (89% of which were full-time) – 72% came from the UK, 6% from
China and 2% from Nigeria. There are registered students from 140 other nationalities
(these separately accounted for 1% or less of the total student population). However,
of the 21,000 registered students (and this number excludes distance learners and
franchise institutions) approximately one third live in Portsmouth.
6.6 Lifestyle and behaviour
6.6.1 Smoking
Estimated prevalence for 2012 indicates that 22.5% (+/-2.2% 95% confidence
intervals) of Portsmouth adults (aged 18+ years) smoke–significantly higher than the
estimated prevalence for the South East region and for England. The most recent
local Health and Lifestyle survey, 2005 found that at electoral ward geography, the
percentage of people aged 18 years and above who reported they smoke regularly
ranged from 43% in Charles Dickens ward (or some 6,500 people in 2015) to 13%
in Drayton and Farlington (some 1,400 people). (Figure 16) However, each of the
localities have high and low areas of smoking–in the North it ranges from 30% in
Cosham to 13% in Drayton and Farlington; in the Central locality, 43% in Charles
Dickens to 29% in Baffins; and in the South, 30% in Milton and St. Thomas wards to
26% in St. Jude. Another health and lifestyle survey is planned for 2015.
There is a strong association between deprivation, socio-economic classification
and smoking. In 2012, smoking prevalence amongst adults (aged 18+ years) in the
‘routine and manual group’ (a national statistics socio-economic classification) in
Portsmouth is higher (33.8%), but not significantly, than the prevalence in this group
in England (29.7%), the South East region (29.5%).
In 2013/14, 15.4% of women, registered with a Portsmouth City GP smoked at
the time of delivery of their babies. This figure is lower than previous years (since
2004/05) and continues the downwards trend from 20.1% in 2009/10. However,
Portsmouth still remains higher than England (12%), and the Wessex Area (regional
CCGs combined).
High smoking attributable admission rates are indicative of poor population health
and high smoking prevalence. In 2010/11, the rate of smoking attributable hospital
admissions for Portsmouth residents (aged 35+ years) was lower than England but
higher than the South East region.
In 2010/12, Portsmouth had a significantly higher rate of smoking-attributable
deaths in persons aged 35+ years compared to England. Also, compared to England,
Portsmouth had significantly higher rates of deaths from lung cancer (2010-12), deaths
10. Tobacco Control Profiles, Public from chronic pulmonary disease (2010-12) and lung cancer registrations (2009-11).10
Health England.
32 · Pharmaceutical Needs Assessment for Portsmouth City 20156. Portsmouth city demography and health needs
Figure 16. Projected number of smokers forecast for 2015, Portsmouth City
residents aged 18+ years, by electoral ward and locality.
Projected number of smokers forecast for 2015 North locality
Portsmouth City residents aged 18 years and over, by electoral ward Central locality
(ranked by descending order of self-reported % smokers)
South locality
7,000
Source: Health and Lifestyle Survey
2005 & Hampshire County Council
6,000 2011 Census, 2013-based small
area population forecasts
5,000
Number aged 18 and over
4,000
3,000
2,000
1,000
0
Charles Dickens
Cosham
Nelson
Paulsgrove
Copnor
Fratton
Milton
St Thomas
Baffins
Eastney and Craneswater
Central Southsea
Hilsea
St Jude
Drayton and Farlington
6.6.2 Alcohol
The local Health and Lifestyle Survey (2005) found that 11% of adults aged 18+
years in Portsmouth drink every day (15% of men and 6% of women). The highest
percentages of people drinking every day are St Thomas (20%), Cosham (18%) and
Eastney and Craneswater (17%).
In 2008-09, Portsmouth had a higher level of modelled prevalence of adults aged
16+ years who are increasing and higher risk drinkers (24%) compared with the SE
Region (23%) or England (22%).11 However, this there is no statistical significance
between areas and the confidence intervals around the survey data are wide.
The Health and Lifestyle Survey (2005) also found that 25% of people aged 18+
years reported that they binge-drank. The highest proportion of residents binge
drinking were in the South of the city– with the highest proportion being Eastney
and Craneswater (45%); Fratton and Hilsea wards had the highest proportion of
binge drinkers in the Central and North localities, respectively. (Figure 17)
11. Health Profile for Portsmouth,
2013. Public Health England.
Pharmaceutical Needs Assessment for Portsmouth City 2015 · 33You can also read