POLAND VOCATIONAL EDUCATION AND TRAINING IN EUROPE - VET IN EUROPE REPORTS I 2018 - Refernet
←
→
Page content transcription
If your browser does not render page correctly, please read the page content below
VOCATIONAL EDUCATION
AND TRAINING IN EUROPE

POLAND

           VET IN EUROPE REPORTS I 2018
Please cite this publication as:
 Chłoń-Domińczak, A. et al. (2019). Vocational education and training in Europe – Poland. Cedefop
 ReferNet VET in Europe reports 2018.
 http://libserver.cedefop.europa.eu/vetelib/2019/Vocational_Education_Training_Europe_Poland_2
 018_Cedefop_ReferNet.pdf

Authors: Agnieszka Chłoń-Domińczak (Chapter 3 & 4), Dorota Holzer-Żelażewska (Chapter 1) and
Anna Maliszewska (Chapter 2)
Barbara Przybylska (English proofreading), Olga Wasilewska (report editor)
Validated by: Jerzy Bielecki, Centre for Education Development (ORE)

Reviewed by Iraklis Pliakis, Cedefop
© Instytut Badań Edukacyjnych (Cedefop ReferNet Poland), 2018
Reproduction is authorised, provided the source is acknowledged.

This VET in Europe report is part of a series prepared by Cedefop’s ReferNet network.
VET in Europe reports provide an overview of national vocational education and training (VET)
systems of the EU Member States, Iceland and Norway. The reports help to understand VET’s main
features and role within countries’ overall education and training systems from a lifelong learning
perspective, and VET’s relevance to and interaction with the labour market.
VET in Europe reports follow a common Cedefop format. They are available at
http://www.cedefop.europa.eu/EN/Information-services/vet-in-europe-country-reports.aspx.

The opinions expressed here do not necessarily reflect those of Cedefop.

VET in Europe reports are cofinanced by the European Union and ReferNet national partners.

ReferNet is a network of institutions across Europe representing the 28 Member States, plus Iceland
and Norway. The network provides Cedefop with information and analysis on national vocational
education and training. ReferNet also disseminates information on European VET and Cedefop’s work
to stakeholders in the EU Member States, Iceland and Norway.
http://www.cedefop.europa.eu/en/events-and-projects/networks/refernet

         /cedefop                              @cedefop                                 refernet
Table of contents
LIST OF TABLES AND FIGURES ........................................................................................ 3
TABLES ............................................................................................................................... 3
FIGURES ............................................................................................................................. 3
CHAPTER 1. EXTERNAL FACTORS INFLUENCING VET ................................................... 5
1.1. POPULATION AND DEMOGRAPHICS ............................................................................. 5
1.2. ECONOMY AND LABOUR MARKET INDICATORS ............................................................. 7
1.3. EDUCATIONAL ATTAINMENT ......................................................................................12
CHAPTER 2. PROVISION OF VET ......................................................................................15
2.1. INTRODUCTION ........................................................................................................15
2.2. GOVERNMENT-REGULATED VET PROVISION ..............................................................16
2.3. VET GOVERNANCE ..................................................................................................26
2.4. OTHER FORMS OF TRAINING .....................................................................................31
CHAPTER 3. SHAPING VET QUALIFICATIONS .................................................................34
3.1. DESIGNING QUALIFICATIONS .....................................................................................34
3.2. ANTICIPATING SKILLS NEEDS .....................................................................................39
3.3. RECOGNITION OF PRIOR LEARNING............................................................................44
3.4. QUALITY ASSURANCE IN VET ....................................................................................44
CHAPTER 4. PROMOTING PARTICIPATION IN VET .........................................................47
4.1. INCENTIVES FOR LEARNERS, EDUCATION PROVIDERS AND ENTERPRISES .....................47
4.2. GUIDANCE AND COUNSELLING...................................................................................52
ACRONYMS AND ABBREVIATIONS .................................................................................57
REFERENCES .....................................................................................................................59
LEGISLATION ......................................................................................................................61
2List of tables and figures
Tables
1. Activity rates by educational attainment level, population aged 15-64 (%) ......................... 9
2. Employment rates by gender, age group and highest level of education attained (%) ......10
3. Employment share by economic sector in Poland (%) ......................................................11
4. Unemployment rates by gender, age group and highest level of education attained (%) ..11
5. Population (15-64) by educational attainment level and gender (%) .................................12
6. The share of higher vocational schools and students in the total number of higher
education institutions and students................................................................................19
7. Main types of vocational examinations and vocational certificates ....................................22
8. The most popular qualifications for which State vocational examinations were taken
in the 2016/2017 school year ........................................................................................24
9. Employment and unemployment rates of recent graduates (up to one year after leaving
education) in the age group of 15-30 .............................................................................25
10. The share of young people aged 20-24 not in education, employment or training (NEET)
in 2017 ..........................................................................................................................26
11. Adult participation in lifelong learning, age group: 25-64 (%) ..........................................31
12. Minimum salaries for juvenile workers (2018) .................................................................48
13. Participants in various forms of training support offered by UPs (Number of persons
who applied for some type of training) ...........................................................................50
Figures
1. Population age structure in 2015 and 2050 ....................................................................... 5
2. Population aged 16-21 and number of vocational education students ............................... 6
3. Enrolment shares by type of education in upper secondary and post-secondary levels ..... 7
4. Real GDP growth rate, percentage change from previous year ......................................... 8
5. Economic activity rates by gender, population aged 15-64 ................................................ 8
6. Early leavers from education and training (%) ..................................................................14
7. VET in Poland’s education and training system in 2018 ...................................................16
8. The distribution of youth in general upper secondary programmes and VET programmes
......................................................................................................................................20
9. The structure of students in all age groups in general upper secondary programmes and
VET programmes in 2017..............................................................................................21
10. PIAAC mean cognitive skills level of students aged 16-19 by programme type in 2011-
2012 ..............................................................................................................................25
11. The structure of the educational expenditures of counties in 2017 by school type ..........27
12. The structure of VET schools by type and managing institution in 2016 .........................27
313. The ratio between educational expenditures and the State general subsidy for education
by type of local government in the period of 2006-2017 ................................................30
14. The share of 20 to 65 year-olds participating in training in 2014 by level of education ....32
15. The share of 25 to 64 years old participating in non-formal training in 2016 by age ........32
16. Distinguishing qualifications in the occupations listed in the KZSZ .................................35
17. Qualifications in the Polish Integrated Qualifications System (IQS) ................................39
18. System of Sector Skills Councils ....................................................................................40
19. Vocational counsellors and unemployed persons per counsellor at county UPs .............55
20. Number of unemployed persons who received various forms of vocational counselling
and guidance in 2015 and 2017 ....................................................................................56
4CHAPTER 1.
External factors influencing VET
1.1. Population and demographics
Poland has the sixth largest population in the EU with 38 433 558 inhabitants as of 1 January
2018 (Statistics Poland, 2018a). By 2050, it is forecasted to decrease by almost 12% (-4.5
million) (Statistics Poland, 2014). With an area of 312 695 km², the country is tenth in the EU
in population density (United Nations, 2017). Poland, as other countries in Europe, is
characterised by low birth rates and a growing life expectancy, which impacts the age
pyramid and results in an older population structure. The share of young people (aged 0-24)
was 26% in 2015. However, as population projections show, it will decrease to 24% by 2025
and to 20% by 2050, which means a decrease by over one million and three million persons
respectively.
Figure 1. Population age structure in 2015 and 2050
Poland 2015 Poland 2050
95 95
90 90
85 85
80 80
75 75
70 70
65 65
60 60
55 55
50 50
45 45
40 40
35 35
30 30
25 25
20 20
15 15
10 10
5 5
400,000 200,000 0 200,000 400,000 400,000 200,000 0 200,000 400,000
Males Females Males Females
Source: own calculations based on data from the Statistics Poland, Population projection 2014-2050 (Statistics Poland, 2014).
The forecasted changes in the age structure indicate a growing dependency ratio of the
non-working to working age population, mainly due to the growing numbers of the pension
age population. The non-working population in 2017 was equal to 63% of the working age
population. In line with current pension-age regulations, it is forecasted to grow to 72% and
105% by 2025 and 2050 respectively (Statistics Poland, 2014).
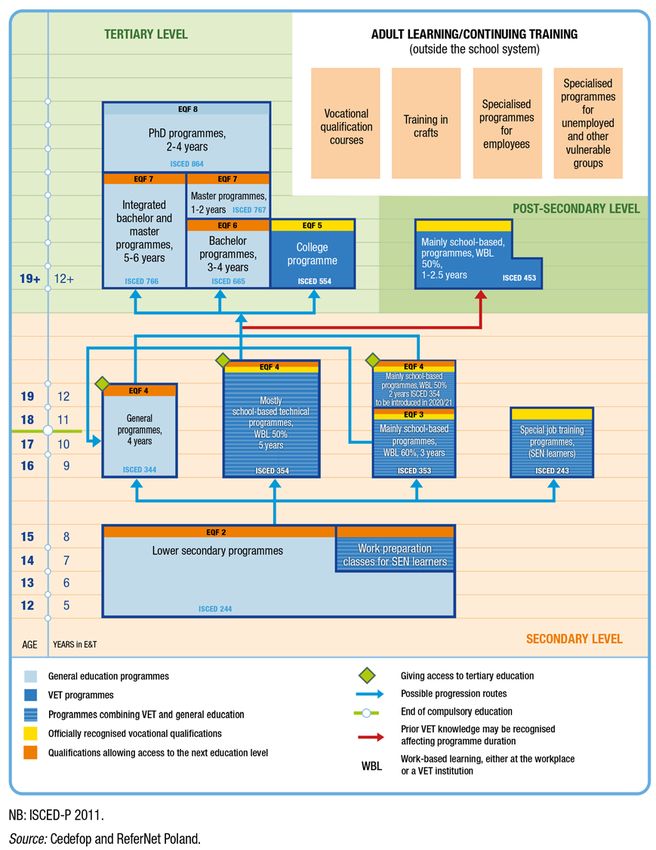
While the population above the pensionable age is forecasted to grow significantly, the
lower part of the population pyramid indicates a decreasing young population, as indicated in
Figure 2. This declining trend will continue until 2020 and in the first half of 2020s, the
5projected number of young people is likely to increase slightly. This demographic trend has a
direct impact on educational enrolment. Since 2005, the overall number of enrolments in
upper secondary and post-secondary education (both general and vocational) decreased by
34%, which represents around 800 000 students. The decrease was highest (40% or more
than 350 000) in vocational upper secondary programmes.
Figure 2. Population aged 16-21 and number of vocational education students
Number of students in vocational education*
in '000 Population aged 16-21 years
4000 Projected population aged 16-21 years
3000
2000
1000
0
2005 2006 2007 2008 2009 2010 2011 2012 2013 2014 2015 2016 2017 2018 2019 2020 2021 2022 2023 2024 2025
Years
* includes all types of vocational programmes on upper secondary and post-secondary levels
Source: own calculations based on data from the Local Data Bank, Statistics Poland, https://bdl.stat.gov.pl/BDL/start and
(Statistics Poland, 2018b). Accessed on September 20, 2018.
This phenomenon is related to the reduced interest in vocational education and training
(VET) among young people. Over the last three decades, the share of students in
vocational education has decreased from 78% to almost 60%. During the last several years
the share of learners in general upper secondary vs. vocational upper secondary and
vocational post-secondary education has remained at approximately 40% to 60%. Since
the mid-2010s, a small increase in in the share of students in vocational education is
observed (see Figure 3).
6Figure 3. Enrolment shares by type of education in upper secondary and post-secondary levels
0.7%
2017 10.1% 33.6% 15.3% 40.2%
0.7%
2015 11.0% 31.8% 15.6% 41.0%
0.5%
2010 11.3% 32.1% 14.4% 42.7%
0.2%
2005 10.3% 37.1% 13.4% 39.2%
2000 18.6% 39.5% 6.7% 35.3%
1995 27.4% 38.3% 6.0% 28.3%
1990 36.9% 35.9% 4.9% 22.3%
special job-training basic vocational* vocational upper secondary** post-secondary general upper secondary
* in 2017 includes the 1st stage sectoral ** includes art schools leading to vocational qualifications
Source: own calculations based on data from the Local Data Bank, Central Statistical Office of Poland,
https://bdl.stat.gov.pl/BDL/start. and (Statistics Poland, 2018b). Accessed on September 20, 2018.
Taking into account vocational education only, in the 2017/2018 school year, there were
almost 670 000 ( 1) young students participating in VET programmes, of which 75% were
enrolled in vocational upper secondary programmes, 15% in basic vocational programmes,
8% in the 1st stage sectoral programmes and 2% in special job-training programmes. The
adult student population of nearly 236 000 was enrolled in post-secondary programmes that
are dedicated to adults in the education system.
Additionally, in September 2017, almost 60 000 learners participated in over 2 500
vocational qualification courses ( 2). In the 2016/2017 school year, 413 548 learners took both
parts of the State vocational examination, of whom 76% obtained a qualification certificate
i.e. they passed the theoretical and practical part of the exam (CKE, 2017).
1.2. Economy and labour market indicators
1.2.1. Economy
Over the last five years, the Polish economy has experienced relatively positive GDP growth.
As Eurostat data show, real GDP growth rate was higher than the EU average and among
the highest in Europe.
1
( ) Additionally around 13 000 students were in art schools leading to vocational qualifications. Art
schools are not included in the data in the following parts of the Report. Art education constitutes a
separate system, supervised by the minister responsible for culture and national heritage.
2
( ) Own calculations based on data from the School Information System (SIO) as of September 2017.
7Figure 4. Real GDP growth rate, percentage change from previous year
6%
5% 5.0% 4.8%
4% 3.8%
3.6%
3% 3.3% 3.1%
2.1% 2.3% 2.4%
2% 1.6%
1.7% 2.0%
1.4% 1.8%
1%
0.3%
0%
2010 2011 2012 2013 2014 2015 2016 2017
-1% -0.4%
EU (28) Poland
Source: Eurostat http://ec.europa.eu/eurostat/data/database. [tec00115] Accessed on October 30, 2018.
1.2.2. Economic activity rate
The economic activity rates in Poland have been increasing over the last several years. Still,
in 2017, the average economic activity rate for the population aged 15-64 in Poland was
69.6%, almost four percentage points lower than the EU average. Almost 77% of men in this
age group and 63% of women were active economically; yet again, both rates were
significantly lower than the EU average. However, data show that the activity rates in Poland
are increasing slightly faster than in the EU.
Figure 5. Economic activity rates by gender, population aged 15-64
80%
75% 72.9% 73.3%
72.0% 72.3% 72.5%
71.0% 71.1% 71.6%
69.6%
70% 68.1% 68.8%
67.9%
66.5% 67.0%
65.3% 65.7%
65%
60%
55%
2010* 2011 2012 2013 2014 2015 2016* 2017
EU (28) PL EU males EU females PL males PL females
* Break in time series for 2010 and 2016 data for Poland
Source: Eurostat http://ec.europa.eu/eurostat/data/database. [lfst_r_lfp2actrt] Accessed on September 20, 2018.
The activity rates differ substantially by educational attainment level. Higher educational
attainment levels are linked with higher activity in the labour market, therefore, tertiary
education graduates have the highest activity rates. Since 2014, Poland is characterised by a
8slightly higher activity rate of this group than the EU average. The activity rates for the lower
levels of educational attainment in Poland are far below the EU average.
Table 1. Activity rates by educational attainment level, population aged 15-64 (%)
2010 2011 2012 2013 2014 2015 2016 2017
Less than primary,
EU (28) 53.7 54.3 54.6 54.4 53.4 53.1 53.3 53.6
primary and lower
secondary education
Poland 28.9 28.9 29.3 28.5 28.2 28.2 27.0 26.6
(levels 0-2)
Upper secondary and
EU (28) 75.1 75.0 75.3 75.3 75.6 75.7 76.0 76.2
post-secondary non-
tertiary education
Poland 69.1 69.3 69.4 69.6 70.1 69.9 70.6 71.0
(levels 3 and 4)
EU (28) 87.0 86.9 87.1 87.4 87.4 87.7 87.9 88.0
Tertiary education
(levels 5-8)
Poland 86.8 86.8 87.0 87.3 88.1 88.6 88.8 89.0
NB: level of education – ISCED 2011
Source: Eurostat http://ec.europa.eu/eurostat/data/database. [lfsa_argaed] Accessed on September 20, 2018.
The least economically active group has the lowest educational attainment, i.e. less than
primary, primary or lower secondary education. This group’s activity rate in Poland is only
26.6%, while the EU average is 53.6%. Over the past several years, Poland has introduced
different means of attempting to increase activity rates, such as offering vocational
qualification courses (see Section 2.2.3), which enable the attainment of vocational
qualifications in a short period of time. Furthermore, the public employment service offers a
variety of vocational training programmes for unemployed people with low qualifications (see
Section 4.1.).
1.2.3. Employment
In 2017, almost 15.7 million people were employed, which represents almost 65% of the total
population aged 15-64. Age and education attainment level impact employment rates. In
2017, the employment rate for the prime age population (aged 25-49 years) was slightly
higher than the EU average for that group, which is a constant trend since 2009. Young (15-
24) and older (50-64) groups are characterised by a much lower employment rate than the
EU average. In 2017, the employment rate of tertiary education graduates was almost 87%,
which is higher than the EU average (2.8 percentage points). In contrast, the share of
employed people with primary or lower secondary education is relatively low (23.3%), and
much lower than the EU average of 45.5%. In 2017, the share of employed people with post-
secondary and vocational upper secondary education was 67%, four percentage points lower
than the EU average. However, it has increased during the last 5 years (a change of over 5
percentage points) slightly faster than in the EU on average. As data show, the higher the
attained education level, the better the chances for employment.
93
Table 2. Employment rates ( ) by gender, age group and highest level of education attained (%)
2010 2011 2012 2013 2014 2015 2016 2017
EU (28) 64.1 64.2 64.1 64.1 64.8 65.6 66.6 67.6
Males 70.1 70.0 69.6 69.4 70.1 70.8 71.8 72.9
Females 58.2 58.4 58.6 58.8 59.5 60.4 61.4 62.4
15 - 24 33.9 33.3 32.6 32.2 32.4 33.1 33.8 34.7
25 - 49 78.2 78.1 77.6 77.1 77.6 78.2 78.9 79.8
50 - 64 56.6 57.3 58.4 59.2 60.6 61.8 63.4 64.9
Less than primary, primary
and lower secondary 45.1 45.2 44.4 43.7 43.3 43.7 44.5 45.5
education (levels 0-2)
Upper secondary and post-
secondary non-tertiary 68.3 68.3 68.0 67.7 68.4 69.0 69.9 70.9
education (levels 3 and 4)
Tertiary education (levels 5-8) 82.3 82.0 81.8 81.7 82.0 82.7 83.4 84.0
Poland 58.9 59.3 59.7 60.0 61.7 62.9 64.5 66.1
Males 65.3 66.0 66.3 66.6 68.2 69.2 71.0 72.8
Females 52.6 52.7 53.1 53.4 55.2 56.6 58.1 59.5
15 - 24 26.4 24.9 24.7 24.2 25.8 26.0 28.4 29.6
25 - 49 78.9 78.9 78.5 78.2 79.4 80.6 81.3 82.2
50 - 64 47.0 48.4 49.4 50.3 51.8 53.2 54.7 56.6
Less than primary, primary
and lower secondary 23.6 23.4 23.4 22.4 22.7 23.3 23.0 23.3
education (levels 0-2)
Upper secondary and post-
secondary non-tertiary 61.8 62.0 61.7 61.6 62.9 64.0 65.6 67.0
education (levels 3 and 4)
Tertiary education (levels 5-8) 82.5 82.2 82.1 82.3 83.9 85.0 85.8 86.8
NB: level of education – ISCED 2011
Source: Eurostat http://ec.europa.eu/eurostat/data/database. [lfsa_ergaed] Accessed on September 20, 2018.
1.2.4. Employment structure
The employment structure in Poland has not undergone any significant changes over the last
few years. The share of services in total employment increased slightly and in 2017 was
around 58%, which is still far below the EU28 average of around 74%. The employment
share in industry is rather stable in Poland at around 30-32% and the share in agriculture
decreased from 13.1% in 2010 to 10.2% in 2017.
3
( ) Labour Force Survey (LFS) data. Employed as per cent of total population aged 15-64 years.
10Table 3. Employment share by economic sector in Poland (%)
2010 2011 2012 2013 2014 2015 2016 2017
Industry 30.3 30.7 30.4 30.5 30.5 30.5 31.4 31.7
Females 16.1 16.5 16.1 16.1 16.5 16.5 16.9 17.2
Males 41.7 42.0 41.9 42.1 41.9 42.0 43.3 43.4
Agriculture 13.1 12.9 12.6 12.0 11.5 11.5 10.6 10.2
Females 12.7 12.2 11.7 10.9 10.3 10.4 9.4 8.9
Males 13.4 13.5 13.3 12.9 12.5 12.5 11.5 11.3
Services 56.6 56.4 57.0 57.5 58.0 57.9 58.0 58.1
Females 71.2 71.3 72.2 73.0 73.3 73.2 73.7 73.9
Males 44.9 44.5 44.8 45.0 45.6 45.5 45.1 45.3
Source: The Local Data Bank, Statistics Poland, https://bdl.stat.gov.pl/BDL/start. Accessed on December 23, 2018.
Most employed women are in services (73.9%), while the share of employment in
services and industry of men is very similar, 45.3% and 43.4% respectively.
1.2.5. Unemployment
In 2017, unemployment in Poland was lower than the EU average, which was also observed
in previous years. In the past five years, there was an overall decrease of unemployment in
all age groups and by all types of education levels. As with employment, the unemployment
rates vary by age and level of educational attainment. The unemployment rates are highest
for young people and those with the lowest educational level. The higher the attained
educational level, the lower is the chance of being unemployed.
4
Table 4. Unemployment rates ( ) by gender, age group and highest level of education attained
(%)
2010 2011 2012 2013 2014 2015 2016 2017
EU (28) 9.7 9.8 10.6 11.0 10.4 9.6 8.7 7.8
Males 9.7 9.7 10.6 11.0 10.3 9.5 8.5 7.6
Females 9.6 9.8 10.6 11.0 10.5 9.6 8.9 8.0
Age group of 15 - 24 21.1 21.7 23.2 23.7 22.2 20.3 18.7 16.8
Age group of 25 - 49 8.9 9.0 9.9 10.4 9.8 9.0 8.2 7.3
Age group of 50 - 64 6.8 6.8 7.4 7.8 7.5 7.0 6.5 5.8
Less than primary, primary
and lower secondary 16.1 16.7 18.6 19.7 19.0* 17.9 16.6 15.2
education (levels 0-2)
Upper secondary and post-
secondary non-tertiary 9.1 9.0 9.7 10.1 9.5* 8.8 7.9 7.0
education (levels 3 and 4)
Tertiary education (levels
5.4 5.6 6.2 6.5 6.2* 5.7 5.2 4.6
5-8)
4
( ) Labour Force Survey (LFS) data. Employed as per cent of total population aged 15-64 years.
11Poland 9.7* 9.8 10.2 10.5 9.1 7.6 6.2 5.0
Males 9.5* 9.1 9.5 9.8 8.6 7.4 6.2 5.0
Females 10.1* 10.5 11.0 11.2 9.7 7.8 6.3 5.0
Age group of 15 - 24 23.7* 25.8 26.5 27.3 23.9 20.8 17.7 14.8
Age group of 25 - 49 8.3* 8.3 8.9 9.2 8.1 6.7 5.5 4.3
Age group of 50 - 64 7.6* 7.4 7.7 7.8 6.9 5.8 4.5 3.8
Less than primary, primary
and lower secondary 18.3* 19.1 20.3 21.3 19.7* 17.3 14.9 12.6
education (levels 0-2)
Upper secondary and post-
secondary non-tertiary 10.6* 10.5 11.0 11.5 10.2* 8.4 7.0 5.7
education (levels 3 and 4)
Tertiary education (levels
5.0* 5.3 5.7 5.7 4.7* 4.0 3.3 2.5
5-8)
NB: level of education – ISCED 2011 * break in time series
Source: Eurostat http://ec.europa.eu/eurostat/data/database. [lfsa_urgaed] Accessed on September 20, 2018.
1.3. Educational attainment
In Poland, almost 60% of the population aged 15-64 has an upper secondary and post-
secondary non-tertiary education. However, the share of the population with this level of
education, as well as the share of the population with less than primary and lower secondary
education (levels 3-4 and 0-2) has been decreasing in favour of the share of the population
with tertiary education (levels 5-8). The share of the population with an upper secondary and
post-secondary non-tertiary level of education, for both men and women, is much higher than
the EU average, and in 2017, amounted to 64.3% and 55.3% respectively.
When compared to the EU average, Poland has a more pronounced difference in
educational attainment level by gender. In 2017, the share of men with upper secondary and
post-secondary non-tertiary education was higher by 9 percentage points than the share of
women. At the same time, 3 out of 10 women had tertiary education while only 2 out of 10
men had attained this level of education.
Table 5. Population (15-64) by educational attainment level and gender (%)
2010 2011 2012 2013 2014 2015 2016 2017
EU (28)
Less than primary, Total 30.6 29.4 28.5 27.6 27.3 26.7 26.4 25.8
primary and lower
Males 30.2 29.2 28.5 27.7 25.7 27.1 26.8 26.4
secondary education
(levels 0-2) Females 30.9 29.6 28.5 27.5 27.1 26.4 25.9 25.3
Upper secondary and Total 46.2 46.1 46.1 46.1 46.2 46.1 45,9 45.8
post-secondary non-
Males 47.5 47.4 47.4 47.6 47.6 47.4 47.3 47.2
tertiary education
(levels 3 and 4) Females 44.8 44.8 44.8 44.7 44.9 44.7 44.6 44.4
12Total 22.6 23.4 24.3 25.1 25.8 26.5 27.1 27.1
Tertiary education
Males 21.6 22.3 22.9 23.5 24.3 24.7 25.2 25.7
(levels 5-8)
Females 23.6 24.6 25.7 26.7 27.3 28.2 28.9 29.8
Poland
Less than primary, Total 18.0 17.5 16.7 16.1 15.5 15.2 14.6 13.9
primary and lower
Males 18.4 18.0 17.3 16.8 16.2 15.9 15.2 14.5
secondary education
(levels 0-2) Females 17.6 17.1 16.1 15.4 14.9 14.6 14.0 13.3
Upper secondary and Total 62.6 62.2 61.8 61.3 60.7 60.3 60.2 59.8
post-secondary non-
Males 65.5 65.4 65.1 64.7 64.4 64.3 64.5 64.3
tertiary education
(levels 3 and 4) Females 59.6 59.0 58.5 57.9 57.0 56.3 55.9 55.3
Total 19.4 20.3 21.5 22.6 23.8 24.4 25.2 26.3
Tertiary education
Males 16.0 16.6 17.5 18.5 19.5 19.8 20.3 21.2
(levels 5-8)
Females 22.8 23.9 25.4 26.7 28.1 29.1 30.1 31.4
NB: level of education – ISCED 2011
Source: Eurostat http://ec.europa.eu/eurostat/data/database. [lfsa_pgaed] Accessed on June 18, 2018.
The share of early leavers from education and training in Poland has been much lower
than the EU average over the last decade. In 2017, only 5.1% of the population in Poland
aged 18-24 were in this group, while the EU average was 10.6%. The national target, in
accordance with Europe 2020 strategy, is to further decrease the share of early leavers from
education and training to 4.5% by 2020.
135
Figure 6. Early leavers ( ) from education and training (%)
16%
13.9%
14% 13.4%
12.7%
11.9%
12% 11.2% 11.0% 10.7% 10.6%
10%
8%
5.4% 5.6% 5.7% 5.6% 5.4% 5.3%
6% 5.2% 5.0%
4%
2%
0%
2010 2011 2012 2013 2014 2015 2016 2017
Source: Eurostat http://ec.europa.eu/eurostat/data/database. [edat_lfse_14] Accessed on October 12, 2018.
Existing policies/measures may partly explain why the number of early leavers from
education and training is low compared with the EU average. These measures help prevent
students from leaving early, provide support to students at risk or guide those who have left
education/training early back into the system, e.g. the education and career guidance or the
national Voluntary Labour Corps, whose main goal is to develop appropriate conditions for
the social and professional development of youth by establishing a support system for the
most vulnerable groups. The next chapters provide a detailed description of the education
system in Poland and the general polices and measures in place.
5
( ) Early leavers from education and training refer to persons aged 18 to 24 fulfilling the following two
conditions: first, the highest level of education or training attained is ISCED 0, 1, 2 or 3c short; second,
respondents declared not having received any education or training in the four weeks preceding the
survey (numerator). The denominator consists of the total population of the same age group,
excluding no responses to the questions 'highest level of education or training attained' and
'participation in education and training'.
14CHAPTER 2.
Provision of VET
2.1. Introduction
The education system in Poland is currently undergoing structural transformation. In
December 2016, the education ministry introduced reforms which aim to prolong the time
children spend within one educational institution and with one peer group, and to develop a
vocational education system that is responsive to the needs of a modern economy. Key
elements of the reform include:
(a) phasing out lower secondary school (gimnazjum);
(b) restructuring six-year primary education (szkoła podstawowa) into an eight-year
programme, taking place in one institution, divided into two four-year parts (basic and
lower secondary level);
(c) extending the general upper secondary programme (licea ogólnokształcące) - to four
years instead of three - and the vocational upper secondary programme (technika) to five
years instead of four;
(d) introducing two-stage sectoral programmes (dwustopniowa szkoła branżowa); the first
stage sectoral school has replaced the basic vocational school (zasadnicza szkoła
zawodowa) as of 2017/18, while the second stage sectoral schools will begin to operate
in 2020/21.
Changes in the school structure are accompanied by the gradual development of new
core curricula. Another significant package of VET system reforms will take effect in
September 2019 ( 6).
The school system will be transitioning until 2022/2023. During this period, the previous
programmes will be functioning alongside the new ones until they are completely phased out.
In the following section, the structure of the new, reformed system is presented.
6
( ) This includes, among others: strengthening cooperation between schools and employers,
introducing a new form of vocational learning for learners, introducing regular forecast of the demand
for employees in vocational education occupations, new rules on the functioning of the second-stage
sectoral programmes and post-secondary programmes, changes to vocational examinations,
introducing compulsory training in companies for VET teachers, streamlined procedures of introducing
new occupations to the system, changes in subsidies for local governments for VET education,
changes in the structure of the institutions providing vocational training, new vocational core
curriculum and classification of occupations.
152.2. Government-regulated VET provision
Figure 7. VET in Poland’s education and training system in 2018
16Education in Poland is compulsory up to 18 years of age, while full-time school education is
compulsory up to age 15. Compulsory education for 15-18 year olds can take place as part-
time education, both in and out of school, e.g. in the form of short qualification courses or
vocational training for juvenile workers.
VET provided at the secondary level:
(a) three-year first stage sectoral programme ( 7) (branżowe szkoły I stopnia, ISCED 353,
EQF 3) introduced in 2017 are part of the formal education and training system. This
programme is available to primary school graduates (usually 15 year-olds), that is those
who received the primary school leaving certificate ( 8). The first stage sectoral
programme combines general and vocational education and leads to a vocational
qualifications diploma for a single-qualification occupation (after passing the State
vocational examination). The school director decides on the share of work-based
learning, however it cannot be less than 60% of the hours foreseen for vocational
education (which combines both theoretical and practical training) ( 9). Completion of this
programme provides access to further education: at the second year of study at general
upper secondary schools for adults or in the two-year second stage sectoral programme.
(b) two-year second stage sectoral programme (branżowe szkoły II stopnia, ISCED 354,
EQF 4) will begin to operate in the 2020/21 school year. This second stage sectoral
programme aims at further developing the vocational qualifications attained in the first
stage sectoral programme and will be available to the graduates of the first stage sectoral
programmes - usually 18 year-olds. The second stage sectoral programme will lead to a
vocational qualifications diploma for occupations consisting of two qualifications (after
passing the State vocational examination). General education in this programme is
planned to be limited, with the main focus placed on the vocational training to be
conducted in the form of vocational qualification courses. The school director decides on
the share of work-based learning, however it cannot be less than 50% of the hours
foreseen for vocational education (which combines both theoretical and practical
training). Second stage sectoral programme graduates will be eligible to continue to
tertiary education after passing the secondary school leaving examination (matura).
(c) five-year vocational upper secondary programme ( 10) (technika, ISCED 354, EQF 4)
are part of the formal education and training system. This programme is available to
7
( ) The first-stage sectoral programme was introduced in the 2017/2018 school year replacing the
basic vocational programme. However, for the next two school years, students of the previous basic
vocational programme will be finishing their education under the old system. The three-year basic
vocational programme, similarly to the first stage sectoral programme, enabled pupils to attain a
vocational qualifications diploma after passing a state vocational examination and also to continue
education on a higher level in the second year of the general upper secondary programme for adults.
8
( ) This also applies to lower secondary school graduates during the transitional period.
9
( ) Regulation of the Minister of National Education of March 28, 2017 on the teaching plan in public
schools (Journal of Laws 2017, item 703).
10
( ) The four-year vocational upper secondary programme will be transformed into a five-year
programme starting with the 2019/2020 school year for graduates of the new primary programme.
Graduates of the old programmes continue their education based on the previous arrangements.
17primary school graduates, usually 15 year olds, that is those who received the primary
school leaving certificate. The vocational upper secondary programme combines general
and vocational education and leads to a vocational qualifications diploma for occupations
consisting of two qualifications after passing the State vocational examination. The
school director decides on the share of work-based learning, however it cannot be less
than 50% of the hours foreseen for vocational education (which combines both practical
and theoretical training). Graduates of these programmes, after passing the secondary
school leaving examination (matura), are eligible to continue to tertiary education.
(d) three-year special job-training programme (szkoły specjalne przysposabiające do
pracy, ISCED 243) for learners with special education needs (SEN) leads to a job-
readiness certificate. This programme is designed for learners with moderate and severe
intellectual disabilities or multiple disabilities. It provides educational activities (personal
and social functioning classes; communication skills development classes, creativity
development classes, physical education and job training classes) as well as revalidation
activities. Job training classes constitute over a half of the hours foreseen for the
educational activities ( 11).
(e) work preparation classes are available for SEN learners in seventh and eighth grade of
primary school (lower secondary level) for pupils aged 15 years and older (oddziały
przysposabiające do pracy, ISCED 244, EQF 2). Classes combine general education and
work preparation – both adapted to the individual learner’s needs and capabilities ( 12).
Post-secondary level
At the post-secondary non-tertiary level, vocational qualifications can be attained in one- to
two-and-a-half year school-based programmes (szkoły policealne, ISCED 453). Post-
secondary programmes are part of the formal education and training system and are
available to the graduates of general and vocational upper secondary programmes (usually
19 and 20 year-olds), as well as in the future – the second stage sectoral programmes
(usually 20 year-olds).
These programmes are strictly vocational and do not include general education. The
school director decides on the share of work-based learning, however it cannot be less than
50% of the hours foreseen for vocational training.
Adult learning and out-of-school VET
Adult learning and out-of-school VET is available in continuing education centres, practical
training centres, further training and professional development centres ( 13), and initial VET
(IVET) schools offering:
11
( ) Regulation of the Minister of National Education of March 28, 2017 on the teaching plan in public
schools (Journal of Laws 2017, item 703).
12
( ) Regulation of the Minister of National Education of 17 March 2017 on the detailed organisation of
public school and public pre-schools (Journal of Laws 2017, item 649 with further amendments).
13
( ) The structure of institutions providing VET training will change as of September 2019.
18• vocational qualification courses (kwalifikacyjne kursy zawodowe – KKZ) based on the
curricula for a qualification in a given occupation; they allow learners to take the State
vocational examination and obtain a vocational qualification certificate;
• vocational skills courses based on the core VET curriculum, including learning outcomes
for a qualification or common learning outcomes for all occupations;
• at least 30-hour general skills courses that are based on the general education
curriculum;
• theoretical courses for juvenile employees.
Adults, including the unemployed, may also undertake vocational training through
courses provided by training companies and other non-formal education institutions. Since
2016, the qualifications based on the curricula of such courses can be included in the
national qualifications framework.
A special path for young people over 15 years of age lacking a lower secondary
education who want to attain vocational qualifications and/or supplement their education is
provided by the Voluntary Labour Corps (Ochotnicze Hufce Pracy - OHP), which offer
vocational training both in their own workshops or as on-the-job training with an employer
(see Section 2.2.3. and 4.1.)
VET in higher education
The law on higher education in Poland distinguishes different types of higher education
institutions: academic, vocational and others, such as medical or military. The second type of
school offers first (Licentiate degree) and second (Master’s degree) cycle study programmes
as well as uniform master’s studies, but not doctoral programmes. Higher education
vocational schools are also not obliged to conduct scientific research and educate academic
staff.
Table 6. The share of higher vocational schools and students in the total number of higher
education institutions and students
2013 2014 2015 2016 2017
Schools 54.6 54.4 54.0 53.6 54.7
Students 18.4 17.7 16.9 16.8 17.6
Source: Local Data Bank of Statistics Poland https://bdl.stat.gov.pl/BDL/start Accessed on September 24, 2018.
Apart from higher education institutions, colleges of social work (kolegia pracowników
służb społecznych) exist, offering programmes at ISCED 5 level ( 14). These colleges provide
three-year programmes for the occupation of social worker. In the 2017/2018 school year,
there were four colleges of social work with 234 student, 84% of whom are women (Statistics
Poland, 2018c).
14
( ) Teacher training colleges (kolegia nauczycielskie) and foreign language teacher training colleges
(nauczycielskie kolegia języków obcych) were closed as of 1 October 2016.
192.2.1. Educational pathways
Up to the 2018/19 school year, more than half of the students chose a vocational path at age
16 after completing lower secondary education. Admission to an upper secondary
programme depended on the results of the lower secondary school leaving examination and
school leaving certificates. The age at which students can choose a vocational pathway was
lowered by one year by the introduced reform of the structure of the education system. In the
new system, a vocational path is accessible after completing primary school at the age 15.
Admission to an upper secondary programme will also depend on the results of the school
leaving examination and school leaving certificates.
The structure of young students by school type (Figure 8) provides more information on
this issue. In 2017, over 58% of youth participated in VET programmes, with more learners in
vocational upper secondary programmes than in basic vocational ones (44% in the first type
and 14% in the latter). Since 2010, there has been a small rise in the share of young
students in VET programmes, which is probably due to the 2011 government reform and the
improving image of VET in society. This growing popularity of VET programmes is mainly
visible for vocational upper secondary schools, but not so for basic vocational schools, where
the share of learners is fluctuating. Recent changes in shares between vocational upper
secondary schools and basic vocational schools correspond to longer-term trends (see
Section 1.1.).
Figure 8. The distribution of youth in general upper secondary programmes and VET
programmes*
2017 41.5% 13.6% 44.0%
2016 41.6% 14.2% 43.3%
general upper secondary
2015 41.9% 14.9% 42.3%
2014 42.4% 15.4% 41.3% basic vocational**
2013 43.3% 14.6% 41.3% vocational upper
secondary
2012 43.8% 14.9% 40.6%
special job-training
2011 43.8% 15.2% 40.2%
2010 43.7% 15.5% 40.1%
0% 20% 40% 60% 80% 100%
*only schools for youth included ** in 2017 the first stage sectoral programme is included
Source: own calculation based on Local Data Bank, Statistics Poland https://bdl.stat.gov.pl/BDL/start and (Statistics Poland,
2018b). Accessed on September 24, 2018.
The structure of learners in all age groups, including adults, differs slightly – the shares
of VET and general education learners are almost equal. The difference between both
structures (Figures 8 and 9) is due to the significant number of learners in the general upper
secondary programme for adults.
20Figure 9. The structure of students in all age groups in general upper secondary programmes
and VET programmes in 2017
special job- basic vocational
training 1% 8%
1st stage sectoral
4%
general upper
secondary 48%
vocational upper
secondary 39%
Source: own calculation based on Local Data Bank, Statistics Poland https://bdl.stat.gov.pl/BDL/start. and (Statistics Poland,
2018b). Accessed on September 24, 2018.
2.2.2. Practical training in VET
The curriculum for programmes at the upper secondary level currently combines general and
vocational education; post-secondary programmes provide only vocational education. The
vocational parts consist of theoretical and practical aspects. Vocational schools have a
relatively high level of independence regarding the organisation of practical training. The
practical training – work-based learning – can take place in school workshops, continuing
education centres and practical training centres ( 15) or with an employer. Practical training
with an employer can be organised in different ways, partially or fully at an employers’
premises, including also dual training.
A distinctive form of practical training is “on the job training” (traineeship at an
employer’s premises) – mandatory for vocational upper secondary, post-secondary and –
according to plans – second stage sectoral programmes. On the job training is organised to
apply and deepen learners’ knowledge and skills and has to last from 4 to 12 weeks,
depending on the type of occupation.
A special type of practical training ( 16) is provided through juvenile employment for the
purpose of vocational training (przygotowanie zawodowe młodocianych pracowników) for
young people who are at least 15 years old but have not yet reached 18, with a lower
secondary education or primary education. Juvenile employment is an apprenticeship based
on a contract between the learner and employer. In the 2017/2018 school year, juvenile
workers constituted about half of all the learners in the first stage sectoral schools (Statistics
Poland, 2018c).
Juvenile employment for the purpose of vocational training can take the form of:
15
( ) The structure of institutions providing VET training will change as of September 2019.
16
( ) An additional new form – the student apprenticeship – will be available as of September 2019.
21(a) Training for a profession (nauka zawodu) – this is an apprenticeship with the theoretical
education taking place at school (first stage sectoral) or in an out-of-school system (e.g.
courses) and the practical training is organised by the employer on the basis of a work
contract. It lasts not more than 36 months and is finalised with a State vocational
examination. Practical training can also be organised by an employer in the craft trades,
on the basis of a work contract. It also lasts not more than 36 months and is finalised with
a journeyman’s examination (egzamin czeladniczy).
(b) Training for a specific job (przyuczenie do wykonywania określonej pracy) – this rare
form, limited to a small group of youth, prepares a learner to perform specific tasks in a
profession. It lasts from 3 to 6 months and is finalised with a verifying examination.
During the training period, a juvenile worker is entitled to a salary (from 4 to 6 percent of
the national average salary, depending on the subsequent year of training), social security
benefits and holiday leave. The employer may be reimbursed for the salary and social
security contribution for the juvenile worker for the period of vocational training from the
Labour Fund (established to counter unemployment and financed by mandatory contributions
paid by employers). Each year however, the minister responsible for labour sets financial
limits on the reimbursements.
If the juvenile worker passes the examination, the employer is entitled to financial
support for the training period approximately equal to 1 850 EUR in the case of 36 months of
training (if the training is shorter, the amount is calculated proportionally to the training
period), as well as to 58 EUR for each month of training. This financial support is financed
from the Labour Fund.
2.2.3. Vocational Qualifications
Completing any type of VET programme is not the same as attaining a vocational
qualification. The educational level is certified, but not the vocational qualification. Vocational
qualifications can only be attained by passing an external State vocational examination.
17
Table 7. Main types of vocational examinations and vocational certificates ( )
Name Managing Name of certificate Short description
institution
State Central Vocational Certifies a qualification in an occupation
vocational Examination certificate - or all qualifications in an occupation.
examination Board Certificate of a Has two parts: written and practical; the
(egzamin (Centralna vocational candidate has to pass both in order to
potwierdzający Komisja qualification in an receive a certificate or diploma.
kwalifikacje w Egzaminacyjna) occupation It is based on uniform requirements, the
zawodzie) together with 8 (świadectwo same examination tasks, assessed
regional potwierdzające according to the same criteria and
examination kwalifikację w organised in the same way regardless
boards zawodzie) of where the examination is held.
(okręgowe It is free for school graduates.
17
( ) Changes in some of the names of the examinations and certificates are expected as of September
2019.
22komisje Vocational Awarded to holders of vocational
egzaminacyjne) qualifications certificates for all qualifications in a
diploma given occupation who also have
(Dyplom completed education at the upper
potwierdzający secondary level.
kwalifikacje
zawodowe)
Journeyman’s Examination Journeyman’s Has two parts: practical and theoretical.
examination boards of crafts certificate The practical part consists of tasks
(egzamin chambers (świadectwo individually performed by a candidate.
czeladniczy) czeladnicze) The theoretical part is both written and
Master’s Master’s diploma oral.
examination (dyplom Tasks are based on common
(egzamin mistrzowski) examination requirements and the
mistrzowski) curriculum of the occupation.
It is fee based.
Verifying Examination Document certifying It certifies selected qualifications in an
examination boards of crafts that the verifying occupation that correspond to a specific
for selected chambers examination has craft.
qualifications been passed. Has two parts: practical and theoretical.
in crafts (zaświadczenie o The theoretical part is oral.
(egzamin zdaniu egzaminu It is fee based.
sprawdzający sprawdzającego)
wybrane
kwalifikacje
zawodowe w
rzemiośle)
Verifying Employer or Document certifying This is for both adult and juveniles after
examination examination the specific skills the training.
after training boards of crafts acquired during In the case of unemployed persons, the
for a specific chambers training for a form of the examination is individually
job specific job. determined during the training in the
(egzamin (zaświadczenie programme.
sprawdzający stwierdzające
po przyuczeniu nabycie
do umiejętności w
wykonywania wykonywaniu prac
określonej których dotyczyło
pracy) przyuczenie)
Source: own elaboration based on legal acts
In the 2016/2017 school year, the State vocational examination was administered for
over 200 qualifications; 76% of the participants (including graduates of VET programmes,
participants of vocational qualification courses as well as extramural participants) passed
both the theoretical and practical parts of the examination (CKE, 2017). Success rates differ
among various types of qualifications and groups of learners and are higher for the
theoretical (written) part compared to the practical one ( 18).
18
( ) Passing the exam requires at least 50% of the points from the written part of the exam and at least
75% from the practical part.
23Table 8. The most popular qualifications for which State vocational examinations were taken in
the 2016/2017 school year
Share of
Number of students who
Qualification
candidates passed the
examination
Assembly and use of personal computers 17322 77.9
Designing and administering local computer networks 15672 76.3
Organisation and monitoring of resources and information
8178 81.2
flows in the processes of production, distribution and storage
Planning and managing activities in organisations 7975 73.4
Source: own calculation based on Central Examination Board data, (CKE, 2017).
Adults aged 18 and older can be awarded a certificate for a vocational qualification after
passing State vocational examination extramurally (eksternistycznie). They can be awarded
a vocational qualification diploma when all the qualifications in an occupation have been
certified and they have completed their education at the basic vocational, 1st stage vocational
or vocational upper secondary level. A candidate for an extramural State vocational
examination has to have at least a primary or a lower secondary education and at least two
years of education or employment in an occupation relating to the qualification for which the
examination is being taken. Adult candidates pay a fee for taking the examination.
Young people over 15 years of age without a lower secondary education can attain
vocational qualifications and/or supplement their education in one of the 217 agencies of the
Voluntary Labour Corps (Ochotnicze Hufce Pracy - OHP). This organisation provides
education in over 60 professions, both in their own workshops or as on-the-job training with
an employer. Each year, over 800 000 young people receive various forms of help from
Corps agencies. The Voluntary Labour Corps support youth at risk of social exclusion,
frequently from disadvantaged families. For more information on Voluntary Labour Corps
activities, see Section 4.1.
2.2.4. Educational Outcomes
The cognitive skills level of VET students, especially those in basic vocational programmes,
are significantly lower than those of general education students, which was evident in the
Polish PISA (Programme for International Student Assessment) results of 2009 and also in
the PIAAC (The Programme for the International Assessment of Adult Competencies) study
(Federowicz, 2011; Rynko, 2013). The difference in skills levels applies both for reading and
mathematics, but is a bit smaller in the latter case.
24Figure 10. PIAAC mean cognitive skills level of students aged 16-19 by programme type in
2011-2012
300 292 279 276
243 251
250 238
200
general upper secondary
150
basic vocational
100 vocational upper secondary
50
0
literacy numeracy
Source: Rynko, 2013
According to the Labour Force Survey (LFS), in the 1st quarter of 2017 the employment
rate of recent graduates (one year after completing education) was 55.8% for post-secondary
and vocational upper secondary programme graduates and 54.5% for basic vocational
programme graduates (in both cases was higher than the employment rate of general upper
secondary programme graduates). In comparison, the employment rate of tertiary graduates
was 84.4% (Statistics Poland, 2017).
Table 9. Employment and unemployment rates of recent graduates (up to one year after leaving
education) in the age group of 15-30
First quarter of the year 2010 2011 2012 2013 2014 2015 2016 2017
employment rate
basic vocational
51.2 43.8 38.0 47.6 37 50.0 48.8 54.5
programmes
vocational upper secondary
programmes and post- 59.6 49.5 49.5 52.1 52.3 62.1 58.6 55.8
secondary programmes
general upper secondary
50.0 44.2 37.5 43.8 28.6 36.6 49.1 52.8
programmes
tertiary 72.1 74.0 73.3 67.9 70.8 71.7 75.9 84.4
unemployment rate
basic vocational
42.1 50.0 51.3 47.2 57.1 41.9 46.2 34.5
programmes
vocational upper secondary
programmes and post- 34.3 44.2 40.7 41.0 42.9 31.8 30.7 34.3
secondary programmes
general upper secondary
30.0 47.1 44.4 41.7 60.0 48.4 33.3 36.7
programmes
tertiary 21.5 19.8 21.3 26.2 23.7 23.2 17.9 12.5
Source: (Statistics Poland, 2017) and earlier issues
The share of young people aged 20-24 who are not in education, employment or training
(NEET) is relatively high in Poland and amounts to 15.4%. In the last two of years, this
indicator level has dropped significantly, reaching the EU 28 level. The NEET rate is almost 3
25times higher for vocational education graduates than for general education ones. This is
because a large share of general upper secondary education graduates continues their
education at higher levels, while most VET graduates enter the labour market. Chances of
women being NEETs are higher, probably due to responsibilities related to motherhood.
Table 10. The share of young people aged 20-24 not in education, employment or training
(NEET) in 2017
Education attainment men women total
Less than primary, primary and lower secondary education
3.0% 3.6% 3.3%
(levels 0-2)
Upper secondary and post-secondary non-tertiary (levels 3
1.9% 3.7% 2.8%
and 4) – general
Upper secondary and post-secondary non-tertiary (levels 3
7.7% 8.7% 8.2%
and 4) – vocational
Tertiary education (levels 5-8) 0.5%* 1.4* 0.9%
All education levels 13.2% 17.6% 15.4%
NB: level of education – ISCED 2011 * low reliability
Source: Eurostat [edat_lfse_21] Accessed on September 24, 2018.
2.3. VET governance
VET has three governance levels: national (ministries), regional (school superintendents,
mainly in pedagogical supervision) and county (powiat). The education ministry is in charge
of VET policy at the secondary level, supported by other ministries responsible for particular
occupations. The Ministry of Science and Higher Education is responsible for higher VET.
Social partners advise policy makers on necessary changes in VET.
The majority of public education institutions in Poland are managed by local government
units. Municipalities (gminy) are responsible for establishing and managing pre-schools,
primary and lower secondary schools (currently being phased out), excluding schools for
learners with special needs; counties (powiaty) are responsible for upper secondary schools,
including vocational schools, and schools for children with special needs; the regions
(województwa) are responsible for schools of regional and trans-regional significance (e.g.
groups of schools or vocational schools important for the regional economy). The chart below
illustrates the structure of the educational expenditures of counties in 2017.
26You can also read