Preliminary Study of Consumer Preference in Decision Making Processed Fish Products in Bekasi (Case Study of Bandar Djakarta Restaurant, Bekasi)
←
→
Page content transcription
If your browser does not render page correctly, please read the page content below
Asian Journal of Advances in Agricultural Research

                            15(3): 26-32, 2021; Article no.AJAAR.68683
                            ISSN: 2456-8864

        Preliminary Study of Consumer Preference in
 Decision Making Processed Fish Products in Bekasi
 (Case Study of Bandar Djakarta Restaurant, Bekasi)
     Ernita Anastasia1*, Achmad Rizal1, Asep Agus Handaka1 and Iwang Gumelar1
 1
  Departement of Fisheries, Faculty of Fisheries and Marine Science, Padjadjaran University, Jl. Raya
       Bandung Sumedang KM.21, Jatinangor Districts, Sumedang Regency, West Java, Indonesia.

                                                                                             Authors’ contributions

         This work was carried out in collaboration among all authors. Author EA designed the study,
      performed the statistical analysis, wrote the protocol and wrote the first draft of the manuscript.
Authors AR and AAH managed the analyses of the study. Author IG managed the literature searches.
                                                   All authors read and approved the final manuscript.

                                                                                                  Article Information

                                                                                    DOI: 10.9734/AJAAR/2021/v15i330155
                                                                                                                  Editor(s):
                                                        (1) Dr. Bing-Lan Liu, Chaoyang University of Technology, Taiwan.
                                                                                                                Reviewers:
                                                      (1) Coster Adeleke Sabitu, Federal University of Agriculture, Nigeria.
                                                                             (2) Zeynep Dorak, Istanbul University, Turkey.
                                             Complete Peer review History: http://www.sdiarticle4.com/review-history/68683

                                                                                           Received 25 March 2021
  Case Study                                                                                Accepted 30 May 2021
                                                                                           Published 09 June 2021

ABSTRACT
 Consumer preference is a consumer attitude towards a product choice. The needs and desires of
 consumers are very varied and can change because of the factors that influence consumers in
 choosing products. This study aims to analyze consumer preferences and what attributes are
 considered by consumers in making decisions to choose processed fish products. This research
 was conducted at Bandar Djakarta Restaurant, Summarecon, Bekasi City in February - March
 2021. Primary data collection techniques used accidental sampling of 30 respondents, while
 secondary data was obtained from Bandar Djakarta Bekasi, FPIK Unpad Library and Unpad Public
 Library. The analytical tool used to determine consumer preferences is the measurement of
 attitudes using the Likert scale and the attribute analysis tool that is considered in product
 selection, namely the Chi Square analysis. Based on the results of the analysis of the level of
 consumer preference at the Bandar Djakarta Restaurant, it shows that the most preferred
 processed product is shrimp. The attributes that are considered in purchasing processed shrimp
 products are consecutively good taste, low price, and easy to find, high nutrition and family
 preference at the same level.
_____________________________________________________________________________________________________

*Corresponding author: Email: ernitaanastasia08@gmail.com;
Anastasia et al.; AJAAR, 15(3): 26-32, 2021; Article no.AJAAR.68683
Keywords: Attributes; consumer preferences; processed fish.
1. INTRODUCTION Province, Indonesia. Implemented in February-
March 2021.
Bekasi City is an area that has the potential for
marketing fishery products. Some people know The method used in this research is a case study
only a few types of fish that are distributed close method, a case study is a study of the status of
to their homes, in the end this information the research subject with respect to a specific or
becomes their personal preference. The more typical phase of the whole personality. This
fish in the community, the more likely people are method will explain the results of a descriptive
to consume fish [1]. According to [2] Bekasi City data analysis. The data used consists of primary
is a city with low consumption of fish among its data and secondary data. Primary data was
people, which is only 22%. obtained directly through questionnaires or
interviews for consumer with accidental sampling
Although various programs to increase fish method. The number of questionnaire
consumption have been implemented, participants at the time of data collection were 30
Indonesian fish consumption is still considered people.
low. Based on the description above, it can be
concluded that fish consumption in Indonesia is 2.1 Data Analysis
still low compared to other countries. The level of
Indonesian fish consumption in 2013 amounted The data analysis method used in this research
to 35.14 kg/cap/year [3]. Fish consumption in is descriptive method. Descriptive analysis is
Korea is 54 kg/cap/year, the Netherlands 52 used to analyze consumer preferences for
kg/cap/year, Spain 41 kg/ cap/year, and France purchasing processed seafood products by
35 kg/cap/year [4]. So, it is necessary to further calculating the percentage of the number of
study the pattern of fish consumption in respondents who are presented in a simple
Indonesia. tabulated form. Data analysis used supporting
software for IBM SPSS Statistics 22 and
One type of healthy food is fish. Fish provides a Microsoft Office Excel 2019.
variety of proteins, fats (omega 3 fatty acids),
vitamins (vitamin A, vitamin D, vitamin B6, There are three data analyzes used in this study,
vitamin B12), and minerals (iron, iodine, namely the validity test to test whether the
selenium, zinc, and fluorine) which is needed by measuring instrument used is valid or invalid, the
the body [5]. Various benefits obtained when reliability test to test whether the measuring
consuming fish are meeting the needs of 10 instrument used is reliable or not, and Chi
essential fatty acids, lowering blood pressure, Square analysis to analyze the product attributes
lowering cholesterol levels, losing weight, under consideration consumers towards the
stimulating brain growth and intelligence, healthy purchase of processed seafood products.
eyes, preventing wrinkles and the skin aging
process, and preventing serious diseases such 2.2 Validity and Reliability Test
as heart disease, breast cancer, and prostate
Research results are valid if there is a similarity
cancer [6].
between the data collected and the data that
Consumer preference is a consumer’s attitude occurs on the object under study [9]. To test the
towards a choice of product brands that are validity of the construct, it was done by
formed through evaluation of various brands in correlating the score of the questions with the
the various options available [7]. Restaurant is a total score. Then use the Product Moment
business that operates in the service sector. One correlation technique as follows:
of the strategies in managing a restaurant ∑ (∑ ) (∑ )
business is to provide facilities that are not only rxy =
{ ∑ (∑ ) } { ∑ (∑ ) }
focused on the taste aspects of the food, but also
on the nuances of the room the restaurant offers Where:
so that it can always compete [8].
r = Product Moment Correlation
2. MATERIALS AND METHODS Coefficient
x = Score of Each Item
This research was conducted at the Bandar y = Total Score
Djakarta Restaurant, Bekasi City, West Java n = Sample Size
27Anastasia et al.; AJAAR, 15(3): 26-32, 2021; Article no.AJAAR.68683
The Alpha formula is used to find the reliability of and the Bandar Djakarta Restaurant in Bekasi
instruments whose scores are not 1 or 0 [6], for City during the pandemic operates every day
example a questionnaire or description form from 10:00 to 20:00. Mr. Harry R. Simanjuntak as
questions to find reliability for all items is to the manager explained that the Bandar Djakarta
correct the correlation number obtained with the r Bekasi City Restaurant can accommodate 200
table. customers every day, with the help of 30
employees. Bandar Djakarta Kota Bekasi has a
The Cronbach Alpha () statistical test formula is seafood menu price range of IDR 90,000-
as follows: 130,000 / per 100 gr. The Bandar Djakarta
restaurant has a range of 24,500-70,000 / 100 gr
k ∑σ and for other fish the price is Rp. 55,000 - Rp.
CA = 1−
k−1 σ 220,000 with sizes from M-XXL. Seafood
ingredients are delivered directly to the Bandar
Where: Djakarta Restaurant, Bekasi City. So far there
have been no obstacles in the procurement of
CA = Coefficient Cronbanch Alpha (α) seafood ingredients.
K = Number of questions in item
= Item Variance
3.1 Consumer Preferences of Processed
= Total Variance
Fish Products at Restaurant Bandar
2.3 Chi Square Test Djakarta
Chi Square or chi square is used to test the The process of making consumer decisions in
comparative hypothesis (test for differences) on buying processed fish products is also influenced
the average k independent samples with each by consumer preferences. The preferences of
sample having several classes or categories [10]. consumers of processed fish products are
The basic Chi Square formula is as below. the choices that consumers like or dislike
about processed fish products to be
(O − E ) consumed.
X =
E
The table shows that the frequency of buying
Where: products preferred by the Bandar Djakarta
Restaurant respondents varies widely. Based on
X2 = Chi Square Value the table above, it is known that of the 30
Oi = Observed value respondents, 15 of them have the frequency of
Ei = Expected value buying processed fish types of shrimp, in the
second place, 10 are the frequencies that buy
3. RESULTS AND DISCUSSION processed fish types of squid and the last order
there are 5 frequencies that buy groupers.
The Bandar Djakarta Restaurant in Bekasi City is Consumers prefer shrimp because according to
located in Bekasi City, which is on Jalan Bulevar [11] Shrimp is a food source of high-quality
Ahmad Yani Blok F, MargaMulya, North Bekasi, animal protein which is good for health.
Table 1. Preferred processed fish product
No. Types of Processed Products Percentage Participants
1. Squid 33.3% 10
2. Shrimp 50% 15
3. Grouper 16.7% 5
Total 100% 30
Source: Primary Data (2020)
Table 2.Chisquare test for processed fish product
No. Types of Processed Products X2 df X2 Table p (sig.)
1. Squid 3.60 3 7.82 0.308
2. Shrimp 8.13 3 7.82 0.043
3. Grouper 10.27 3 7.82 0.016
Source: Primary Data (2020)
28Anastasia et al.; AJAAR, 15(3): 26-32, 2021; Article no.AJAAR.68683
According to Table 2 above, it can be defined to nutrition, easy to find, family-friendly and easy
show that there are differences in consumer way of serving. The attributes that are
preferences for products and there is one considered in selecting processed shrimp
product that is not significantly different. Each products are delicious taste, low price, easy to
product observed was significantly different from find, high nutrition and family preference at the
the table at a significant level of 95%. Based on same level. The attributes that are considered in
this table, there are differences in consumer selecting processed grouper products are high
preferences for shrimp and grouper products, nutrition, low price and easy to find, respectively.
while squid products have significant differences
(based on statistic rule 0.05 > p(sig.)). 3.2 Validity and Reliability Test for
Processed Products at Restaurant
Table 3 shows that consumers of processed
Bandar Djakarta
squid products have a level of liking at the level
of normal, like it and really like it with a
Based on the preference items above, according
percentage of 30%. Consumers of processed
to [12] an item is said to be valid if it has a
shrimp products are dominated by consumers
validity value greater than 0.3 so that most of the
who really like these processed products with a
items above can be said to be valid. According to
percentage of 46.7%. Consumers of processed
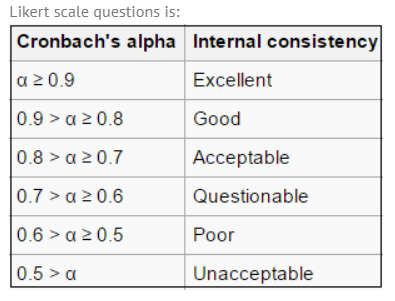
grouper fish are dominated by consumers who [13] if > 0.90 then reliability is perfect. If is
do not like these processed products with a between 0.70 - 0.90, the reliability is high. If is
percentage of 50%, and only 16.7% of 0.50 - 0.70, the reliability is moderate. If Anastasia et al.; AJAAR, 15(3): 26-32, 2021; Article no.AJAAR.68683
Fig. 1. Qualification of the value of the Cronbach alpha coefficient [10]
Table 6. Chi square test for processed squid products preference
2
No. Preference X df Table p (sig.)
1. Things to Consider 3.600 3 7.8147 0.308
2. Smell 12.133 3 7.8147 0.007
3. Color 29.467 3 7.8147 0.000
4. Taste 17.000 4 9.4877 0.002
5. Price 12.200 2 5.9915 0.002
6. Reason to Buying 19.600 5 11.0705 0.001
Source: Primary Data (2020)
Table 7. Chi square test for processed shrimp products preference
2
No. Preference X df Table p (sig.)
1. Things to Consider 13.467 3 7.8147 0.004
2. Smell 3.600 3 7.8147 0.308
3. Color 34.267 3 7.8147 0.000
4. Taste 26.000 4 9.4877 0.000
5. Price 2.133 1 3.8415 0.144
6. Reason to Buying 13.333 4 9.4877 0.010
Source: Primary Data (2020)
Table 8. Chi square test for processed grouper products preference
No. Preference X2 df Table p (sig.)
1. Things to Consider 0.667 3 7.8147 0.881
2. Smell 21.467 3 7.8147 0.000
3. Color 3.333 1 3.8415 0.068
4. Taste 2.333 4 9.4877 0.675
5. Price 30.200 2 5.9915 0.000
6. Reason to Buying 15.200 2 5.9915 0.001
Source: Primary Data (2020)
30Anastasia et al.; AJAAR, 15(3): 26-32, 2021; Article no.AJAAR.68683
3.3 Chi Square Test for Processed 4. CONCLUSION
Products at Restaurant Bandar
Djakarta Based on the description of the discussion,
The table above shows that there are differences several conclusions can be made, including:
in consumer preferences for processed squid Consumers at Bandar Djakarta restaurants tend
based on attributes except for the part that is to prefer processed shrimp products over
considered. Each attribute in the observed squid processed squid or grouper fish. And each
product is significantly different (based on favorite product has several parts, namely the
statistic rule 0.05 > p(sig.)). with a significant attributes in each product. Attributes that are
level of 95%, which means that the null considered in selecting processed squid products
hypothesis (Ho) is rejected, and the alternative are delicious taste, low price, high nutrition, easy
2
hypothesis (Ha) is accepted as X is calculated to to find, family-friendly and easy serving methods.
2
be greater than X table, so that there are The attributes that are considered in selecting
differences in consumer preferences for processed shrimp products are delicious taste,
attributes. which is contained in the processed low price, easy to find, high nutrition and family
squid by the respondents of the Bandar Djakarta preference at the same level. The attributes that
Bekasi Restaurant. The most influential attributes are considered in selecting processed grouper
in consumer selection are product smell, product products are high nutrition, low price and easy to
color, product taste, product price, and reason for find, respectively.
buying the product.
5. SUGGESTION
The table above shows that there are differences
in consumer preferences for processed shrimp Based on the description of the above discussion,
based on attributes except in the product smell several suggestions are needed, namely an
and product price sections. Each attribute in the evaluation of Bandar Djakarta Restaurant
observed shrimp product is significantly different business actors is needed to continue to improve
(based on statistic rule 0.05 > p(sig.)) with a product quality and improve restaurant quality, to
significant level of 95%, which means that the keep the taste of product because it is the most
null hypothesis (Ho) is rejected, and the considered attributes.
2
alternative hypothesis (Ha) is accepted as X is
2
calculated to be greater than X table, so that CONSENT
there are differences in consumer preferences
for the attributes contained. on shrimp As per international standard or university
processing by respondents in Bandar Djakarta standard, respondents’ written consent has been
Bekasi Restaurant. The most influential attributes collected and preserved by the author(s).
in consumer selection are the things considered
by the product, the color of the product, the taste COMPETING INTERESTS
of the product and the reasons for buying the
product. Authors have declared that no competing
interests exist.
The table above shows that there are differences
in consumer preferences for processed grouper ACKNOWLEDGEMENT
based on attributes except for the part
considered, product color and product taste. The authors are grateful to the faculty of fishery
Each attribute in the observed squid product is and marine science of Universitas Padjadjaran,
significantly different (based on statistic rule 0.05 which supported the study through the annual
> p(sig.)) with a significant level of 95%, which research program.
means that the null hypothesis (Ho) is rejected,
and the alternative hypothesis (Ha) is REFERENCES
accepted as X2 is calculated to be greater than
2
X table, so there are differences by the 1. Rizal A, Kusumartono FX, Zaida Z.
Bandar Restaurant respondents. Djakarta Bekasi. analysis of fisheries sector contribution in
The most influential attributes in consumer nabire district of west papua province.
selection are product smell, product price, World Scientific News. 2019;133:71-84.
product taste and reasons for buying the 2. Harlin. Analysis of consumer preferences
product. for fishery products (case study in Bekasi
31Anastasia et al.; AJAAR, 15(3): 26-32, 2021; Article no.AJAAR.68683
City). Jakarta: Open University consultation, WHO, Genewa; 2003.
Postgraduate Program; 2008. 7. Rizal, Achmad. Buku ajar manajemen
3. Directorate General of Fishing. pemasaran Di Era Masyarakat Industri 4.0.
GEMARIKAN (Joy of Eating Fish Yogyakarta: Deepublish; 2021.
Popularizing): Improving Nutrition Early; 8. Freddy, Rangkuti. SWOT analysis of
2018. technique dissecting business cases.
Accessed 23 May 2021. Jakarta: Gramedia Pustaka Utama; 2014.
Available:https://kkp.go.id/djpt/ppnsungailia 9. Armstrong Gery, Kotler P. Marketing
t/artikel/6676-gemarikan-gemar- principles. Volume 1. Eighth Edition.
memasyarakatkan-makan-ikanupaya- Jakarta: Erlangga; 2001.
peningkatan-gizi-sejak-dini 10. Sugiyono. Statistics for research.
4. Birch D, Meredith L, Denise H. Drivers and Bandung: Alfabeta; 2011.
barrier to seafood consumption in Australia. 11. Sugiarto. Shrimp farming ed. bandung:
Journal of Consumer Marketing. 2012;64- Sinergi Pustaka Indonesia; 2012.
73. 12. Suherman E. Evaluation of mathematics
5. Effendie IM. Biologi Perikanan. Yayasan learning. FPMIPA UPI. Bandung; 2003.
Pustaka Nusantara, Yogyakarta; 2002. 13. Ghazali Iman. Structural equation model,
6. WHO. Diet, Nutrition, and the prevention of concept and application with AMOS 16.0
chronic disease, technical report series program, publisher board of Diponegoro
916 of a joint FAO/WHO expert University, Semarang; 2009.
© 2021 Anastasia et al.; This is an Open Access article distributed under the terms of the Creative Commons Attribution
License (http://creativecommons.org/licenses/by/4.0), which permits unrestricted use, distribution, and reproduction in any
medium, provided the original work is properly cited.
Peer-review history:
The peer review history for this paper can be accessed here:
http://www.sdiarticle4.com/review-history/68683
32You can also read