Italgas Strategic Plan 2018 2024 - 13th June 2018, Milan
←
→
Page content transcription
If your browser does not render page correctly, please read the page content below
Italgas
Strategic Plan
2018 - 2024

13th June 2018, Milan
Speakers

           PAOLO GALLO   ANTONIO PACCIORETTI

                                               2 /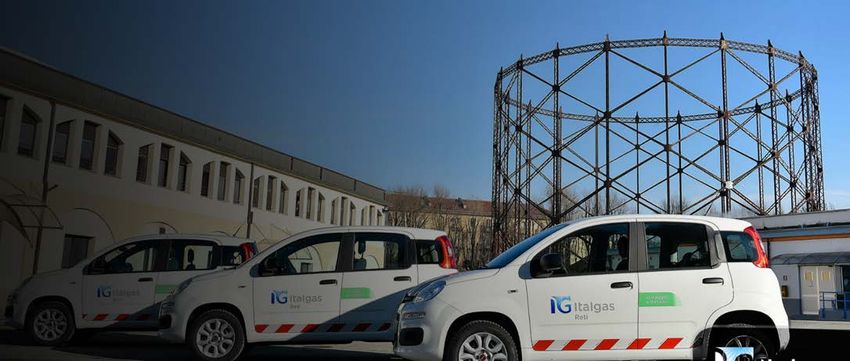
Agenda

         3 /
Agenda

         Strategy     Shareholder
                    Remuneration &
                    Closing Remarks
                                      4 /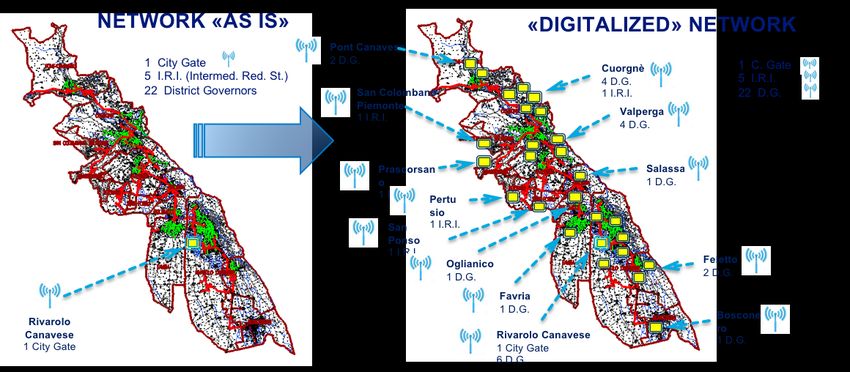
Overall macro scenario

     Policies                                                   Main Impact
   Framework                                                     on DSO
                                    Decarbonization

                                      Renewables
   United Nations                                                  Renewable
       COP 21                                                      integration
                                   Energy efficiency
                                                                Supply flexibility
EUROPEAN GUIDELINES               Sustainable Mobility            and security
 Clean Energy Package
                                                                 Infrastructure
                                      Digitization
                                                                 development
 NATIONAL
 ENERGY                              Power to Gas                Innovation and
 STRATEGY                                                          digitization
                                       Green Gas

    Full impact on gas DSO

               Gas as a flexible source to enable energy transition    5 /
Natural Gas plays a key role in
         Decarbonisation

Paris agreement COP21

Agreed by all UNFCCC Parties in
December 2015                     1
                                      COAL DECOMISSION &
                                      SUBSTITUTION WITH                     Facilitate the
(159 countries covering 90% of
                                      ADVANCED CCGT                       implementation
global GHG emissions)                 Natural Gas with 2.3 tons of CO2
                                      emitted per toe has a carbon
                                                                           of an effective
Due to enter in force in 2020         dioxide emission rate 41% lower    and economically
                                      than that of coal
                                                                         sustainable path
             80%                  2                                           towards
                                      POWER TO GAS
             cut in                                                       decarbonization
         GHG by 2050,
          from 1990
             levels               3   RENEWABLE GAS (BIOMETHANE)

                                                                            6 /
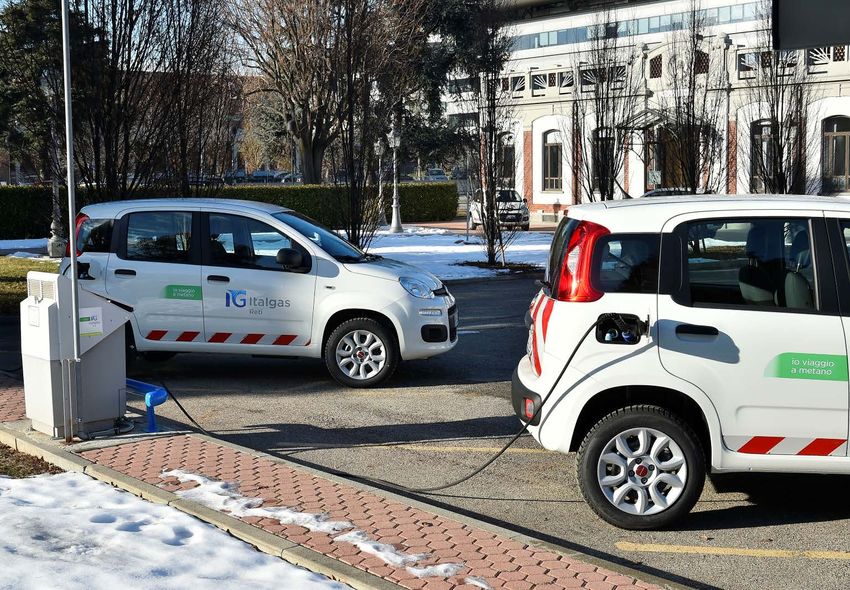
Sustainable Mobility

 Italgas is the first company in Italy to
   own a fully methane vehicle fleet
The new fleet will enable costs reduction
    and limit environmental impact

                                            7 /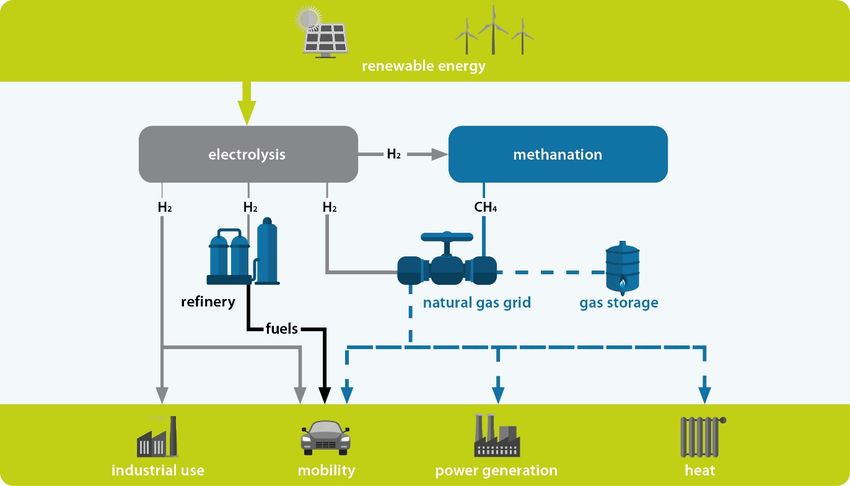
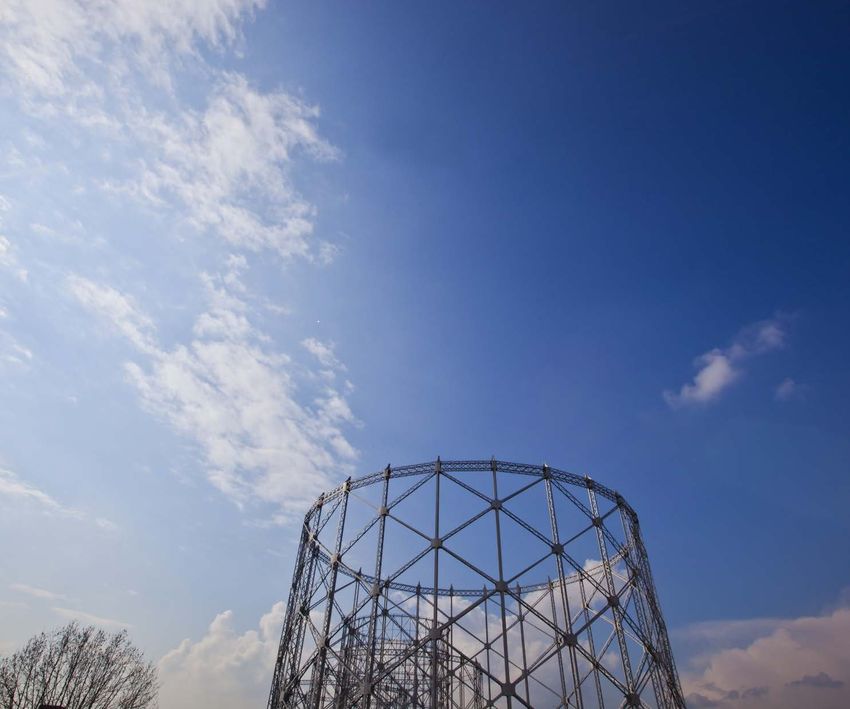
Power to Gas

               Allows
               transformation
               of surplus
               supplies of
               electricity from
               wind and solar
               sources into
               synthesized gas

                    8 /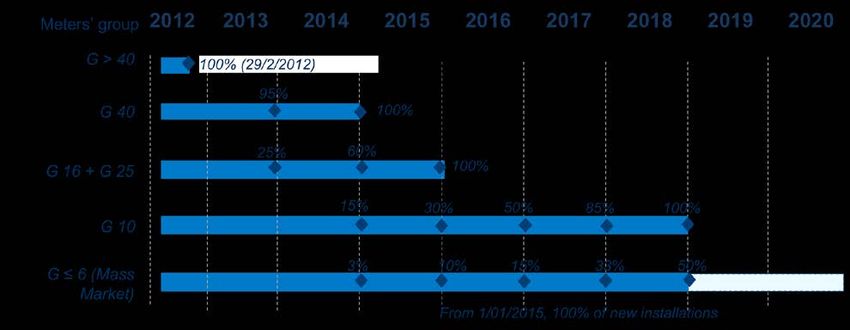
Renewable Gas enabling circular economy in
            energy sector

BIOMETHANE offers a valuable option for the
recovery of by-products                                                                 organic waste

Combined with the already existing gas
transport and distribution infrastructure,                                                                                       biogas
biomethane can make a decisive contribution to
the development of a circular economy.

In Europe, it is estimated that renewable gas
(hydrogen and biomethane), can reach an                                         biomethane
annual production higher than 120 billion cubic
meters resulting in savings of around 140 billion
euros*.

                                                                                                                    gas purification

* Source:   Gas4Climate Consortium, composed of Snam, Enagás, Fluxys, Gasunie, GRTgaz, Open Grid Europe and TIGF.
                                                                                                                           9 /
Italian gas demand outlook

Bcm
                                         75
      75
              70                  71                                                                                                     ~ 80
                           68
                    62
                                                                                                                                         ~ 60

      31 31 26 29 29 30
      2012

             2013

                    2014

                           2015

                                  2016

                                         2017

                                                2018

                                                       2019

                                                                2020

                                                                       2021

                                                                              2022

                                                                                     2023

                                                                                            2024

                                                                                                   2025

                                                                                                          2026

                                                                                                                 2027

                                                                                                                        2028

                                                                                                                               2029

                                                                                                                                      2030
             Distribution                                     Industrial                                    Power gen
             Transport (CNG+LNG)                              Other sectors                                 High scenario
             Low scenario                                     Residential outlook

              Natural gas: a key role in the long term
                         energy scenario                                                                                               10 /
The National
Energy Strategy
(SEN)
Sustainable growth Country Supply flexibility &
↑ RES competitiveness security
↑ energy efficiency and ↓ gas price gap with EU Supply diversification
review of TEE system ↓ electricity price gap Network upgrade
Acceleration of with EU LNG infrastructure
decarbonisation Completion of energy development
Public financing to sustain markets liberalization Sardinia methanization
clean energy R&D and SECA pilot project
11 /SEN on Sardinia methanization
Project ~€1.4 bn total investment to develop Main infrastructure
rationale infrastructure projects
Low pollutant source SSLNG regasification
enabling regional energy 58% plants for gas supply
transition (~€400mln)
Reduction of GHG in Transportation network
maritime transportation, ~ 500 Mcm and connection to
Gas SSLNG sites and
where Med Sea is included LNG
consumption
in SECA distribution grid
potential 9% (~€1bn)
Replacement of coal phase
out by 2025 – 2030 and 25% 8% CCGT for electricity
support to bio-methane production
development Res&Comm Industry&Power Gen
Transportation Other
Development of
favourable industrial and
work environment
Natural gas is key for Sardinia energy transition
12 /Leader in a fragmented market ...
Current market share in Italy
…by re-delivery points …by gas volume distributed …by network
ITALGAS 30.5% 3.9% 34.4% ITALGAS 23.8% 3.4% 27.2% ITALGAS 21.9% 3.0% 24.9%
2I RETE GAS 2I RETE GAS 18.1% 2I RETE GAS 24.0%
19.9%
INRETE DISTR. ENERGIA-HERA INRETE DISTR. ENERGIA-HERA 9.5% INRETE DISTR. ENERGIA-HERA 7.5%
7.8%
UNARETI-A2A UNARETI-A2A 7.9% UNARETI-A2A 4.2%
7.1%
IRETI-IREN 4.3% IRETI-IREN 2.9%
IRETI-IREN 4.2%
AP RETI GAS-ASCOPIAVE 2.6% AP RETI GAS-ASCOPIAVE 2.6%
AP RETI GAS-ASCOPIAVE 1.8%
CENTRIA 1.8% CENTRIA 1.9%
CENTRIA 1.8%
EROGASMET 1.3% EROGASMET 1.2%
EROGASMET 1.2%
Other 27.3% Other
Other 21.9% 30.8%
Italgas consolidated Toscana Energia & affiliates
Source: ARERA 2017 * Includes Gas Natural assets
13 /... with consolidation gathering pace
Streamlining of Italian operators Scale is key in the ongoing consolidation
process
Numbers of operators
Numbers of operators (2016) Gas volumes (2016)
730 Very large Small Very small
3% Large 10% 1%
10%
Medium
Very small Medium 7% Very large
27% 10%
430 Large 63%
Low double- 19%
digit Small
220 50%
Total = 220 Total = 30,944 mcm
Very Large(>500k clients) Large (>100k clients) Medium (>50k clients)
2000 2005 2016 >2020E Small (>5k clients) Very small (Tenders
Calendar
Total market awarded tenders (177 ATEMs)
80 180
70 160
140
60
120
50
100
40
80
30
60
20
40
10 20
- -
2017 2018 2019 2020 2021 2022 2023
2016-2020 Plan 2017-2023 Plan 2018-2024 Plan Cumulated awards
Italgas estimate
15 /Underpinned by a stable
regulatory environment
Metering
2014 2015 2016 2017 2018 20 2020 2021 2022
Regulatory WACC 6.1% 6.6%
19
IV Regulatory Period
(parameter set: beta, xfactor,
reference opex)
WACC Period
(parameters set: risk free rate,
country risk premium, inflation,
gearing, cost of debt, tax rate)
3 year updates of CAPM parameters
Parameters subject to potential changes
In the period 2018 – 2024 we expect
WACC to remain at current level 16 /Agenda
Scenario Shareholder
Remuneration &
Closing Remarks
17 /Sustainability: moving from strategy to action
UN Sustainable Italgas Sustainability Plan
Developments Goals 2018-2024
The 17 Sustainable Development Goals (SDGs) are contained in Italgas sustainability strategy is driven by nine of these
the 2030 Agenda for Sustainable Development. SDG’s.
They represent the United Nation’s global plan of action for The Sustainability Plan contains actions to both assure
the undermining of poverty, the protection of the planet and Italgas sustainability and contribute to UN goals
the guaranteeing of prosperity for all. achievement.
18 /Italgas Sustainability Plan underpins
company strategy
We are driven by: We want to:
1. Increase Italgas visibility on
1. COMMITTMENT TO SUSTAINABILITY sustainability issues
Involvement, accountability and communication 2. Develop the culture of sustainability
3. Strengthen key process
2. PUTTING PEOPLE FIRST 4. Protect and enhance know-how
Prepare our people to success in emerging 5. Strengthen corporate welfare
industrial challenges 6. Promote women occupation in the company
7. Improve safety at work
3. STRONG LOCAL PRESENCE 8. Improve relations and involvement with
Pursue an active role in the social innovation territories
process of cities and communities 9. Invest in communities through
measurable social innovation
4. VALUE FOR MARKET AND CLIENTS 10. Harmonize process with sales companies
Reshaping contents and communication with 11. Improve end customers’ relation
users
5. ENERGY EFFICIENCY AND 12. Improve efficiency and reduce our
ENVIRONMENT carbon footprint
The key role of gas in decarbonization process 13. Develop the gas advocacy
of society 14. Enable circular economy process
19 /Strategic pillars
1. Network development
Development, Maintenance and Upgrade
2. M&A and market opportunities
Sustainability
Anticipation of growth and improve portfolio quality and value
3. Technical innovation & digitization
Technical innovation and digitization of assets, processes and workforce
4. Operational efficiencies
Continuous efficiency actions
5. Gas tenders
Highly qualified to reach 40% market share
6. Solid and efficient financial structure
€ Outstanding cost of debt and financial flexibility to support growth
7. Shareholder returns
Robust and sustainable shareholder returns
20 /Investment Plan without Tenders
Strategic priorities – Organic growth
Organic CAPEX key figures
~4.0 Bn€ Capex
2018-2024
Network Metering Digitization Centralized Sardinia and M&A
Assets
Sardinia
0.45
2.00 0.53 0.31 0.32 Bn€
Capex
Bn€ Bn€ Bn€ Bn€ Acquisition
M&A
0.42
~3.2 B€ related to 2017 base perimeter Bn€
21 /Image Placeholder
RAB evolution without Tenders
Consolidated RAB*
2017-2024
CAGR 2017-24 A significant
~3.2%
€bn capex plan and
~7.3 selected M&A
driving a robust
5.85
RAB growth
2017E Capex Grants, Allowed Inflation M&A 2024E
disposal, etc depreciations
* Continuity of regulatory treatment assumed for grants cumulated at 2017 year end; average deflator in the plan period assumed at 1.4%
22 /1. Network capex
Grey cast iron pipelines with hemp & lead joints (by 2019)
Grey cast iron pipelines with mechanical joints (by 2025)
1. Replacement and
Part of fully depreciated pipelines
upgrade Unprotected steel pipes
Replacement related to emergency interventions
Replacement of risers and plants
2. LPG network conversion
2.0 3. Network extension Development of services to meet demand for new
Bn€ & new connections connections
4. Energy efficiency Turboexpander and cogen plants
5. Sustainability Reduction of energy consumption and GHG emissions
6. Tenders already awarded Capex related to commitments of tenders
23 /1. Metering and digitization capex
Smart meters rollout Outperformance of ARERA targets for
0.5 (G4-G6) mass market meters’ replacements (set
by Res. 554/15 at 50% by 2018)
Bn€ Completion of mass market meters
replacements by H1 2020
1. Asset digitization Gas network
Water network (smart meters and
sensors)
0.3
Bn€
2. Digital Factory Multiple parallel digital rooms
producing continuous innovative
output
24 /2. Pursue
Pursue Market opportunities
opportunities to strengthen
to strengthen market
market
positioning, portfolioquality
position, portfolio quality and support growth
and growth
Affiliates
M&A consolidation
A D
Acquisition of third party Italgas Full consolidation
assets, appealing in size of affiliates
or/and geographical
positioning
B C
SARDINIA
Energy
Acquisition of assets in Efficiency
Sardinia and contribution to
the methanization of the Develop Energy efficiency
Region business
25 /2. Already completed
bolt-on acquisitions fueling
RAB growth
Spending* RAB**
(EV) ~ € 120
~ € 150 mn
mn
Full
Existing
potential
PDR
PDR
70K
~ 250K Portopalo
* Of which Seaside ~ € 9mn and ~ € 4mn for Medea retail
** Includes Net Assets value of LPG networks under construction 26 /2. M&A opportunities
2017-2018 RdP ~180k 2019 RdP ~70k Opportunities are
currently
Enerco 30k RdP Other Other under evaluation
M&A M&A to acquire additional
Amalfitana 22k RdP
CPL (new grid) 1k RdP + RdP ~110k
RAB ~ €170mn
+ RdP ~70k
RAB ~ €100mn
180k RdP
by the end of 2019
Medea 13k RdP
Sardinia and M&A
Ichnusa 2k RdP Sardinia
0.45
70k RdP
Bn€
Capex
Acquisition
M&A
Spending ~ € 150mn Spending ~ € 250mn 0.42
Bn€
Completed in 2017 and 1H 2018 27 /2. Sardinia
Sardinia – a strategic
– Italgas gaining arole
strategic role
Today Tomorrow
Potential market
Medea Ichnusa Gas: # clients 13.000 ~180.000
(Sassari) 10 concessions under
Concession construction
in operation
1.500
Network km 400 FULLY DIGITALIZED
Ichnusa Gas:
2 concessions in
operation
LPG / LPG air
Concessions Natural Gas
Until natural gas is not
in operation available in Sardinia
Fuel
0.45 LNG Until natural gas is not
Under available in Sardinia
Bn€
construction n.a.
Natural Gas
Capex Once natural gas supply is available in
Acquisition Sardinia
28 /2. Energy Efficiency
History Development path
2018-2024
Growth in
1 TEE
Italgas
2018, 13th March
Italgas acquires 100% Seaside
2 Captive projects on Italgas
Focus on
2016-2017 4.0 industry
Positioning on innovation Strategic partnerships 3 Energy efficiency and innovation
ISV Microsoft qualification
2014 July Price Responsible Innovators
ISO 9001
UNI CEI 11352: 2014 Reference for large industries 4 Other strategic options
Digital division and Savemixer
2012 May service set up
MBO
Technical unit set up
Services for Ind&Comm sectors
2010, 1st March
Seaside start-up EPC financial structuring and tech. DD
29 /3. The digital transformation program
Asset Process (staff&ops) Workforce
digitization digitization digitization
Metering
0.53
Digitization
areas
Bn€
Digitization
Industrial IoT Advanced Analytics / Mixed Reality
Advanced Analytics Machine Learning Wearables
/ Big Data Bots / Digital Assistants 0.31
Bots / Digital Bn€
Blockchain Assistants
Transformation
steps
1 IT Architecture evolution to Cloud-based model
2 Digital Factory
30 /3. Digitization of assets – Smart Meters
SMART METERS’ ROLL-OUT PLAN - ARERA target
For DSO with > 200k final customers
Italgas is
outperforming
ARERA target by
year end 2018
58
(1)
%
By 2020 all the active and accessible meters will be renewed2
After 2020 is assumed a progressive recovery of non accessible meters
(in addition to new installations)
(1) % replacements are referred to the entire meters in place, including not accessible and not active.
(2) Based on the assumption that regulation will evolve towards a suitable tariff contribution for meters’ replacement. 31 /3. Benefits of Smart Meters
Gas DSO manages the meter The Sale Company invoices gas consumption to
and collects data on gas consumption final customers
Benefits for the system
DSO Sale company Customer
1. Technological upgrade of Smart Meters 1. More reliable gas invoicing and 1. Invoicing based on effective gas consumption
and information system reduction of customers’ claims 2. Improved energy efficiency thanks to higher
2. Remote control of meter operation and 2. Simplification of the process to awareness of self consumption
consumption level switch gas supplier 3. Real time information on consumption
3. Improved metering performances and 3. Commercial offers targeted on 4. Integration with innovative services
remote reading of inaccessible meters customers’ consumption 5. Reduction of reasons for claims
4. Possible remote closure of supply 4. Improved protection from credit 6. Simplification of the process to switch gas
5. Customers’ claims reduction risk (remote closure of supply) supplier or contract holder
6. Optimized planning of grid
interventions thanks to improved
awareness of consumptions
32 /3. Digitization of assets – Gas distribution grid
Smart meters, pressure and flow monitoring, digitalized GRF,
valves and sensors to digitalize the gas grid
(p > 12 bar) I.P.R.M.
(5 < p ≤12 bar) LARGE
GN INDUSTRIAL
Real time monitoring USER
Big data analysis (0.5 < p ≤ 5 bar)
INDUSTRIAL
I.R.I. USER
Alarm management RESIDENTIAL,
COMMERCIAL
(0.04 < p ≤ 0.5 bar)
End point
AND PUBLIC
Predictive SERVICES USES
Pressure
monitoring
Sensors throughout the network
maintenance Valves G.R.F. 100% smart meters
(p ≤ 0.04 bar)
Processes and SMALL
RESIDENTIAL,
resources AND PUBLIC
SERVICES USES
optimization G.R.F.
Flow rate
monitoring
33 /3. Digitization of assets – Gas distribution grid
2018-2019 Plan Period
42 pilot Digitization extended
projects to the entire gas grid
34 /3. Digital program deployment
PLAN PERIOD
MIGRATION TO CLOUD OF
SEPARATION OF ITALGAS IT MAP RATIONALIZATION
IT APPLICATIVE MAP MIGRATION TO PaaS/SaaS
APPLICATIONS IN «GREEN
DATA CENTER» DIGITAL
FACTORY
Transition to cloud is the first digitization step
Digital Factory is set up from 4Q 2018
35 /3. Digital program deployment
IT Architecture 2018 2019 2020 2021 2022
evolution
to
Cloud-based
IaaS, PaaS, SaaS
model
Success Factor
Cloud New IoT New Enterprise
platform New Analytics / Big Content
Office 365 Salesforce
Mixed Reality Data / Machine Management
Salesforce CC CRM
platform Learning Platform Platform
New
New Procurement
Cartographic
platform
system
36 /3. The Digital Factory
Multifunctional
team Time and
budget-boxed
Design Thinking
Digital skills methodology
development
Prototypes and
Results
Minimum Viable
measurement
Product (MVP)
Agile
4.0 technologies methodology
37 /4. Operational Efficiency
Workforce ICT
Organization of workforce to Innovation technology
Public Cloud strategy
realign with standard
Network digitization
requirements
Improvement of skills mix Smart meters
Operational process Reducing telecoms cost
Increasing productivity through best associated to reading activity
practices Technology innovation
Leveraging on «make or buy» mix Network digitization
Optimizing vehicle fleet
Facility
Asset management Utilities cost reduction
Optimization of smart meters supply
Corporate reorganization
and installation cost
Group Distribution activities
New contractual strategy for
integrated in Italgas Reti
network maintenance and expansion
Affiliates ownership
concentrated in Italgas
…. and ….
Continuous Improvement Program “on line”
Already exploited in 2017
38 /4. Leveraging
Leveraging ”Make or Buy
”Make Mix”Mix”
or Buy
GOAL AND IDENTIFICATION & ALLOCATION RECOURSE TO
HR PLANNING
HR REQUIREMENTS OF ACTIVITIES TO HR EXTERNAL MARKET
Definition of HR requirements of With respect to the present situation: Allocation of activities to internal HR Recourse to external market for
the Operation Area activities exceeding internal HR
HR exits, taking into Activities are allocated based on capacity
account estimated prioritization drivers (Make or Buy
Criteria retirements strategy): Externalization of low added value
Internally manage at least 90% of Continuity and frequency of activities
Emergency Response Unit activities
activities
Technicians competencies and
know-how
Headcounts per age Cost and activity added value
New entries in order to cover
organizational requirements
and competence skills
Improve efficiency and quality of service
39 /4. On going restructuring
Consolidated perimeter – structure as of 31/5/2018 Consolidated perimeter – future structure
Toscana Energia
Metano S. Angelo
Lod.
100%
100% 48% CPL new grids Umbria
Acam Gas Toscana Energia Distribuzione
100% 100%
Medea
Enerco
100% 50%
Ichnusa Metano S. Angelo Lod.
100% 1. Integration of distribution activities into Italgas Reti
New grids
(ex CPL) Merging of Napoletanagas, Acam Gas and Enerco.
100% 45% Corporate simplification once networks enter operations
Medea Umbria Distribuzione
2. Affiliates
Transfer of affiliates’ ownership from ITG Reti to ITG SpA
3. Water and energy efficiency
Dedicated entities for activities in the water and energy efficiency sectors
Fully consolidation method
Equity method
To improve efficiency and business value 40 /4. Vehicle fleet optimization
2500
1500
500
JAN MAR JUN SEP DEC 1Q
2018 2019
ITG OWNED ITG RENTAL CNG
VEHICLES VEHICLES
Italgas is the first company in
Italy to own a fully methane
vehicle fleet
Fuel CO2 Particulate*
Cost* emission* (PM10, PM2,…)
-50% teq -20% -98%
vs 2017 vs 2017 vs 2017
* Assuming 100% CNG vehicle fleet 41 /4. Procurement strategy
Network Smart Warehouse ICT Initiatives
Initiatives Metering
New contractual strategy Optimization on smart Warehouse Telco optimization cost
on network maintenance meter installation costs and logistic IT device (PC /Ipad)
works and network optimization
Smart meter supply with optmization cost by
extensions cost
full guarantee introducing lease
Leak detection supply contract
optimization
Enhanced cost control
and quality improvement
42 /4. Distribution activities: Opex
€mn 2016-2017
Base line reshaped one year ahead of target
417
~15%
348
TARGET 2018-2024
Outperform
regulatory efficiency
parameters
2016 2017 2024
Concession fees External costs Labour costs Other Activities
and M&A
43 /5. Criteria to select target ATEMs
ATEM profitability
Italgas market Operator Operator type Geographical
share fragmentation Main competitors’ contiguity
Italgas PdR over Number of DSOs market share (national Italgas presence in
ATEM PdR operating in the ATEM and regional level) neighboring ATEMs
and type
44 /5. Tenders clusters
~40 ATEM ~50 ATEM
(85% Italgas market share on (25% Italgas market share on
average) average)
Very attractive Medium Low to zero
tenders attractive tenders attractive tenders
Return
Target return
Illustrative 177 ATEMs
6.2 5.2 8.9 7.3
5.4 4.7 5.2 4.1
1.2 0.9 0.3 0.3
PDR (#Mn) RAB (€bn) PDR (#Mn) RAB (€bn) PDR (#Mn) RAB (€bn)
Italgas Overall
45 /5. Tenders: an additional growth opportunity for
profitable growth
Redelivery points(1)
Tenders
capital deployment opportunities
CAGR 2017-24
~4% ~8.5 m
~7.1 m
6.6 m
ORGANIC AND M&A TENDERS
1.1 0.5
€bn €bn
30% ~33% ~40% Net capital to be Capex within 2024
deployed induced by tenders
in tenders (2)
2017 2024 2024
Market Share (1)
(1) Excluding affiliates and considering active redelivery points
(2) Net of redemption value of asset transferred to other operators in the tender process and assuming RV=RAB 46 /Image Placeholder
5. RAB evolution with tenders
(2018 – 2024)
Consolidated RAB*
2017-2024 1.6
Investment Plan
CAGR 2017-24
€bn ~5.3% 5.6 (no tenders)
€bn Tenders (and
>8.0 relevant capex)
~7.3 4.0
Tenders represent an
5.85
additional capital
deployment
opportunity
2017E Capex Grants, Allowed Inflation M&A 2024E Tenders 2024E
disposal, etc depreciations
* Continuity of regulatory treatment assumed for grants cumulated at 2017 year end; average deflator in the plan period assumed at 1.4%
47 /6. Main pillars of financial strategy to support…
Generate strong and resilient cash
flow to cover organic capex and
dividends FFO/RAB ~ 10%*
Preserve a solid investment grade
rating Baa1 Moody’s & BBB+ Fitch
A solid and
efficient Maintain a safe liquidity profile in > €1 bn undrawn committed
the medium term credit lines
financial
structure Outstanding cost of debt over the From current 1.1% to 1.4% at
plan period the end of the plan period
Current fixed rate debt portion to
protect financial outperformance in ~ 88% fixed rate
the medium term
Limited refinancing risk No refinancing needs until 2022
* Stable at ~ 10% over the plan period
48 /6. ...self financing of organic growth, M&A and shareholder
remuneration… leaving flexibility for tender opportunities
Cumulative amounts for the full business plan*
Operating cash flow covers
Organic
Capex
capex – including M&A – and
OCF
dividends
Dividends Financial flexibility allows to
M&A capture tenders’ opportunities
and/or enhance shareholder
Financial
Preserve
flexibility
Tenders remuneration
current Enhance
credit shareholders
remuneration
rating
* Measurement of the chart for Illustrative purpose
49 /6. Key credit metrics
Resilient cash flow generation
and strong credit metrics
Net Debt / RAB*
20%
FFO / Net Debt
90%
85%
80%
15%
75%
70%
65% 10%
60%
55%
5%
50%
45%
40% 0%
2018 2019 2020 2021 2022 2023 2024 2018 2019 2020 2021 2022 2023 2024
M&A and Sardinia anticipate capital deployment in the first Robust and resilient cash flow generation
part of the plan period Sound credit profile well positioned in a solid
Well balanced capex profile to optimize cash-flow investment grade area
Adequate financial structure even in a growing scenario
* Consolidated RAB including LPG assets and Equity RAB of affiliates 50 /6. A solid, efficient and resilient debt structure
Italgas Net Debt Structure
As of March 31st, 2018
4.8 € bn
Total Committed
Credit Facilities and Bonds
Limited refinancing risks thanks Fixed Floating
to maturities profile ratio
RCF 1.1€ bn
800
12%
700
21% 600
500
3.7 400
€ bn
300
200
3.7 88%
79%
100 € bn
0
Fixed Floating
Bond
Institutional Lenders
Financing (EIB)
51 /2018 Guidance and expected plan evolution
2024 OUTLOOK
2018
with tenders
Revenues ~1.2 €Bn
Ebitda 810 – 830 €mn Consolidated EBITDA ~1.1 €Bn
EBIT/RAB >7 %
Cumulated Investments 2018-2024 5.6 €Bn
Capex >500 €mn
M&A ~200 €mn
Consolidated RAB* ~8.4 €Bn
Consolidated ~6.2 €Bn
RAB*
Leverage** ~63 %
LeverageAgenda
Scenario Strategy
53 /Multiple-levers to deliver value
through 2024
€ 4Bn Investment Plan (Capex and M&A)
to support significant RAB growth
Digital Factory, network digitization to
consolidate market leadership
Tenders as an additional capital
deployment opportunity
Underpinned by solid balance sheet with
superior cost of capital
54 /Robust and sustainable shareholder
remuneration with significant upside
Strategic Plan Strategic Plan
2017-2023 2018-2024
Highest between:
DPS 2017 +4% p.a.
DPS equal to 60% of
consolidated net income
+4%
yearly
0.20
0.208
FY2016 FY2017 FY2018 FY2019 DPS (€)
FY2017 FY2018 FY2019 FY2020
55 /Q&A
56 /Disclaimer
Italgas’s Manager, Giovanni Mercante, in his position as manager responsible for the preparation of financial reports, certifies pursuant to paragraph 2,
article 154-bis of the Legislative Decree n. 58/1998, that data and information disclosures herewith set forth correspond to the company’s evidence and
accounting books and entries.
This presentation contains forward-looking statements regarding future events and the future results of Italgas that are based on current expectations,
estimates, forecasts, and projections about the industries in which Italgas operates and the beliefs and assumptions of the management of Italgas.
In particular, among other statements, certain statements with regard to management objectives, trends in results of operations, margins, costs, return on
equity, risk management are forward-looking in nature.
Words such as ‘expects’, ‘anticipates’, ‘targets’, ‘goals’, ‘projects’, ‘intends’, ‘plans’, ‘believes’, ‘seeks’, ‘estimates’, variations of such words, and similar
expressions are intended to identify such forward-looking statements.
These forward-looking statements are only predictions and are subject to risks, uncertainties, and assumptions that are difficult to predict because they
relate to events and depend on circumstances that will occur in the future.
Therefore, Italgas’s actual results may differ materially and adversely from those expressed or implied in any forward-looking statements. Factors that
might cause or contribute to such differences include, but are not limited to, economic conditions globally, political, economic and regulatory
developments in Italy and internationally.
Any forward-looking statements made by or on behalf of Italgas speak only as of the date they are made. Italgas does not undertake to update forward-
looking statements to reflect any changes in Italgas’s expectations with regard thereto or any changes in events, conditions or circumstances on which any
such statement is based.
The reader should, however, consult any further disclosures Italgas may make in documents it files with the Italian Securities and Exchange Commission
and with the Italian Stock Exchange.
57 /Italgas Strategic Plan 2018 - 2024 13th June 2018, Milan
You can also read