Race-Level Reporting of Incidents during Two Seasons (2015/16 to 2016/17) of Harness Racing in New Zealand
←
→
Page content transcription
If your browser does not render page correctly, please read the page content below
animals
Article
Race-Level Reporting of Incidents during Two Seasons (2015/16
to 2016/17) of Harness Racing in New Zealand
Michaela J. Gibson                 , Fernando J. Roca Fraga, Charlotte F. Bolwell             , Erica K. Gee        and Chris W. Rogers *

                                          School of Veterinary Sciences, Massey University, Palmerston North 4442, New Zealand;
                                          m.gibson@massey.ac.nz (M.J.G.); f.roca@massey.ac.nz (F.J.R.F.); c.bolwell@massey.ac.nz (C.F.B.);
                                          e.k.gee@massey.ac.nz (E.K.G.)
                                          * Correspondence: c.w.rogers@massey.ac.nz

                                          Simple Summary: The objective of this study was to describe the incident reporting of harness racing
                                          in New Zealand. Retrospective stipendiary stewards’ reports of race day events during the 2015/16
                                          to 2016/17 racing season were examined to describe the reasons and outcomes for race day veterinary
                                          examinations of Standardbred horses in New Zealand. The primary reason for examination of horses
                                          after a race was due to poor performance. Poor performance was considered if a horse’s performance
                                          in the race was lower than its previous race, or lower than expected as reflected by the odds at the
                                          tote (reflecting the amount of money placed/gambled on the horse via the official betting agency).
                                          The lack of fatalities and injuries reported indicates a low risk profile in harness racing and highlights
                                          the stewards’ role in maintaining racing integrity and animal welfare.

                                          Abstract: The objective of this study was to describe the incident and non-incident reporting of
                                          harness racing in New Zealand, the primary injury and reporting outcomes, and to examine horse-
                                          and race-level variables associated with the odds of these outcomes. Retrospective stipendiary

                                   stewards’ reports of race day events during the 2015/16 to 2016/17 racing seasons were examined.
Citation: Gibson, M.J.; Roca Fraga,
                                          The number of incident and non-incident events and binomial exact 95% confidence intervals (CI)
F.J.; Bolwell, C.F.; Gee, E.K.; Rogers,   were calculated per 1000 horse starts. Most reports were for non-incidents and an examination was
C.W. Race-Level Reporting of              requested for poor performance (11.06 per 1000 starts (95% CI = 10.23–11.89). Races with more
Incidents during Two Seasons              than eight participants were 1.9 (95% CI = 1.13–3.4) times more likely to have an incident than
(2015/16 to 2016/17) of Harness           races with eight or less participants. The low incidence of significant injuries such as fractures (0.13
Racing in New Zealand. Animals            per 1000 starts (95% CI = 0.03–0.23) reflects the lower risk of injury in harness racing compared to
2022, 12, 433. https://doi.org/           Thoroughbred racing. The high incidence of poor performance reports highlights the steward’s role
10.3390/ani12040433
                                          in maintaining animal welfare to a high standard.
Academic Editor: Sue M. McDonnell
                                          Keywords: harness racing; incident; non-incident; steward; stipendiary report; injury; poor
Received: 19 January 2022
                                          performance; equine welfare
Accepted: 10 February 2022
Published: 11 February 2022

Publisher’s Note: MDPI stays neutral
with regard to jurisdictional claims in   1. Introduction
published maps and institutional affil-
                                               While smaller in participation numbers and betting turnover than Thoroughbred
iations.
                                          racing, harness racing represents a significant racing industry and has received considerably
                                          less attention in the scientific literature than Thoroughbred racing. Harness racing is
                                          conducted using Standardbred horses that race at either a trotting or pacing speed whilst
Copyright: © 2022 by the authors.
                                          drawing a two-wheeled cart called a sulky [1]. Within New Zealand, the structure of the
Licensee MDPI, Basel, Switzerland.        harness racing industry and Standardbred breeding industry have been described [2,3].
This article is an open access article    There are limited data on the training of standardbreds internationally, [4] or from within
distributed under the terms and           New Zealand [5], and little information on injuries and injuries associated with racing
conditions of the Creative Commons        events [6]. This trend is also observed in the international literature with limited data on
Attribution (CC BY) license (https://     racing related injuries in standardbred harness racing [4,7].
creativecommons.org/licenses/by/               Within the regulatory process of racing, most jurisdictions utilize a process of stipendi-
4.0/).                                    ary steward reporting and veterinary reports. These reports are routinely collected during

Animals 2022, 12, 433. https://doi.org/10.3390/ani12040433                                                     https://www.mdpi.com/journal/animals
Animals 2022, 12, 433 2 of 10
race meetings and are published as part of the transparency of racing integrity [7]. Reports
are identified as either a non-incident or an incident report. Non-incident reports occur
when there has been no identifiable “event” during a race, and routine screening of horses
is required as part of the ongoing regulatory and integrity process. The screening requests
often focus on a horse or horses that may not have performed up to expectations, or if a
horse’s health is questioned (e.g., suspected epistaxis). An incident report is the result of an
“event” before or during a race (such as a horse collision, stumble, fall or the horse “breaks
its stride”) that requires a horse to be examined. Both reports involve an assessment from
the designated veterinarian(s) on duty for the race meeting.
Stipendiary stewards’ reports provide an indication of the robustness of the regulatory
process and the screening of horses during a race meeting [7]. When combined with race
data, this information provides the opportunity to describe the incidence of injuries (from
mild lacerations to catastrophic injury) and the odds of these events, or outcomes, with
different horse and environment level variables. The collection of such data is important
for the monitoring of industry practice and to optimize horse welfare. Such data permit
evidence-based changes to be made to management and the structure of racing to meet the
industry’s duty of care to the horse racing in it. External to these is the obligation of the
industry to minimize injury and loss to meet its social license to operate [8].
To date, most of the publications describing race day events from stipendiary stewards
or race day veterinary events have examined the Thoroughbred racing industry. Interna-
tional and domestic data have suggested that potential risk factors for race day injury in
Thoroughbred racing include track surface, track condition, race distance, race class, age
of horse, training intensity, and number of starters [9–11]. Within harness racing, Physick-
Sheard, Avison, and Sears [4] identified that sex, age, track class, performance history,
and workload affect the likelihood of horse mortality on race day. However, they did not
examine non-fatal injuries. Australian studies of harness racing steward reports have been
carried out to look at the incidence of injuries, mortality, and reasons for poor performance
providing a benchmark to assess ongoing improvements in welfare [7]. Lameness was the
most common finding in post-race examinations with 2.1 cases per 1000 starts, followed by
poor performance/heat stress with 2.04 cases per 1000 starts.
To monitor changes in New Zealand harness racing welfare over time, the prevalence
of the current incident and non-incident reporting needs to be measured. Therefore, the
objective of this study was to describe the incident and non-incident reporting during the
2015/2016 and 2016/2017 harness racing seasons in New Zealand, the primary injury and
reporting outcomes, and to examine horse- and race-level variables associated with the rate
of the reporting of these outcomes.
2. Materials and Methods
Data were obtained of all race starts during the 2015/16–2016/17 racing season as
an excel spreadsheet from Harness Racing New Zealand, the official registration body
for Harness racing in New Zealand. An Excel spreadsheet of all stipendiary steward
reports for the same racing seasons were obtained from the Racing Integrity Unity, the
official racing compliance organization for all three racing codes within New Zealand. Each
stipendiary steward report recorded the date, racecourse, race number, horse name, and
other information relevant to the incident reported such as the reason for the requested
report and the findings of the veterinary examination. To obtain information about racing
surface (grass and all-weather) and condition (fast, good, dead, slow, heavy, easy, and
slushy), race type and pace, horse age, and other relevant track and horse information,
stipendiary steward reports were cross-referenced with the official race start records and
results from the same period.
Statistical Analysis
Data were exported to RStudio (version 3.5. 1, 2018; R Foundation for Statistical Com-
puting, Vienna, Austria) for manipulation and analysis. After merging of the two datasets,Animals 2022, 12, 433 3 of 10
data were cross validated using the horse’s official race name as the unique identifier.
Apparent errors or inconsistencies in data (i.e., misspelt horses names) were then checked
manually against the official formal transcript of the relevant stipendiary stewards’ report
hosted and archived on the Harness Racing New Zealand website. Horses that did not race,
or steward reports that were miscategorized (thoroughbred reports), were removed from
the dataset. Six records were excluded due to mis-entered values with data that prevented
linkage between the two databases. There were 87 reports that recorded an event occurring
prior to the beginning of the race meeting that resulted in horses being withdrawn from
the race meeting. Using the official descriptors provided within the datasheets, reports
were coded for analysis as incident and non-incident reports. Non-incident reports occur
when there has been no identifiable “event” during a race, and routine screening of horses
is required as part of the ongoing regulatory and integrity process. An incident report is
the result of an “event” before or during a race (such as a horse collision, trip or fall) that
requires a horse to be examined. Both reports involve an assessment from the designated
veterinarian(s) on duty for the race meeting. Multiple phrases and spellings (abbreviations)
were used to describe reasons for a horse examination and the outcome findings. These
were manually coded and collapsed down into 14 categories, these being Arrhythmia,
Cardiac failure, Laceration/abrasion, Lame, Musculoskeletal injury (Fracture), Other mus-
culoskeletal (MS) issues, Unknown musculoskeletal pain, no observable abnormalities
detected (NOAD), Poor recovery, Respiratory issues, Previous injury, Bleeders (epistaxis),
Unknown and Miscellaneous.
Track conditions on grass surfaces were defined as fast, good, dead, slow and heavy.
Track conditions on all weather surfaces were defined as fast, good, easy or slushy.
Statistical analysis was conducted using SAS version 9.4 (SAS Institute Inc., Cary, NC,
USA). Descriptive statistics (mean, median and proportion) were used to describe the data
at a season, track, and race level. Incidence rates are described as the number of events per
1000 starts with their 95% confidence intervals (Parkin [9])
Data were tested for normality and if non-parametric, differences between groups were
tested using the Kruskall–Wallis test and reported as median and interquartile range (IQR).
The distribution of stewards’ reports, and the underlining demographics of the industry
and race conditions were initially examined using the Chi-Squared test. Univariable logistic
regression was used to screen variables for association with both incident and non-incident
reporting.
3. Results
3.1. Harness Racing Data
During the 2015/16–2016/17 seasons, 4211 horses had a race start, over half of the
racing population were geldings (53%), followed by mare and fillies (43%), then stallions
and colts (4%). Of these 4211 horses, 3034 (72%) had at least one start in the 2015/16 season
and 2923 (69%) had at least one start in the 2016/17 season. These horses had 54,702 racing
starts, of which 27,819 (50.9%) were during the 2015–2016 season and 26,883 (49.1%) during
the 2016–2017 season. Most of starts were for horses in pacing races (72% of starters and
73% of races). The racing took place at 40 racecourses, 22 of which were grass tracks with
the remainder being all weather tracks. Most starts (n = 44,280 (80.9%)) were on all-weather
surfaces and 10,422 (19.1%) on grass. Of the 44,280 starts on all-weather surfaces, the
majority of the racing surface conditions were described as “fast” (n = 32,678 (73.8%)), the
remaining being described as on a “good” (n = 6574 (14.8%)), “easy” (n = 2375 (5.4%)) or
“slushy” (n = 2653 (6%)). Of the 10,422 starts on grass, surface conditions were described as
“fast” (1255 starts or 12%), “good” (6956 starts or 67%), “dead” (1367 starts 13.1%), “slow”
(712 starts or 6.8%) and “heavy” (132 starts or 1.3%). There was a median race distance of
2200 m (IQR 2000–2600) with 97% (53088/54702) of starts being over 1609 m (1 m). The
median mile rate was 2.04 min (IQR 2.0–2.09) for pacing races and 2.14 min (IQR 2.09–2.20)
for trotting races. Most races were at racetracks located in the southern region (South
Island) (65.6% 3370/5139) followed by the northern region (26.2%, 1346/5139) (Top halfAnimals 2022, 12, 433 4 of 10
of the North Island) with few races in the central region (Bottom half of the North Island)
(8.2%, 423/5139).
There was a median of 11 starters per race (IQR 9–13). The horses participated in
a median of 7 (IQR 3–10) races per season with no difference between the 2015/16 and
2016/17 season for number of starts. Younger horses participated in fewer starts per season,
2-year-olds in a median of 3 (IQR 2–5) starts per year, 3-year-old horses in 6 (IQR 3–10)
starts and 4+yo horses in 9 (IQR 4–15) starts per season (p < 0.001). A detailed description
of the distribution of age and sex is presented in Table 1.
Table 1. Population distribution of horses participating in the 2015/2016 and 2016/2017 New Zealand
harness racing season.
Horses per Season,
Sex Descriptor by Age Category (Number of Horses)
and Starters, by Age Category
Age Entires/
2016/17 2017/18 Starters Colts Fillies Geldings Mares Rig
(Year) Stallions
2 225 230 1536 59 206 188 2
3 713 729 10,025 90 670 680 2
4 790 747 14,831 797 46 691
5 622 560 12,577 671 22 489
6 339 331 7646 400 11 259
7 186 172 4510 230 5 123
8 88 85 2047 122 3 48
9 41 43 936 62 1 21
10 15 10 223 19 6
11 10 7 201 13 4
12 4 6 108 9 1
13 1 2 45 3
14 - 1 17 1
3.2. Stewards Reports
The 1001 records that were included in this study were coded into two categories:
(a) screening due to major events occurring before (from the start of the race meeting),
during and after the race as “incident reports” (n = 131) and (b) screening due to poor
performance or other non-incident concerns, often as part of routine racing integrity screen-
ing, coded as “non-incident reports” (n = 870). Most of the stipendiary stewards’ reports
described events relating to races (96.3%, 964/1001) rather than those occurring either
before the race (2.7%,27/1001), post-race (0.80% 8/1001) or unknown/not described in the
report (0.20%, 2/1001).
There were only nine (0.16 times per 1000 races, 95% CI = −0.08–0.41) musculoskeletal
fractures were reported in the stipendiary stewards’ reports for both seasons.
3.2.1. Incident Reports
An incident report occurred every 2.4 per 1000 starts (95% CI = 2.0–2.8). The distri-
bution of incident reports across race types reflected the underlying racing population
with 77.4% (102/131) associated with pacing races and the remaining 22.6% (29/131) with
trotting races (p < 0.05). There was no association of track surface with the frequency of
incident reports (p = 0.674). Track conditions were reported as fast for 60% of incidents
followed by good (32.1%), easy (2.3%), slushy (3.8%) and slow (0.8%) and dead (0.8%).
There were no incidents on heavy tracks. There was no association of track condition with
the rate of incident reporting (p = 0.353). There was a positive association of field size with
incident reports such that an incident was 1.9 [95% CI = 1.13–3.4, (p < 0.001)] times more
likely to occur in a race with 9 or more participants than in a race with 8 or less participants.
Incident reports reflected the average number of participants per race on each surface.
There were a variety of reasons recorded for the requesting of an incident report with
the largest category being due to a horse falling (0.79/1000 starts [95% CI = 0.66–0.91];Animals 2022, 12, 433 5 of 10
33.0%), primarily during the race (64.3% of falling horses). The major clinical finding for
falling horses was integument lacerations and/or abrasions (52.4%) with the remaining
47.6% having no clinical finding. Only 8.8% of horses reported in incident reports (0.13 per
1000 starts, 95% CI = 0.03–0.23) were coded as a musculoskeletal (MSI) injury or sudden
collapse. Other reasons for the requesting of an incident report were “galloped on (contact
with another horse)” (6.2%), pulled up (16.92%) and those coded as miscellaneous (35.4%).
Less than half of the incident reports (38.46%; 0.91/1000 starts, 95% CI = 0.84–0.99) had no
observable abnormalities detected in the clinical findings (NOAD).
The reporting rates of clinical observations across all incident, and non-incident stipen-
diary reports are presented in Table 2. Overall, integument lacerations and abrasions
accounted for the largest number of incident cases (32.65%), with the remaining categories
representing less than 5% of cases each and with no difference in the rates per 1000 starts.
Table 2. Frequency of clinical findings in incident (n = 130) and non-incident (n = 871) stipendiary
reports over 2 complete harness racing seasons. Data are reported as frequency per 1000 starts (with
95% confidence intervals) and the percentage of clinical findings within the respective report type
(incident or non-incident).
Incident Reports Non-Incident Reports
Frequency per Frequency per
Description % %
1000 Starts 1000 Starts
Arrhythmia 0.09 (−0.16–0.34) 3.85 0.80 (0.69–0.92) 5.05
Cardiac failure 0.02 (−0.24–0.28) 0.77
Laceration/abrasion 0.88 (0.78–0.97) 36.92 1.63 (1.42–1.84) 10.22
Lame 0.09 (−0.16–0.34) 3.85 0.40 (0.20–0.61) 2.53
MSI Fracture 0.09 (−0.16–0.34) 3.85 0.07 (−0.18–0.33) 0.46
Other MSI issues 0.09 (−0.16–0.34) 3.85 0.57 (0.39–0.74) 3.56
Unknown MS pain 0.07 (−0.18–0.33) 3.08 0.44 (0.24–0.64) 2.76
No observable abnormalities
0.77 (0.0.64–0.90) 32.31 8.39 (7.67–9.11) 52.70
detected (NOAD)
Poor recovery 0.11 (−0.14–0.36) 4.62 1.48 (1.30–1.66) 9.30
Respiratory issues 0.09 (−0.16–0.34) 3.85 0.71 (0.57–0.85) 4.48
Previous injury 0.24 (0.01–0.47) 1.49
Bleeders (epistaxis) 0.26 (0.03–0.48) 1.61
Unknown 0.33 (0.11–0.55) 2.07
Miscellaneous 0.07 (−0.18–0.33) 3.08 0.60 (0.44–0.77) 3.79
3.2.2. Non-Incident Reports
There were 871 stipendiary reports that were classified as non-incident and were not
associated with a race incident. The major reason for the request of a non-incident report
(70.3%, 611/871) was for the routine post-race screening of horses or screening of horses
performing below expectations (11.2/1000 starts, 95% CI = 10.32–12.01). Stewards were
responsible for the requesting most of the poor performance examinations (95% 582/612).
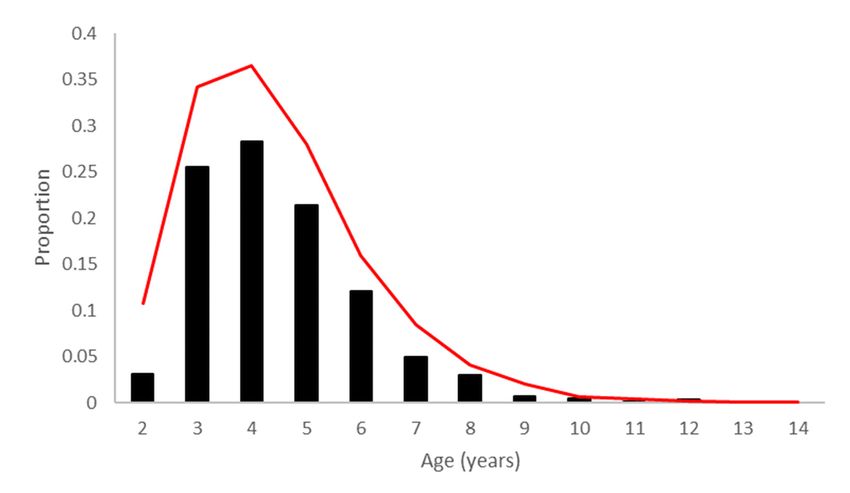
The distribution of age across all poor performers is presented in Figure 1 and reflected
the underlying population distribution (p = 0.012). Over the two seasons, 87.3% (533/611)
of poor performers were in the ages between 3 and 6 years old. There was a maximum of
two reports for poor performance per horse in a season, with 24 horses having two reports
each season. There was an association of field size with non-incident reports such that a
non-incident report was 2.1 (95% CI = 1.73–2.59) times more likely to be requested in a race
with 9 or more participants than in a race with 8 or less participants (p < 0.001).of poor performers were in the ages between 3 and 6 years old. There was a maximum of
two reports for poor performance per horse in a season, with 24 horses having two re-
ports each season. There was an association of field size with non-incident reports such
Animals 2022, 12, 433
that a non-incident report was 2.1 (95% CI = 1.73–2.59) times more likely to be requested 6 of 10
in a race with 9 or more participants than in a race with 8 or less participants (p < 0.001).
Figure 1. Proportion of participants (red) and the proportion of poor performance reports (black) in
Figure 1. Proportion of participants (red) and the proportion of poor performance reports (black) in
each age group.
each age group.
The largest category for clinical finding of a poor performance exam was NOAD
The largest category for clinical finding of a poor performance exam was NOAD
during veterinary examination (67.1%, 410/611). A small proportion of clinical findings
during veterinary examination (67.1%, 410/611). A small proportion of clinical findings
was classified as poor recovery (6.8%), Arrhythmia (4.6%), respiratory issues (2.87%), and
was classified as poor recovery (6.8%), Arrhythmia (4.6%), respiratory issues (2.87%), and
Lacerations/abrasions (2.64%). Musculoskeletal injuries among poor performers (1.61%)
Lacerations/abrasions
were coded as either(2.64%).
tendon Musculoskeletal
or ligament straininjuries among poor performers (1.61%)
and myositis.
were coded as either tendon or ligament strain and myositis.
The largest category of findings with the non-incident reports was NOAD (53% of
The largest category
all non-incident of findings
reports). The main with the non-incident
clinical findings were reports was NOAD
integument (53% ofand
lacerations
all abrasions
non-incident
(10.2%reports). The mainreports),
of non-incident clinical followed
findings by
were
poor integument lacerations
recovery (9.30%), and
arrhythmia
abrasions (10.2% of non-incident reports),
(5.05%) and respiratory issues (4.48%). followed by poor recovery (9.30%), arrhythmia
(5.05%) and respiratory issues (4.48%).
4. Discussion
4. Discussion
The distribution of race type reported was similar to previous reports and reflects the
Thefocus
large distribution
of the New of race typeharness
Zealand reported was industry
racing similar toonprevious
pacing ratherreportsthanand reflects
trotting races.
theIn
large focus of the New Zealand harness racing industry on pacing rather
contrast to racing in the USA and other jurisdictions with an emphasis on racing over a than trotting
races.
mileIn(1609
contrast
m), to racing
many in the
of the USA
races in and
Newother jurisdictions
Zealand were at awith an emphasis
distance greater thanon racing
2000 m.
over a mile
Racing (1609
over thesem),longer-distance
many of the races racesinwas
New Zealand
reflected were
in the at a mile
lower distance greater
rate for both than
trotters
2000
andm.pacers
Racing[6].
overThethese longer-distance
participation structureraces was reflected
of harness racingin inthe
New lower mile has
Zealand rateafor
large
proportion
both trotters andof breeder-owner-trainers
pacers [6]. The participation and this was reflected
structure of harnessin the older
racing in age
New profile
Zealandof the
hashorses
a largeracing in NewofZealand
proportion [5], which was similar
breeder-owner-trainers to awas
and this report basedin
reflected onthetheolder
New age South
Wales (Australia) harness racing population [7]. There was a
profile of the horses racing in New Zealand [5], which was similar to a report based onreduction in the median
thenumber
New South of horses
Walesracing and the
(Australia) number
harness of starters
racing compared
population to the was
[7]. There previously published
a reduction in
theliterature reflecting
median number ofthe reported
horses racingcontraction in the New
and the number Zealand
of starters racing industry
compared [6,12].
to the previ-
Racing was
ously published concentrated
literature onthe
reflecting all-weather surfaces, around
reported contraction in the aNew fewZealand
major venues
racing or
regions,
industry predominantly in the South Island. This distribution reflects the underlying
[6,12].
breeding
Racing and
was participation
concentrated base for harnesssurfaces,
on all-weather racing inaround
New Zealand
a few major[13]. The
venuesdistribution
or re-
of the stewards reporting reflected this underlying distribution
gions, predominantly in the South Island. This distribution reflects the underlying of harness racing in New
Zealand. This in association with the relatively high level of screening
breeding and participation base for harness racing in New Zealand [13]. The distribution (non-incident reports)
indicates
of the stewardsthatreporting
the reporting should
reflected thisprovide a good
underlying reflectionof
distribution ofharness
the underlying
racing inincidents
New
and injuries observed with harness racing. The data used were collected retrospectively
and cross validated with the published steward’s reports. At the time of data collection,
reports were completed by officials using a pro forma sheet. The use of a pro forma reporting
sheet provided some consistency in the type and level of reporting. However, despite this,
there were still some limitations in ability to precisely identify the anatomical site affected
and occasional inconsistency in descriptors used. During the 2018/19 racing season, an
online reporting system was implemented based on the pro forma sheet. This online systemAnimals 2022, 12, 433 7 of 10
will provide data that reflect the data previously captured using the paper-based system
and the internal controls within the online system should ensure consistency in terms used
with recording.
The incidence of musculoskeletal fracture during both observed seasons was lower
than the incidence reported in New Zealand Thoroughbred racing (0.48 per 1000 starts)
using a similar reporting framework [11]. Fractures were recorded in both incident and
non-incident reports, and this reflects how an incident and non-incident report was defined.
A steward may class a report with a musculoskeletal fracture as being a non-incident if
there was no “event” such as a horse falling or colliding with another horse. It is also
possible that some non-displaced fractures are only identifiable, because a horse performed
below expectations or presented with a lameness once the horse had cooled down post
racing. Within the stipendiary stewards’ reports, the description of the fractures were
based on broad anatomical locations with seven of the nine fractures involving the distal
limb, and predominately the first phalanx and the metacarpophalangeal joint. Fractures at
these sites are typically attributed to accumulated cyclic load [14,15]. The difference in the
reported fracture incidence between Thoroughbred racing and harness racing highlights
the differences in the pattern and magnitude of load accumulated and the intensity of
exercise between codes during both training and racing [1]. The harness racing horses had a
median of 7 race starts per season over 2200 m, which was greater than the number of starts
and race distance (5 starts/year, 1400 m) reported in the New Zealand Thoroughbred racing
industry [13,16]. While harness racing horses in New Zealand typically acquire a greater
number of load cycles during training and racing [5,17], the nature and magnitude of the
load on the distal limb, and the first phalanx and metacarpophalangeal joint specifically,
is less for the trotting/pacing compared to galloping [18]. The lower strain per load cycle
with harness racing (trotting and pacing gait) may account for the reduced incidence as
fatigue life decreases exponentially with increasing strain [19].
The rate of reporting for lacerations was moderately lower than thoroughbred racing,
but similar to data reported for harness racing in Australia, which operates under similar
rules and conditions to those in New Zealand [7]. The relatively higher frequency of
reporting of lacerations/abrasions compared to other categories in part reflects the gait
of harness racing (pace and trot) and the relatively higher risk of interference (lower limb
being struck by the contralateral limb) [20]. The reporting of lameness was lower than
values from Australia using a similar reporting process and the rate of reporting lameness
from non-incidents was four-fold greater than with an incident report [7]. These data
possibly reflect the consistent reporting that much poor performance can be associated with
MSI, and that many low-grade injuries or lameness only become obvious once the horse
has cooled down post-race. There was also a low rate of reporting of epistaxis (bleeders) in
the dataset compared to an Australian study [7]. This could be explained by the relatively
long stand down periods associated with horses that present with epistaxis on race day in
New Zealand and hence a possible hesitancy of trainers to present a horse for racing if they
suspect it may have an episode of epistaxis [10].
There was no association of track surface with the rate of incident reporting, despite
the anecdotal observation that the lower-grade racing was conducted on grass surfaces
rather than on all-weather. As most of the racing was conducted on all-weather tracks there
may have been significant heterogeneity in the class of racing on all-weather surfaces that
prevented the ability to differentiate any surface or race quality effect. In New Zealand,
grass track meetings are held in the summer when weather conditions are optimal and the
number of races on grass is limited to preserve the ground conditions. The type of meeting
that occurs on a grass track differs to what occurs on all-weather surfaces and are part of
a summer circuit where trainers take their horses on a trip to several meetings within a
regional circuit. Within the current data set, it was also difficult to clearly differentiate race
grade and track surface to compare the race grade effect. Harness racing data from Canada
indicates that racing at higher ranking tracks was associated with a higher incidence of
sudden death and accidents for horses failing to finish a race than in races at lower-rankingAnimals 2022, 12, 433 8 of 10
race tracks [4]. A similar pattern of greater MSI with higher grade racing was reported
in Australian Thoroughbred racing with a higher incidence of musculoskeletal injuries
reported on metropolitan racetracks compared to country track [9]. Within New Zealand,
the closest analogue to metropolitan tracks for harness racing would be the all- weather
surfaces, however, even on all-weather surfaces there is a large variation in race grade
(quality), which may explain the lack of apparent clustering observed.
There was no association of type of going with the rate of incident reporting. This may
be explained in part by most races in New Zealand being on fast or good all-weather tracks.
In New Zealand, most all-weather surfaces for harness racing consist of a predominately
hardpacked lime substrate and thus there is limited variation in the material properties of
fast and good all-weather surfaces and the relative speed differential between races on these
going ratings over these longer distances is relatively moderate (no significant differences
between categories in mile rate). There is an active program managed by Harness Racing
New Zealand to ensure consistency in track surface between tracks. All harness tracks are
inspected annually and concerns about track conditions are corrected prior to race day if
possible. If a track is not suitable either prior to the start of the race day or during the race
day, the track condition deteriorates (e.g., excessive rainfall), a meeting will be cancelled or
postponed under the discretion of the stipendiary steward. By having these measures in
place, injuries as a result of poor track conditions are minimized.
The number of participants in a race increased the likelihood of either an incident or
non-incident report occurring. Increases in participants increases the likelihood of accidents
such as horses colliding with each other or being galloped on. Similar results are reported
in Thoroughbred racing where race-level factors for injuries included the type of race track,
the track conditions, race distance, and field size [21]. However, the increase in the number
of non-incident reports with the number of participants may reflect stewards inadvertently
performing routine checks relative to the starters in the race.
Most of the requests for a steward report were due to poor performance and the pattern
of non-incident reporting appeared to be routine screening of race participants to maintain
racing integrity and horse welfare. The selection of the horses for routine screening is
often based on horses that had a performance in the race that was lower than the horse’s
previous race, or lower than expectations as reflected by the odds at the tote (reflecting the
amount of money placed/gambled on the horse via the official betting agency). Requests
for examination based on the category poor performance reflected the distribution of the
underlying starter population with respect to age and sex of the horse. The finding of the
major category for poor performance being NOAD reflects this observation that much
of these examinations were part of the routine screening process and a low frequency
of undetected musculoskeletal injuries not associated with an incident during the racing
event.
The primary issues identified with the social license to operate with horse racing
appear to focus on the concept of injury and risk of injury to the equine participants [8].
Routine screening data, such as stewards’ reports provides metrics for industry perfor-
mance. The level of stewards reporting during harness racing in New Zealand indicates
that these data are representative of the industry and provides robust metrics of the indus-
try’s performance. The low incidence of significant clinical findings from this high level of
reporting and screening indicates that harness racing in New Zealand is meeting its duty
of care to the horses racing in it and the primary issues associated with the social license to
operate with horse racing.
5. Conclusions
There was a robust level of reporting within the harness racing industry during the
two seasons examined. The occurrence of non-incident and incident reports was limited
emphasizing the smaller risk in New Zealand harness racing compared to Thoroughbred
racing. The low fracture rate reported reflects anecdotal reporting of lower rates in harness
racing compared to flat racing thoroughbreds and can be described by the different racingAnimals 2022, 12, 433 9 of 10
and training associated bone strain and fracture risk between the codes. The high level of
reporting by the stewards reflects the role stewards have in maintaining of racing integrity.
Author Contributions: Methodology, C.W.R.; formal analysis, M.J.G. and F.J.R.F.; data curation,
F.J.R.F.; writing—original draft preparation, M.J.G., F.J.R.F. and C.W.R.; writing—review and editing,
M.J.G., F.J.R.F., C.F.B., E.K.G. and C.W.R.; funding acquisition, C.W.R., E.K.G. and C.F.B. All authors
have read and agreed to the published version of the manuscript.
Funding: This research was funded by The New Zealand Equine Trust, grant number “9/2017”.
Institutional Review Board Statement: Not applicable.
Informed Consent Statement: Not applicable.
Data Availability Statement: Source data are publicly available via respective websites, collated
extracts are the property of respective bodies.
Conflicts of Interest: The authors declare no real or perceived conflict of interest.
References
1. Bertuglia, A.; Bullone, M.; Rossotto, F.; Gasparini, M. Epidemiology of musculoskeletal injuries in a population of harness
Standardbred racehorses in training. BMC Vet. Res. 2014, 10, 11. [CrossRef] [PubMed]
2. Gee, E.K.; Rogers, C.W.; Bolwell, C.F. Commercial equine production in New Zealand. 1. Reproduction and breeding. Anim. Prod.
Sci. 2017, 60, 2145–2154. [CrossRef]
3. Rogers, C.; Herbst, A.; Langhans, K.; Stone, R.; Hirst, R.; Gee, E.; Back, P. The management of Standardbred breeding stock on
commercial properties. N. Z. J. Anim. Sci. Prod. 2020, 80, 84–89.
4. Physick-Sheard, P.; Avison, A.; Sears, W. Factors Associated with Mortality in Ontario Standardbred Racing: 2003–2015. Animals
2021, 11, 1028. [CrossRef] [PubMed]
5. Legg, K.; Gee, E.; Bolwell, C.; Bridges, J.; Rogers, C.W. A Cross-Sectional Survey of the Training and Management of a Cohort of
2-Year-Old Standardbred Racehorses in New Zealand. J. Equine Vet. Sci. 2020, 87, 102936. [CrossRef]
6. Bolwell, C.; Rogers, C.; Gee, E.; Rosanowski, S. Descriptive statistics and the pattern of horse racing in New Zealand: Part two
harness racing. Anim. Prod. Sci 2014, 56, 1077–1081. [CrossRef]
7. Knight, P. Results of racetrack examinations of Standardbred horses at race meetings in New South Wales. Aust. Vet. J. 2019, 97,
509–514. [CrossRef]
8. Heleski, C.; Stowe, C.J.; Fiedler, J.; Peterson, M.L.; Brady, C.; Wickens, C.; MacLeod, J.N. Thoroughbred Racehorse Welfare
through the Lens of ‘Social License to Operate—With an Emphasis on a US Perspective. Sustainability 2020, 12, 1706. [CrossRef]
9. Parkin, T.D. Epidemiology of racetrack injuries in racehorses. Vet. Clin. N. Am. Equine Pract. 2008, 24, 1–19. [CrossRef]
10. Rosanowski, S.; Chang, Y.; Stirk, A.; Verheyen, K. Descriptive epidemiology of veterinary events in flat racing Thoroughbreds in
Great Britain (2000 to 2013). Equine Vet. J. 2017, 49, 275–281. [CrossRef]
11. Bolwell, C.; Rogers, C.; Gee, E.; McIlwraith, W. Epidemiology of musculoskeletal injury during racing on New Zealand racetracks
2005–2011. Animals 2017, 7, 62. [CrossRef] [PubMed]
12. Rogers, C.; Gee, E.; Vermeij, E. Retrospective examination of the breeding efficiency of the New Zealand Thoroughbred and
Standardbred. N. Z. Soc. Anim. Prod. 2009, 69, 126–131.
13. Bolwell, C.F.; Rogers, C.W.; Gee, E.K.; Rosanowski, S.M. Descriptive statistics and the pattern of horse racing in New Zealand. 1.
Thoroughbred racing. Anim. Prod. Sci. 2014, 56, 77–81. [CrossRef]
14. Riggs, C.M.; Whitehouse, G.H.; Boyde, A. Pathology of the distal condyles of the third metacarpal and third metatarsal bones of
the horse. Equine Vet. J. 1999, 31, 140–148. [CrossRef] [PubMed]
15. Whitton, R.; Ayodele, B.; Hitchens, P.; Mackie, E. Subchondral bone microdamage accumulation in distal metacarpus of
Thoroughbred racehorses. Equine Vet. J. 2018, 50, 766–773. [CrossRef] [PubMed]
16. Legg, K.A.; Gee, E.K.; Cochrane, D.J.; Rogers, C.W. Preliminary Examination of the Biological and Industry Constraints on the
Structure and Pattern of Thoroughbred Racing in New Zealand over Thirteen Seasons: 2005/06–2017/18. Animals 2021, 11, 2807.
[CrossRef]
17. Bolwell, C.F.; Russell, L.J.; Rogers, C.W. A cross-sectional survey of training practices of 2-year-old racehorses in the North Island
of New Zealand. Comp. Exerc. Physiol. 2010, 7, 37–42. [CrossRef]
18. Harrison, S.M.; Whitton, R.C.; Kawcak, C.E.; Stover, S.M.; Pandy, M.G. Relationship between muscle forces, joint loading and
utilization of elastic strain energy in equine locomotion. J. Exp. Biol. 2010, 213, 3998–4009. [CrossRef]
19. Martig, S.; Chen, W.; Lee, P.; Whitton, R. Bone fatigue and its implications for injuries in racehorses. Equine Vet. J. 2014, 46,
408–415. [CrossRef]Animals 2022, 12, 433 10 of 10
20. Dabbene, I.; Bullone, M.; Pagliara, E.; Gasparini, M.; Riccio, B.; Bertuglia, A. Clinical findings and prognosis of interference
injuries to the palmar aspect of the forelimbs in Standardbred racehorses: A study on 74 cases. Equine Vet. J. 2018, 50, 759–765.
[CrossRef]
21. Hitchens, P.; Morrice-West, A.; Stevenson, M.; Whitton, R. Meta-analysis of risk factors for racehorse catastrophic musculoskeletal
injury in flat racing. Vet. J. 2019, 245, 29–40. [CrossRef] [PubMed]You can also read