RAZER INC. INVESTOR PRESENTATION | 1H 2019 EARNINGS - 2019 RAZER INC. ALL RIGHTS RESERVED.
←
→
Page content transcription
If your browser does not render page correctly, please read the page content below

RAZER INC.
                                         INVESTOR PRESENTATION | 1H 2019 EARNINGS

© 2019 RAZER INC. ALL RIGHTS RESERVED.                                              1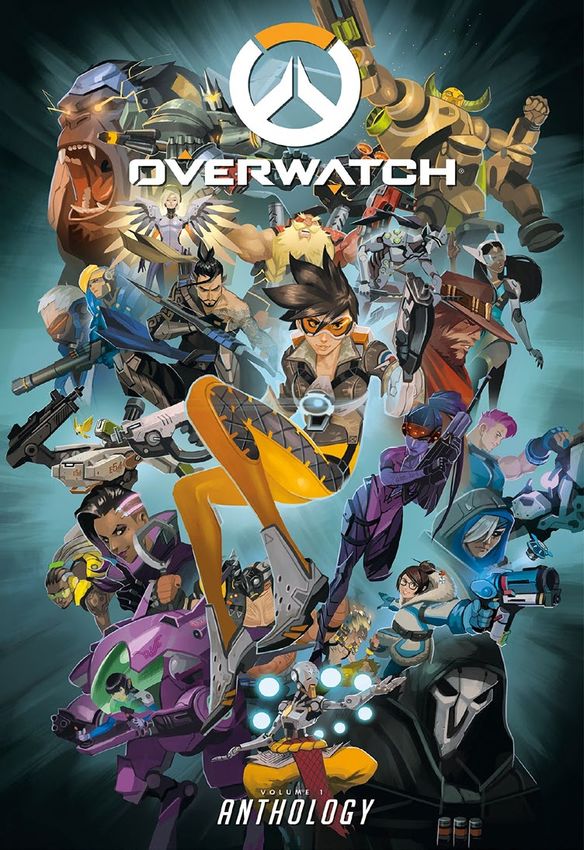
AGENDA
      1          1H 2019 HIGHLIGHTS

               Min-Liang Tan – Co-founder and CEO

      2         GROWTH INITIATIVES

               Limeng Lee – CSO

      3         FINANCIAL REVIEW

               Edwin Chan – CFO

      4          OUTLOOK

               Min-Liang Tan – Co-founder and CEO

© 2019 RAZER INC. ALL RIGHTS RESERVED.              2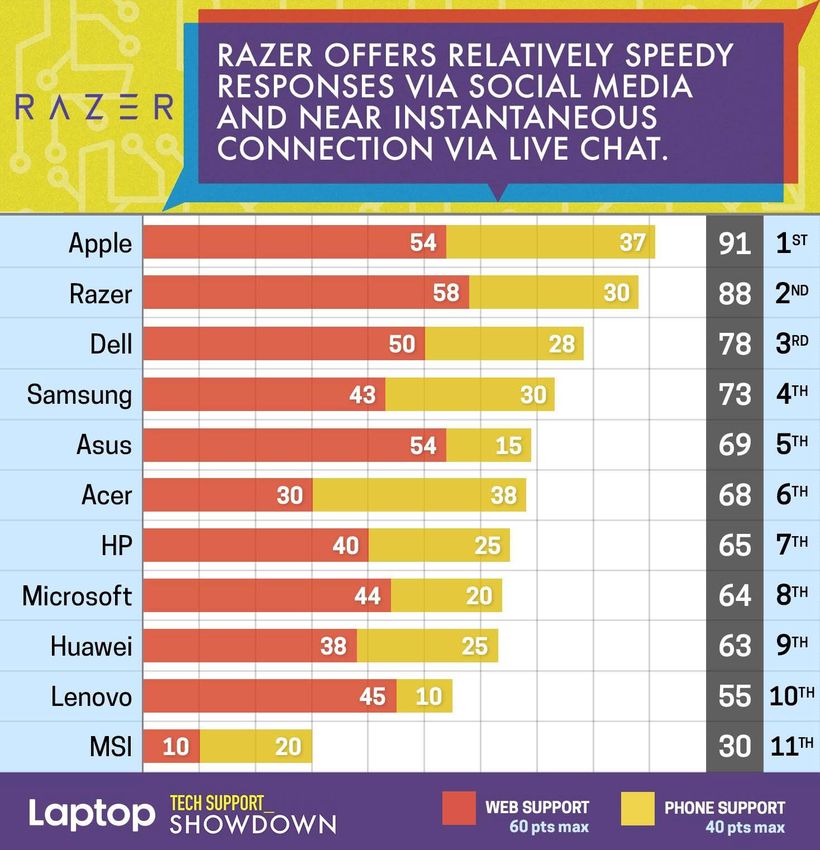
LEGAL DISCLAIMER
    Potential investors and shareholders (the “Potential Investors and Shareholders”) of Razer Inc. (the “Company”) are reminded that information contained in this Presentation
    comprises extracts of operational data and financial information of the Company and its subsidiaries (the “Group”) for the six months ended 30 June 2019. The information
    included is solely for the use in this Presentation and certain information has not been independently verified. No representations or warranties, expressed or implied, are
    made as to, and no reliance should be placed on, the fairness, accuracy, completeness or correctness of the information or opinions presented or contained in this
    Presentation. Potential Investors and Shareholders should refer to the 1H 2019 results announcement for the results of the Company which are published in accordance with
    the Rules Governing the Listing of Securities on The Stock Exchange of Hong Kong Limited.

    The performance and the results of operations of the Group contained within this Presentation are historical in nature, and past performance is no guarantee of the future
    results of the Group. Any forward-looking statements and opinions contained within this Presentation are based on current plans, estimates and projections, and therefore
    involve risks and uncertainties. Actual results may differ materially from expectations discussed in such forward looking statements and opinions. The Group, the directors,
    employees and agents of the Group assume (a) no obligation to correct or update the forward-looking statements or opinions contained in this Presentation; and (b) no liability
    in the event that any of the forward-looking statements or opinions do not materialize or turn out to be incorrect.

    Potential Investors and Shareholders should exercise caution when investing in or dealing in the securities of the Company.

© 2019 RAZER INC. ALL RIGHTS RESERVED.                                                                                                                                             3
1H 2019 HIGHLIGHTS

                                                          MIN-LIANG TAN
                                                        CO-FOUNDER and CEO
© 2019 RAZER INC. ALL RIGHTS RESERVED.                                       4
KEY HIGHLIGHTS

                                     RECORD HIGH REVENUE with 30.3% YoY growth to US$357.2MN

                                     High-margin Services business grew 110.5% YoY to US$35.7MN.
           +110.5%                   Gross Profit contribution to the group of approximately 20%.

                                     Net Loss Margin SIGNIFICANTLY IMPROVED by 740BPS to 13.4%;
                                     Net Loss NARROWED to US$47.7MN.

© 2019 RAZER INC. ALL RIGHTS RESERVED.                                                              5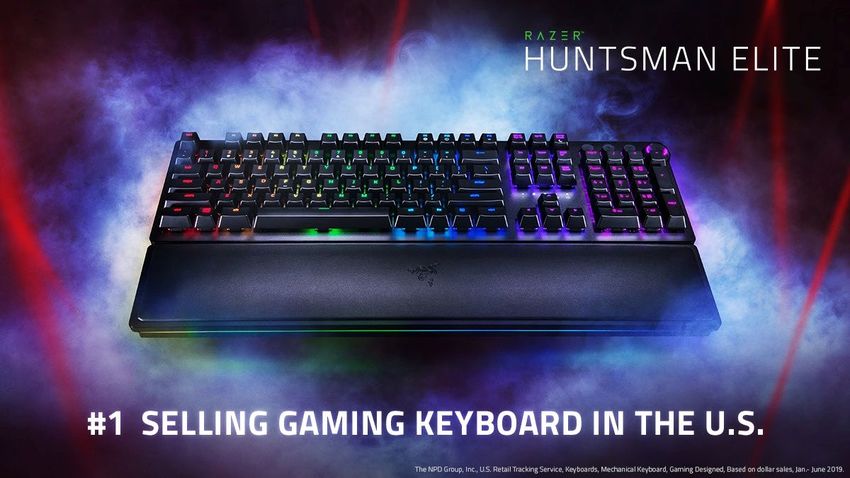
RECORD HIGH REVENUE
    YEAR-ON-YEAR GROWTH BY 30.3%

                                                     NET REVENUE
           (US$ MN)

                                                   +30.3%

                                                                   357.2

                                         274.2

                                         1H 2018                   1H 2019

© 2019 RAZER INC. ALL RIGHTS RESERVED.                                       6
SERVICES REVENUE GREW 110.5% YoY
    SERVICES CONTRIBUTION FURTHER SCALES
                                              SERVICES NET REVENUE                              SERVICES GROSS PROFIT CONTRIBUTION
    (US$ MN)                                                                        (US$ MN)

                                                                          35.7*                                                           14.9

                                                                                                                    10.8

                                     +110.5%
                                                                                                0.1
                                                                                               1H 2017             1H 2018               1H 2019
                                                                17.0*

                                                                                                                                  GP
                                                                                                          GPM                CONTRIBUTION

                                                                                                      41.7%
                                                                                                         1H 2019
                                                                                                                              20%
                                                                                                                               1H 2019
                          0.1
                        1H 2017                                 1H 2018   1H 2019

   *Inclusive of Razer Gold virtual credits and Razer Fintech

© 2019 RAZER INC. ALL RIGHTS RESERVED.                                                                                                             7
NET LOSS NARROWED
    NET LOSS MARGIN SIGNIFICANTLY IMPROVED BY 740BPS

                                                                LOSS FOR THE PERIOD
    (US$ MN)
                                                      1H 2018                         1H 2019

                                                                                      -47.7

                                                      -57.1

                                                                                      -13.4%

                                                     -20.8%

                  Net loss               Net Loss Margin         +740BPS
© 2019 RAZER INC. ALL RIGHTS RESERVED.                                                          8
THE RAZER ECOSYSTEM:
               AND HOW IT GREW IN 1H 2019

© 2019 RAZER INC. ALL RIGHTS RESERVED.      9
THE WORLD’S LARGEST INTEGRATED GAMING ECOSYSTEM
                                                     ONE OF THE WORLD’S LARGEST
                                                     INTEGRATED GAMING PLATFORMS
                                                                                             70MN REGISTERED
                                                                                                     USER ACCOUNTS

                                                                                             40% YoY
                                                     Enhance user experience via access to
                                                     integrated software platform                GROWTH

                           LEADER IN                                                                                 ONE OF THE WORLD’S
                           GAMING HARDWARE                                   Brand-centric                           LARGEST VIRTUAL
                           Opportunities to expand                                                                   CREDITS FOR GAMERS
                                                                              Ecosystem                              Opportunities to offer
                           into other gaming &
                           lifestyle segments                                                                        other services to users

              US$303.7MN                                                                                     US$35.7MN
                   26.2% YoY
                         GROWTH                                                                               110.5% YoY
                                                                                                                     GROWTH

© 2019 RAZER INC. ALL RIGHTS RESERVED.                                                                                                         10
THE RAZER ECOSYSTEM:
HARDWARE PERFORMANCE
© 2019 RAZER INC. ALL RIGHTS RESERVED. 11HARDWARE REVENUE 26.2% GROWTH YoY
DRIVEN BY STELLAR GROWTH IN SYSTEMS BUSINESS
NET REVENUE
(US$ MN)
+26.2%
303.7
240.8
1H 2018 1H 2019
© 2019 RAZER INC. ALL RIGHTS RESERVED. 12BEST SELLING PERIPHERALS © 2019 RAZER INC. ALL RIGHTS RESERVED. 13
SYSTEMS MARKET SHARE EXPANSION

         #1* MARKET LEADER

    * NPD Group Inc. market research: #1 in revenue share for 15” gaming laptops priced $1,800 and above

© 2019 RAZER INC. ALL RIGHTS RESERVED.                                                                     14
INDUSTRY LEADING CUSTOMER SUPPORT
Laptop Magazine April 2019
© 2019 RAZER INC. ALL RIGHTS RESERVED. 15THE RAZER ECOSYSTEM:
SOFTWARE PERFORMANCE
© 2019 RAZER INC. ALL RIGHTS RESERVED. 1640% YoY GROWTH TO 70 MILLION USER ACCOUNTS
STRONG GROWTH ACROSS ALL SOFTWARE OFFERINGS
(In MN)
70
60
50 70 +40%
YoY
40 50
35
30
Jun-17 Jun-18 Jun-19
Total Registered User Accounts
© 2019 RAZER INC. ALL RIGHTS RESERVED. 17SOFTWARE
RAZER SYNAPSE RAZER CHROMA™ RGB RAZER CORTEX
IOT PLATFORM UNIVERSAL RGB LIGHTING SYSTEM GAME LAUNCHER
70 MN REGISTERED USER ACCOUNTS
(+40% YoY)
© 2019 RAZER INC. ALL RIGHTS RESERVED. 18RAZER CHROMA™ RGB
THE GO-TO SOFTWARE PLATFORM FOCUSED ON GAMER TAM
25 THIRD PARTY
PARTNERS
500+
RAZER CHROMA™ RGB
ENABLED DEVICES
150+
AAA GAMES POWERED BY
RAZER CHROMA™ RGB
As of late May 2019
© 2019 RAZER INC. ALL RIGHTS RESERVED. 19RAZER CHROMA™ RGB ENABLED GAMES © 2019 RAZER INC. ALL RIGHTS RESERVED. 20
THE RAZER ECOSYSTEM:
                            SERVICES PERFORMANCE

© 2019 RAZER INC. ALL RIGHTS RESERVED.              21
SERVICES REVENUE GREW 110.5% YoY
SERVICES CONTRIBUTION FURTHER SCALES
SERVICES NET REVENUE SERVICES GROSS PROFIT CONTRIBUTION
(US$ MN) (US$ MN)
35.7* 14.9
10.8
+110.5%
0.1
1H 2017 1H 2018 1H 2019
17.0*
GP
GPM CONTRIBUTION
41.7%
1H 2019
20%
1H 2019
0.1
1H 2017 1H 2018 1H 2019
*Inclusive of Razer Gold virtual credits and Razer Fintech
© 2019 RAZER INC. ALL RIGHTS RESERVED. 22RAZER GOLD
ONE OF THE WORLD’S LARGEST VIRTUAL CREDITS FOR GAMES AND DIGITAL ENTERTAINMENT
OVER
19 MN
WALLETS AND GROWING
2,500+ LEADING GAME TITLES AND
DIGITAL ENTERTAINMENT
+90% YoY 600+ LEADING GAME
PUBLISHERS
© 2019 RAZER INC. ALL RIGHTS RESERVED. 23RAZER GOLD
A CHOICE PARTNER FOR PLATFORM PARTNERS WITH A TRULY UNIQUE WAY
TO ENGAGE WITH GAMERS
© 2019 RAZER INC. ALL RIGHTS RESERVED. 24GROWTH INITIATIVES
LIMENG LEE
CSO
© 2019 RAZER INC. ALL RIGHTS RESERVED. 25MULTIPLE GROWTH DRIVERS
• CLOUD GAMING
• ESPORTS
• FINTECH
• MOBILE GAMING
• THX
© 2019 RAZER INC. ALL RIGHTS RESERVED. 26CLOUD GAMING
PRIME MOVER IN THE GAMING INDUSTRIAL REVOLUTION
© 2019 RAZER INC. ALL RIGHTS RESERVED. 27THE CLOUD GAMING OPPORTUNITY
• MARKET POTENTIAL
• Potential users to reach 124.7 MN in 2022, CAGR +66%*
• MIGRATION FROM CLIENT TO CLOUD
• Convergence of the PC, Console, Mobile gaming ecosystems.
• GPU rendering in the cloud – 4K 60 FPS Low Latency High Bandwidth Streaming
• NEW PLAYERS
• Will require the entrance of new players including:
• Cloud Providers
• GPU Render Farms
• Cloud Gaming Services
• Carriers/Internet Providers/5G Infrastructure
• Multiple new Access Points
• VR/AR
*Source: Newzoo
© 2019 RAZER INC. ALL RIGHTS RESERVED. 28COLLABORATION WITH TENCENT CLOUD © 2019 RAZER INC. ALL RIGHTS RESERVED. 29
RAZER X TENCENT CLOUD
     • HARDWARE
       • Both companies will work closely to launch a series of gaming hardware compatible with Tencent
         Cloud gaming solutions:
         • Mobile controllers and other high-performance peripherals and accessories

     • SOFTWARE
       • Both companies will work together to integrate Tencent’s cloud gaming titles with Razer’s
         software and technologies:
          • Razer Chroma™ RGB lighting

     • OTHERS
       • Razer will support Tencent Cloud with its overseas expansion
       • As founding members of Tencent Global eSports Arena-Tech Alliance, Razer and Tencent Cloud
         will leverage their advantages to further enrich the esports ecosystem

© 2019 RAZER INC. ALL RIGHTS RESERVED.                                                                    30
ESPORTS
EXTENDING ON OUR BRAND LEADERSHIP IN ESPORTS
© 2019 RAZER INC. ALL RIGHTS RESERVED. 31ESPORTS GAMES AND AUDIENCES
81.4MN 77.5MN 41.4MN 27.3MN 27.1MN
HOURS WATCHED HOURS WATCHED HOURS WATCHED HOURS WATCHED HOURS WATCHED
Source : https://newzoo.com/insights/rankings/top-games-twitch-youtube/ (As of Jul-19)
© 2019 RAZER INC. ALL RIGHTS RESERVED. 3218 SPONSORED GLOBAL TEAMS
XIAN
© 2019 RAZER INC. ALL RIGHTS RESERVED. 33TEAM RAZER @ TI9
EVIL GENIUSES AND ALLIANCE*
THE ANNUAL DOTA 2 CHAMPIONSHIP
ONE OF THE LARGEST ESPORTS FINALS
US$33 MILLION PRIZE POOL
* At the time of announcement. TI9 started on Aug 20 and will run until Aug 25
© 2019 RAZER INC. ALL RIGHTS RESERVED. 34SEA GAMES 2019
9 SEA countries
First medal esports event 6
Competing in games across
Reaching to 660 million+
in the world sporting stage PC, mobile and console platforms
population in SEA
© 2019 RAZER INC. ALL RIGHTS RESERVED. 35FINANCIAL PERFORMANCE
EDWIN CHAN
CFO
© 2019 RAZER INC. ALL RIGHTS RESERVED. 36NET REVENUE
DRIVEN BY STELLAR GROWTH IN SYSTEMS AND SERVICES BUSINESS
REVENUE BY SEGMENT
(US$ MN)
+30.3%
357
18
36
274
16
17
303
241
1H 2018 1H 2019
Hardware* Software & Services Others
* Hardware includes Peripherals and Systems
© 2019 RAZER INC. ALL RIGHTS RESERVED. 37GROSS PROFIT
LOWER BLENDED GPM DUE TO SHIFT IN PRODUCT MIX FOR HARDWARE
GROSS PROFIT
(US$ MN)
GPM
29.0% GPM
21.2%
79 76
1H 2018 1H 2019
© 2019 RAZER INC. ALL RIGHTS RESERVED. 38OPERATING EXPENSES
ADJUSTED OPEX AS % OF NET REVENUE IMPROVES BY 990BPS
OPERATING EXPENSES
(US$ MN) 40.4%
30.5%
133
– 2
20
128
11.5% – 2
18
7.3% 10.3%
111
4.7%
8.3% 108
6.0%
11.5%
10.3%
1H 2018 1H 2019
Selling and Marketing expenses Research and Development expenses General and Administrative expenses
Personnel Expenses Share-based compensation Restructuring expenses
M&A expenses Total adjusted OPEX as % of Net Revenue
© 2019 RAZER INC. ALL RIGHTS RESERVED. 39NET LOSS NARROWED
NET LOSS MARGIN SIGNIFICANTLY IMPROVED BY 740BPS
LOSS FOR THE PERIOD
(US$ MN)
1H 2018 1H 2019
-47.7
-57.1
-13.4%
-20.8%
Net loss Net Loss Margin +740BPS
© 2019 RAZER INC. ALL RIGHTS RESERVED. 40CASH FLOWS & WORKING CAPITAL
CASH FLOWS SUMMARY
CASH FLOWS (USED IN) OPERATING ACTIVITIES CASH FLOWS FROM (USED IN) INVESTING ACTIVITIES CASH FLOWS (USED IN) FINANCING ACTIVITIES CASH AND BANK BALANCES
(US$ MN)
2 634
529
(21)
(20)
(34)
(34)
(54)
1H 2018 1H 2019 1H 2018 1H 2019 1H 2018 1H 2019 Jun-18 Jun-19
WORKING CAPITAL CYCLE
DAYS INVENTORY OUTSTANDING1 TRADE RECEIVABLES TURNOVER DAYS2 TRADE PAYABLES TURNOVER DAYS3 CASH CONVERSION CYCLE4
(Days)
166
128
66 69
(26)
45
36
(52)
Jun-18 Jun-19 Jun-18 Jun-19 Jun-18 Jun-19 Jun-18 Jun-19
Notes:
1 Days inventory outstanding equals the average of the opening and closing inventory balances divided by the cost of sales for the period and multiplied by the number of days in the period. 2 Trade receivables turnover days equals the average of
trade receivables divided by the total revenue for the period and multiplied by the number of days in the period. 3 Trade payables turnover days equals the average of trade payables divided by the total cost of sales for the period and multiplied by
the number of days in the period. 4 Cash conversion cycle for a period equals days inventory outstanding plus trade receivables turnover days less trade payables turnover days
© 2019 RAZER INC. ALL RIGHTS RESERVED. 41OUTLOOK
MIN-LIANG TAN
CO-FOUNDER and CEO
© 2019 RAZER INC. ALL RIGHTS RESERVED. 42OUTLOOK FOR 2019
GROUP
SOLID GROWTH. EXPANDING SERVICES. IMPROVING PROFIT PROFILE
Will continue to show Continue to expand high- Improving profit profile
solid revenue growth margin Services business
CORE SEGMENT GROWTH SEGMENT
PROFITABLE. GOOD GROWTH. PREDICTABLE. NEW OPPORTUNITIES. INVESTMENT MODE.
HARDWARE CLOUD GAMING
Continue to see good growth while GPM improves Collaboration with Tencent Cloud and expect further progress in this area
ESPORTS
Continue to elevate esports to the mainstream and work with the best
SOFTWARE esports athletes to develop stellar esports products
Further accelerate the growth of user base and user activity in RAZER FINTECH
2019 to drive additional monetization opportunities
TPV to scale as we extend our capabilities in SEA and other emerging
markets
MOBILE GAMING
SERVICES Focus on enhancing gamer performance and user experiences including
Razer Gold virtual credits business to continue to scale with new through peripherals and accessories and mobile software, services and esports
content, partners and channels
THX
Continue to lead in immersive digital entertainment as esports, gaming and
cinema converge
© 2019 RAZER INC. ALL RIGHTS RESERVED. 43Q&A © 2019 RAZER INC. ALL RIGHTS RESERVED. 44
You can also read


