"Reducing malnutrition for children under 5 through integrated approach" - By: Dr Nguyen Anh Vu National Health Coordinator

Page created by Zachary Bauer
 
CONTINUE READING
"Reducing malnutrition for children under 5 through integrated approach" - By: Dr Nguyen Anh Vu National Health Coordinator
“Reducing malnutrition for
 children under 5 through
  integrated approach”

      By: Dr Nguyen Anh Vu
   National Health Coordinator
"Reducing malnutrition for children under 5 through integrated approach" - By: Dr Nguyen Anh Vu National Health Coordinator
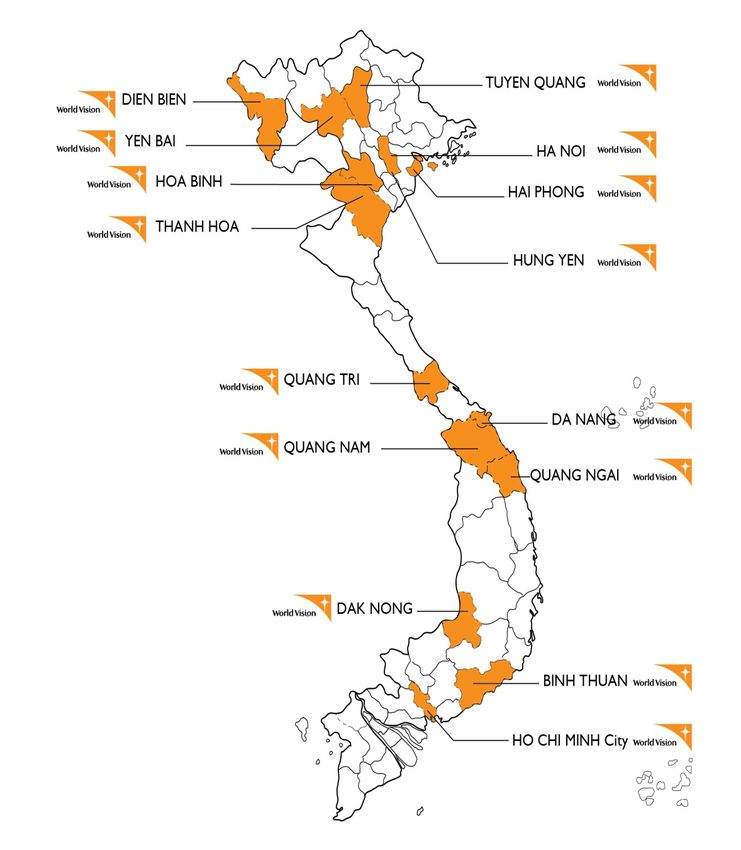
Landscape
Key root causes and challenges

 • There is a disparity in malnutrition among regions

 • Food security is still a concern for some mountainous areas.
   The low income is a challenge for most of families with
   malnourished children.

 • Improper nutrition knowledge and practices are still common
   among mothers and family members,

 • The implementing network for nutrition activities has not
   been stable and synchronized. Attention in nutrition of local
   authorities is somehow still limited.
Landscape
Key root causes and challenges

 • Common diseases (ARI, diarrhea) and communicable diseases
   still contribute to malnutrition

 • Poor sanitation and hygiene practices have impacted on
   children’s health and nutrition, especially in mountainous areas
   where WVV is working there

 • Although many policies are in place, policy implementation
   does not seem effective enough. Guidelines and standard
   documents for policy implementation are often issued in a
   delayed manner

 • Limited government resources is challenges for child health
   care programs
SLandscape           Indicator                            Government data          WVV      North
N                                                                                  data     Provinces
                                                   Value      Year    Source       (2013)   (Yen Bai ‘13)
1    Under 5 mortality rate (per 1,000 )           23.2‰       2012   GSO            NA
2    Infant mortality rate (per 1,000)             15‰         2012   GSO            NA
3    Underweight in children under 5               15.3%       2013   NIN          16.8%        21.3%
4    Stunting in children under 5                  25.9%      2013    NIN          30.3%        43.5%
5    Wasting in children under 5                   6.6%       2013    NIN           5.8%         9.4%
6    Breast feeding for infants under 6 months     19.6%      2010    NIN            NA
     of age
7    Ratio of births attended by skilled medical   96.7%      2011    MOH            NA
     staff
8    Proportion of malaria‐infected cases per      5.2        2011    MOH            NA
     100,000 people
9    Immunization coverage for children under      >90%       2011    NIHE           NA
     one year of age
10   % of household using improved sources of      82,.5%     2014    WATSAN NTP
                                                                      III
                                                                                     NA
     drinking water
11   % of rural population using clean water of    38.7%      2014    WATSAN NTP
                                                                      III
                                                                                     NA
     national quality standards (QC 02/2009
     BYT)
12   % of household using improved sanitation      78.2%      2014    WATSAN NTP
                                                                      III
                                                                                     NA
     facilities (hygienic latrine)
Nutrition Indicators in Yen Bai and Dien Bien – As of
December 2012 - 2013
                                             Underweight rate by zone, comparing between Dec 13
                                                                  and Dec 12

                 30                                                                                                  2.0

                 25                                                                                                  1.0
 % underweight

                 20                                                                                                  0.0

                                                                                                                               % change
                 15                                                                                                  ‐1.0

                 10                                                                                                  ‐2.0

                  5                                                                                                  ‐3.0

                  0                                                                                                  ‐4.0

                                                                                   Quang Tri

                                                                                                  QN‐ĐN
                      Northern

                                                                                                          Southern
                                 Dien Bien

                                                        Yen Bai

                                                                     Thanh Hoa

                                                                                                                           Dec 12

                                                                                                                           Dec 13

                                                                                                                       Change
Nutrition Indicators in Yen Bai and Dien Bien – As of
December 2012 - 2013
               Stunting rate by zone, comparing between Dec 13
                                  and Dec 12

                 60                                                                                         2.0

                                                                                                            1.0

                                                                                                                       % change
                 50
  % stunting

                                                                                                            0.0
                 40

                                                                                                            ‐1.0
                 30
                                                                                                            ‐2.0

                 20
                                                                                                            ‐3.0

                 10
                                                                                                            ‐4.0

                  0                                                                                         ‐5.0
                           Northern

                                                                                         QN‐ĐN

                                                                                                 Southern
                                        Dien Bien

                                                      Yen Bai

                                                                             Quang Tri
                                                                 Thanh Hoa

                                                                                                                   Dec 12

                                                                                                                   Dec 13

                                                                                                                   Change
Nutrition Indicators in Yen Bai and Dien Bien – As of
December 2012 - 2013
                  Wasting rate by zone, comparing between Dec 13
                                     and Dec 12

             12                                                                                     4.0

                                                                                                    3.0
             10

                                                                                                               % change
                                                                                                    2.0
             8
 % wasting

                                                                                                    1.0
             6
                                                                                                    0.0

             4
                                                                                                    ‐1.0

             2
                                                                                                    ‐2.0

             0                                                                                      ‐3.0

                                                                     Quang Tri

                                                                                 QN‐ĐN
                  Northern

                                                                                         Southern
                               Dien Bien

                                            Yen Bai

                                                         Thanh Hoa

                                                                                                           Dec 12

                                                                                                           Dec 13

                                                                                                           Change
Objective
                                       What                                                                    Reduce malnutrition in children U5
                                                                                                                 through integrated approach
                                       Pathway of Change
                                                                                                        Relevant policies implemented effectively from the central to local levels..
                                                                                                        High community resilience to shocks (disasters, economic crisis, epidemic)
                                                                                                        Community people ‘s willingness to accept medical and nutritional advice.
                                                                                                        Sufficient budget allocation/ human resources..
   Outcome

                                                                                                                                Mother and children
                                                                                                                               protected from illness
                                                          Adequate dietary intake for                                                                                                           Effective policies and
                                                             mother and children                                                                                                                practices are in place

                                                                                                                              100% of children are vaccinated.
   Intermediate/ Short-term Outcomes

                                                      HH aware of distribution of income to children
                                                                                                                              Caregivers trust the health staff                        Policy implementers have adequate capacity

                                                Household have                                                                                                     Communities are educated on
                                                                                                            Access to effective
                                              enough resources for                                                                                                 the relevant policies/ practices
                                                                                                              health service
                                                nutritious food.                                                                                                      and mobilized for action.

                                              Caregivers applying
                                             appropriate child care
                                            and nutrition practices.
                                                                                                          Safe and hygienic living                                  Strategic partnerships are in
                                                                                                             environment for                                          place to influence on the
                                                                                                           children and mother                                      relevant policies/ practices.
Project Models
 Interventions

                                                                    Sustainable Rice Intensification
                                                                                                                                                      Home Based Care Center                     Nutrition Club            CLTS
                                          Micro Finance                   SRI               Livestock Raising Initiative

                                          Business Facilitation         Accumulating Savings & Credit Association                          Early Child Care & Development                          PD/HEARTH                HWTS
Project Models

• Nutrition Club:
   – An integrated, community based and community led behaviour change
     initiative which involves monthly meetings of caregivers of children under
     five years old.
   – Series of community meetings are facilitated by community members and
     involve group discussions and interactive games about child care, hygiene,
     nutrition, infant and young child feeding practices.
   – Regular child growth monitoring is conducted and also home visits to
     households with malnourished children. Nutrition club members also
     access community interest groups such as saving groups and livelihoods.
   – Community ownership and sustainability of the approach is promoted by
     mobilizing and utilizing existing resources
   – An agreement is made between the community development board and
     World Vision that support for running costs will gradually be reduced and
     discontinued after several years.
   – Monitoring and supportive supervision is conducted by a team of
     government district and health centre staff
Wellbeing of children

                                                                  National Health Programs
                          755                                           Nutrition, EPI
          Nutrition Clubs in more than 30 ADPs                     Vit A, Deworming, etc.
              (Pregnant women and people
          Child Care givers for children
Project Models

Positive Deviance/Hearth:
Positive Deviance/Hearth is a community-based approach to address
malnutrition with three inextricably linked goals:
• Rehabilitate malnourished children.
• Enable families to sustain the rehabilitation of these children at home on their own.
• Prevent malnutrition among the community’s other children, current and future.

The Positive Deviance (PD) process identifies affordable, acceptable, effective
and sustainable practices that are already used by at-risk people and that do not
conflict with local culture.Through learning what their neighbours with equally
limited resources are doing to prevent malnutrition, families are empowered to
adopt better practices even with very limited access to health services.

The Hearth part of PD/Hearth is an intensive behaviour change intervention
targeting families of children with moderate to severe malnutrition to
introduce the locally-discovered positive deviant practices as well as promote
other practices essential to child health.
Area Development Program Model
                 Gender                    Disability
                           CLTS,
                          HWTS       Health
                                                  Special Project/Grant
Micro Finance    Nutrition           Project
                        Health services
            LRI, SRI,                Education             Capacity
             ASCA                     Project:             Building
             Micro                 HBCC; ECCD               Project
            Finance

                        AED/Livelihood           Sponsorship
                           Project                 Project
   Environment

                                   Child Protection
Key Indicators
Hierarchy                Priorities                          Standard Indicators
   Strategic    Reduce malnutrition for children Prevalence of stunting in children under five years of
   Objective    under 5 through integrated age
                approach.                        Prevalence of underweight in children under five
                                                 years of age
                                                 Prevalence of wasting in children under five years of
                                                 age
Long term       Adequate dietary intake for Proportion of households with sufficient diet
Outcome 1       mothers and children             diversity.
Long term       Mother and children protected Prevalence of ARI in children under 5 within the past
Outcome 2       from illness                     2 weeks.

                                                 Prevalence of diarrhea in children under 5 within the
                                                 past 2 weeks.

Long      term Effective policies and practices # of technical guidelines issued by central level
Outcome 3      are in place                     agencies on child malnutrition (e.g. deworming
                                                practice, Infant and Young Child Feeding) as the result
                                                of WVV’s advocacy efforts

                                                 # of improve practices recommended by WV being
                                                 adopted by government to address malnutrition issue
Who

Key partners:
• Government health system:VHW; CHC; DHC; PHD; NIN; MOH
• Government education system: Kindergarten
• Mass organizations: WU;YU
• CBO:Village Development Board (VDB)

MVC targeting and inclusion:
• Malnourished children and other MVC, such as disable children of
  children in extremely difficult families, etc. are managed by VHW
  through monthly GMP sessions and they get support from VDB
  and VHW if needed.
Where

• TA is carried out in 12
  provinces of Vietnam include
  mountainous and rural areas:
   Dien Bien, Tuyen Quang,
   Yen Bai, Hung Yen,
   Hoa Binh, Thanh Hoa, Quang
   Tri, Da Nang,
   Quang Nam, Quang Ngai, Dak
   Nong and Binh Thuan
Thank you!
You can also read