RESEARCH BULLETIN - Fraser Institute
←
→
Page content transcription
If your browser does not render page correctly, please read the page content below
FRASER
RESEARCH              BULLETIN                                                          October 2017

An Analysis of Federal Debt in Canada by
Prime Ministers Since Confederation
by Charles Lammam and Hugh MacIntyre

Summary


 Over Canada’s 150-year history, prime min-        (145 percent) took place during global conflicts
isters have, in various ways, helped shape the     (World War I and World War II) and multiple
country, often leaving a legacy that affects Ca-   economic downturns.
nadians to this day. A key aspect to any prime
minister’s legacy is whether they left the fed-

                                                    Economic downturns, which are out of the
                                                   direct control of a prime minister, contribute
eral government more or less indebted.
                                                   to the accumulation of government debt. The

 This bulletin measures the total percent          federal government collects less revenue and
change in (inflation-adjusted) debt per person     spends more during an economic downturn as
over the course of the tenures of various prime    Canadians make greater use of services such as
ministers since Confederation—from 1870 up         Employment Insurance.
to the end of current Prime Minister Justin
Trudeau’s term in 2019. Adjusting for inflation

                                                    However, of the prime ministers who did
                                                   not face a global conflict or economic down-
and for population growth allows for a compar-
                                                   turn during their tenure, the analysis finds that
ison of debt legacies by prime ministers over an
                                                   by the end of his term in 2019, Justin Trudeau is
extended period of time.
                                                   expected to be the largest debt accumulator (5

 Historical context is important for under-        percent). The only other two prime ministers to
standing debt accumulation under various           increase federal debt without fighting a world
prime ministers. For example, total growth in      war or experiencing an economic downturn are
debt per person under Sir Robert Borden (188       Sir Mackenzie Bowell and Sir John Abbott who
percent) and William Lyon Mackenzie King           both served in the late 19th century.

fraserinstitute.org                                                FRASER RESEARCH BULLETIN 1
Prime Ministers and Federal Debt

Introduction                                            cluding current Prime Minister Justin Trudeau.
This year marks the 150th anniversary of Con-           Table 1 lists them and the years in which they
federation, when Canada came together as a              held office.
new country and federation. Since then, Can-            There are several years in which prime minis-
adian prime ministers and their governments             terial tenures overlap—that is, years in which
have helped shape the country in various ways,          power transferred from one prime minister to
many leaving legacies that affect Canadians to          another. In these transitional years, it is not al-
this day. A key part of any prime minister’s leg-       ways clear which prime minister is responsible
acy is whether they have left the federal gov-          for the debt accumulated. We have chosen to
ernment more or less indebted than when they            allocate the years of prime ministerial respon-
took office. The trajectory of debt matters:            sibility on the same basis as did Clemens and
when the debt burden grows, more public re-             Palacios (2017), who examined spending levels
sources are needed to service the debt’s annu-          by prime minister since Confederation. Clem-
al interest payments, which in turn diverts tax         ens and Palacios (2017) used two criteria that
dollars away from public programs. Because the          we replicated in this bulletin. First, transition-
debt must ultimately be repaid, a higher debt           al years were allocated to the prime minister
also raises the possibility of higher taxes in the      who was in office for the majority of the year.
future, thereby burdening future generations            Second, where a year was evenly split between
with the cost of current expenditures.                  prime ministers, the year was allocated to the
This bulletin examines the history of federal           prime minister who delivered the budget and
debt in Canada and measures how that debt has           established the fiscal foundation for that year.
changed over the tenures of various prime min-          Table 2 lists the prime ministers and the ten-
isters since Confederation.1 The bulletin is div-       ures by which they are evaluated.2 In some
ided into two main sections. The first discusses        cases, a prime minister’s time in office is non-
how the change in federal debt is measured.             continuous. For example, Sir John A. Macdonald
The second measures the change in federal               had two separate tenures: he served as Cana-
debt under various prime ministers.                     da’s first prime minister from 1867 to 1872 but
                                                        was defeated by Alexander Mackenzie and then
Measuring the change in federal debt                    reassumed office in 1878. William Lyon Mack-
To assess the debt legacy of Canadian prime             enzie King also served twice (1922-1930 and
ministers, we have calculated the change in             1936-1948) as did Pierre Trudeau (1968-1978 and
debt from the time a prime minister took office         1980-1984). The time in office for these prime
to when he or she left. A number of steps are
involved in measuring the debt changes over a           2
                                                          Prime ministerial tenures range from a single year
150-year period. The first is to allocate the spe-      to 15 years, which means that some prime ministers
cific years of tenure for each prime minister.          were in office longer than others to either accumu-
Canada has had 23 different prime ministers in-         late or reduce federal debt. However, longer tenures
                                                        do not necessarily translate into larger total in-
                                                        creases or decreases in debt. In fact, the correlation
1
  This bulletin is based on and partly draws upon the   between the length of tenure and the total increase
work of Di Matteo (2017) and Clemens and Palacios       in debt per person over that tenure (the measure
(2017).                                                 used in this bulletin) is relatively weak (p = 0.27).

fraserinstitute.org                                                      FRASER RESEARCH BULLETIN 2
Prime Ministers and Federal Debt

Table 1: Canada’s 23 Prime Ministers, Their Political Party, and Time in Office

 Prime Minister                           Party                                                         Time in Office

 Sir John A. Macdonald                    Liberal Conservative Party                                    1867-1873, 1878-1891
 Alexander Mackenzie                      Liberal Party                                                 1873-1878
 Sir John Abbott                          Liberal Conservative Party                                    1891-1892
 Sir John Thompson                        Liberal Conservative Party                                    1892-1894
 Sir Mackenzie Bowell                     Conservative Party                                            1894-1896
 Sir Charles Tupper                       Conservative Party                                            1896
 Sir Wilfrid Laurier                      Liberal Party                                                 1896-1911
 Sir Robert Borden                        Conservative Party, Unionist Party                            1911-1917, 1917-1920
 Arthur Meighen                           National Liberal and Conservative Party,                      1920-1921, 1926
                                          Conservative Party
 William Lyon Mackenzie King              Liberal Party                                                 1921-1926, 1926-1930,
                                                                                                        1935-1948
 R.B. Bennett                             Conservative Party                                            1930-1935
 Louis St. Laurent                        Liberal Party                                                 1948-1957
 John Diefenbaker                         Progresssive Conservative Party                               1957-1963
 Lester B. Pearson                        Liberal Party                                                 1963-1968
 Pierre E. Trudeau                        Liberal Party                                                 1968-1979, 1980-1984
 Joe Clark                                Progresssive Conservative Party                               1979
 John Turner                              Liberal Party                                                 1984
 Brian Mulroney                           Progresssive Conservative Party                               1984-1993
 Kim Campbell                             Progresssive Conservative Party                               1993
 Jean Chretien                            Liberal Party                                                 1994-2003
 Paul Martin                              Liberal Party                                                 2003-2006
 Stephen Harper                           Conservative Party                                            2006-2015
 Justin Trudeau                           Liberal Party                                                 2015-Present

 Notes:
 • Sir Robert Borden led the Conservative Party from October 10, 1911 to October 11, 1917, and then the Unionist Party from October
   12, 1917 to July 10, 1920. The Unionist Party was a centre-right party primarily consisting of members of the Conservative Party along
   with some former members of the Liberal Party.

 • The National Liberal and Conservative Party is the name adopted by the Conservative Party in 1920 after the end of the Unionist Party.

 Source: Parliament of Canada, 2017; Clemens and Palacios (2017).

fraserinstitute.org                                                                           FRASER RESEARCH BULLETIN 3
Prime Ministers and Federal Debt

Table 2: Prime Ministers Assessed and Their Allotted Tenures

 Prime Minister                                          Allotted Tenure

 Sir John A. Macdonald                                   Tenure 1: 1867-1872
                                                         Tenure 2: 1878-1890
 Alexander Mackenzie                                     1873-1877
 Sir John Abbott                                         1891
 Sir John Thompson                                       1892-1894
 Sir Mackenzie Bowell                                    1895
 Sir Wilfrid Laurier                                     1896-1911
 Sir Robert Borden                                       1912-1919
 Arthur Meighen                                          1920-1921
 William Lyon Mackenzie King                             Tenure 1: 1922-1930
                                                         Tenure 2: 1936-1948
 R.B. Bennett                                            1931-1935
 Louis St. Laurent                                       1949-1956
 John Diefenbaker                                        1957-1963
 Lester B. Pearson                                       1963-1967
 Pierre E. Trudeau                                       Tenure 1: 1968-1978
                                                         Tenure 2: 1980-1984
 Joe Clark                                               1979
 Brian Mulroney                                          1985-1993
 Jean Chretien                                           1994-2003
 Paul Martin                                             2004-2005
 Stephen Harper                                          2006-2015
 Justin Trudeau                                          2015-2019

 Notes:
 • The fiscal year-end for the federal government was changed from June 30th to March 31st in 1907.
 • Does not include budgets for 1867 - 1869 due to a lack of inflation data for those years.
 • The 1984 budget was allocated to the tenure of Pierre Trudeau even though John Turner served as PM during the year
   before losing the general election to Brian Mulroney and the Progressive Conservative Party.
 • The 1993 budget was allocated to the tenure of Brian Mulroney even though Kim Campebll served as PM during the
   year before losing the general election to Jean Chretien and the Liberal Party.
 • For further details on the specific allocation of budgets, see Clemens and Palacios (2017)

 Source: Clemens and Palacios (2017).

fraserinstitute.org                                                             FRASER RESEARCH BULLETIN 4
Prime Ministers and Federal Debt

ministers is split into two tenures so that the      Measuring federal debt
change in federal debt that occurred under a         The next step in measuring the change in fed-
different prime minister is not allocated to the     eral debt over prime ministerial tenures is
prime minister not then holding the office (in       to collect comparable data on federal debt.
other words, Mackenzie’s debt is not allocated       Throughout this bulletin, debt is defined as
to Macdonald).                                       gross debt, which is the federal government’s
Note that three prime ministers were exclud-         total amount of financial liabilities including
ed from table 2 and from the analysis because        interest-bearing debt, future employee ben-
their tenure was too short to have a budget          efits (pensions), and accounts payable. Gross
year allocated to them. Kim Campbell and John        debt directly measures the extent to which
Turner both held office for approximately three      the prime minister increased or decreased the
months and Sir Charles Tupper held office for        country’s financial liabilities. Net debt, an al-
two months. This leaves 20 prime ministers in-       ternative measure of debt, measures liabilities
cluded in the analysis. However, there are 23        minus financial assets and thus does not mea-
tenures since three prime ministers served two       sure liabilities alone. Financial assets are of-
non-continuous tenures.                              ten included in the measure of debt because,
                                                     in theory, financial assets can be used to pay
As was done in Clemens and Palacios (2017),          down liabilities. However, this bulletin focuses
we made an adjustment for the transition from        on gross debt, to the exclusion of financial and
Stephen Harper to Justin Trudeau in 2015. Jus-       other assets, for two reasons. First, in practice,
tin Trudeau came into office approximately half      not all government financial assets can be eas-
way through the fiscal year and immediate-           ily sold to pay for government liabilities—for ex-
ly increased government spending. These in-          ample, government employee pension assets
creases contributed to a budget deficit (of $1.0     are included in financial assets. Second, gross
billion), whereas Harper’s 2015 budget planned       debt determines the interest that governments
for a surplus (of $1.4 billion). Indeed, more debt   pay on liabilities and economic research has
was accumulated by Trudeau than was planned          shown that increasing levels of gross debt can
for under Harper (Canada, Department of Fi-          adversely affect the economy through, for ex-
nance, 2015 and 2017a).3 Due to the differences      ample, the potential for higher future taxes (see
between Stephen Harper’s budget plan and             Reinhart and Rogoff, 2010; Chudik et al., 2015;
the actual spending for 2015/16 under Justin         and Lammam et al., 2017 for a review of this re-
Trudeau, the end point for debt accumulation         search).
under Harper is the debt projected in the 2015
budget ($1.1 trillion in 2017 dollars). The 2015     Data on federal gross debt come from different
budget number is also the starting point for the     sources. Federal debt data for the fiscal years
change in debt under Justin Trudeau.                 1867 through to 1966 are taken from the Canada
                                                     Year Books for 1940, 1950, and 1960.4 Federal

                                                     4
                                                       While federal government accounting practices
                                                     changed over time, the definition of debt is broadly
3
  Notably, program spending was ultimately 2.9       consistent. The most notable government accounting
percent higher in 2015/16 than what was planned in   change is that starting in 1907, the fiscal year ends on
the 2015 budget.                                     March 31st rather than on June 30th as it did previ-

fraserinstitute.org                                                    FRASER RESEARCH BULLETIN 5
Prime Ministers and Federal Debt

   Figure 1: Federal Gross Debt, 1870-2019 (in 2017 $)
                          $1,400

                          $1,200

                          $1,000
Billions (2017 dollars)

                           $800

                           $600

                           $400

                           $200

                             $0

   Sources: Canada, Department of Finance (2017a, 2017b); Statistics Canada (2009a, 2009b, 2009c, 2009d); Urquhart, 1988;
   calculations by authors.

   debt data from 1967 to 2016 are from the Fis-                 index is available beginning in 1870, this is the
   cal Reference Tables published by the depart-                 starting year for the analysis of federal debt.5
   ment of finance. Debt figures for 2017 onward
                                                                 Figure 1 shows inflation-adjusted federal gross
   are drawn from the 2017 federal budget. We have
                                                                 debt from 1870 to 2019. The colours in the area
   included debt projections up to the year 2019
                                                                 graph indicate the tenures of various prime
   to provide a complete analysis for the tenure of
                                                                 ministers. Overall, the figure displays a trend
   Canada’s current prime minister, Justin Trudeau.
                                                                 of increasing debt since 1870. For the first sev-
   To compare changes in federal debt over a long                en decades of data (1870 to 1940), the level of
   period, two adjustments must be made. The                     gross debt generally increased but remained
   first is to account for changes in general price              low compared to more recent years. During
   levels (inflation). To adjust for inflation, this
   bulletin follows Clemens and Palacios (2017) in               5
                                                                    An alternative price index that is commonly used
   using a GDP deflator. Since a GDP deflator price              is Statistics Canada’s Consumer Price Index, which
                                                                 is only available as far back as 1914. The sources of
                                                                 data for the GDP deflator are: Urquhart (1988) (for
                                                                 1870-1980), Statistics Canada (2017b) (for 1981-2015),
   ously. To accommodate the change, the fiscal year             and Canada, Department of Finance (2017b) (for
   that started in 1906 was only nine months long.               2016-2017).

 fraserinstitute.org                                                                FRASER RESEARCH BULLETIN 6
Prime Ministers and Federal Debt

World War II, there was a considerable increase      have a material impact if the debt-to-GDP ratio
(299 percent) in inflation-adjusted federal gross    was used. Thus, prime ministers who served
debt, from $72 billion in 1938 (the year before      during recessions, or even the Great Depres-
Canada entered the war) to $286 billion in 1945.     sion, would be unfairly penalized, while others
Although federal gross debt fell in the years im-    who, through pure luck, served in expansions,
mediately after World War II, post-war debt          would benefit.
levels remained higher than pre-war levels.
                                                     There are several cases in which variations in
Starting in the late 1950s, federal gross debt
                                                     GDP growth affect the results. For example,
steadily increased until the mid-1990s. Follow-
                                                     consider the 8.1 percent economic growth in
ing Prime Minister Jean Chretien’s important
                                                     1935 during R.B. Bennett’s last year in office.
fiscal reforms, it began to decrease until 2008,
                                                     Debt as a share of GDP fell in that year by 1.2
when it again began to climb upward. The debt
                                                     percentage points, but that decrease was due
is expected to reach a historical high of $1.2
                                                     to economic growth, not a decline in debt. Debt
trillion (in 2017 dollars) in 2019.
                                                     increased in 1935 by 6.5 percent (in 2017 dollars)
Federal gross debt has generally increased over      and debt per person increased by 5.5 percent.
Canada’s history, but so has Canada’s popula-        Because population growth is less variable over
tion. The second adjustment to the debt data         time, adjusting by population provides a better
is to account for the growth in Canada’s popu-       metric of debt accumulation over each prime
lation since Confederation, which has gone           minister’s tenure since it is not as affected by
from 3.5 million people in 1867 to a projected       swings in the economy.6 For this reason, this
36.6 million in 2017 (Statistics Canada, 2017; Ur-   bulletin focuses on the measure of inflation-ad-
quhart, 1988). With a larger population, the debt    justed gross debt per person.
burden is spread over more people. To account
for this, the measure of debt used in this bul-
letin is inflation-adjusted gross (or total) debt    Debt per person from 1870 to 2019
per person.                                          Figure 2 displays federal debt per person, in
                                                     2017 dollars, from 1870 to 2019. This figure gives
An alternative method for measuring the
                                                     some historical context for the results present-
change in prime ministerial debt accumulation
                                                     ed in the next section, which specifies which
would examine changes in debt as a share of
                                                     prime ministers saw an increase or decrease
GDP, rather than per person. While the debt-
                                                     in debt per person over their tenure. While the
to-GDP ratio measures the ability of the gov-
                                                     general trend since Confederation has been
ernment to sustain a given amount of debt
                                                     towards higher per-person federal debt lev-
based on the income generated in the econ-
                                                     els, some periods are notable for their increas-
omy, using this metric would produce mis-
                                                     es or declines. For example, both World War I
leading results in several cases when assessing
changes in debt by prime minister. Unlike with
                                                     6
population, changes in economic output are             The population in Canada grew at an average
                                                     annual rate of 1.6 percent from 1867 to 2015. The
more variable year-to-year and are susceptible
                                                     standard deviation is 0.8 percentage points. The av-
to major shocks such as economic downturns           erage annual change in inflation-adjusted GDP is 3.8
or booms. Importantly, a recession is out of the     percent from 1871 to 2016. The standard deviation is
direct control of a prime minister but would         5.0 percentage points.

fraserinstitute.org                                                   FRASER RESEARCH BULLETIN 7
Prime Ministers and Federal Debt

Figure 2: Federal Gross Debt per Person, 1870-2019 (in $2017)

$40,000

$35,000

$30,000

$25,000

$20,000

$15,000

$10,000

 $5,000

     $0

Sources: Canada, Department of Finance (2017a, 2017b); Statistics Canada (2009a, 2009b, 2009c, 2009d, 2017); Urquhart,
1988; calculations by authors.

and World War II saw rapid increases in federal                under Jean Chretien initiated a period of debt
per-person debt. During World War I, federal                   reduction that continued under Paul Martin
debt per person increased from $1,752 in 1913                  and for the first two years of Stephen Harp-
to $4,926 in 1918. The increase was even greater               er’s tenure.7 By 2007, federal debt had fallen to
during World War II, where it rose from $6,423                 $24,260 per person. In 2008, the financial cri-
per person in 1938 to $23,666 in 1945. After both              sis in the United States triggered a recession
world wars, federal debt per person in Canada                  in Canada and federal debt once again began
declined for approximately a decade, but in nei-               to increase. It is expected to reach $30,915 per
ther case did it return to pre-war levels.                     person by 2019—higher than the level in 2007
                                                               but lower than the peak in 1995.
The next time there was a general increase
in federal debt per person was from the mid-
1960s to the mid-1990s. Federal debt grew from
$10,317 per person in 1966 to the historic peak
of $35,631 in 1995, a growth of 245 percent. As                7
                                                                 For a discussion about the fiscal reforms under
noted earlier, fiscal reforms in the mid-1990s                 Jean Chretien, see Clemens et al. (2017).

fraserinstitute.org                                                               FRASER RESEARCH BULLETIN 8
Prime Ministers and Federal Debt

Changes in federal debt per person by                   Table 3: Years and Amounts that (Real)
prime minister                                          Inflation-Adjusted GDP Declined,
Historical context is important in understand-          1870-2017
ing debt accumulation. For instance, as men-
tioned, federal debt increased rapidly during           Year    Percent      Sitting Prime Minister
the two world wars, as shown in figure 2. The                   decrease
prime ministers at the time, Sir Robert Borden
and William Lyon Mackenzie King, increased              1875    4.2%         Alexander Mackenzie
federal debt so that Canada could participate
significantly in the global conflicts. It would be      1876    1.7%         Alexander Mackenzie
unreasonable to simply conclude that these              1878    0.3%         Sir John A. Macdonald
prime ministers left a high debt legacy with-
                                                        1893    0.5%         Sir John Thompson
out acknowledging the role that the world wars
played in that debt accumulation.                       1894    0.5%         Sir John Thompson

Similarly, economic downturns, which are out            1908    4.6%         Sir Wilfrid Laurier
of the direct control of a prime minister, also         1914    6.8%         Sir Robert Borden
contribute to government debt accumulation.
The federal government collects less revenue            1917    1.1%         Sir Robert Borden
and increases its spending during an economic           1918    6.1%         Sir Robert Borden
downturn as Canadians make more use of gov-
                                                        1919    3.6%         Sir Robert Borden
ernment services such as Employment Insur-
ance.8 The result is often a budget deficit that        1920    0.5%         Arthur Meighen
requires the government to borrow and incur
                                                        1921    3.5%         Arthur Meighen
debt. While debt accumulated during an eco-
nomic crisis is not completely out of the con-          1929    0.2%         William Lyon Mackenzie King
trol of a prime minister and his or her govern-         1930    3.8%         William Lyon Mackenzie King
ment, the state of the economy does have to
be taken into consideration when assessing a            1931    13.5%        R.B. Bennett
prime minister’s legacy of debt.9                       1932    9.2%         R.B. Bennett
                                                        1933    7.1%         R.B. Bennett
8
  During an economic downturn, spending on pro-
                                                        1945    3.1%         William Lyon Mackenzie King
grams such as Employment Insurance automatically
increases because more people are making claims.        1946    1.0%         William Lyon Mackenzie King
Such spending, referred to by economists as “auto-
matic stabilizers,” differs from discretionary spend-   1956    0.7%         Louis St. Laurent
ing in which a government actively decides to spend
                                                        1982    3.2%         Pierre E. Trudeau
more or less money.
9                                                       1991    2.2%         Brian Mulroney
  Arguably major federal government undertakings
such as the construction of national railways under     2009    2.9%         Stephen Harper
Sir John A. Macdonald and Alexander Mackenzie
as well as the expansion of social programs under       Sources: Canada, Department of Finance (2017b);
Pierre Trudeau provide further context for increases    Urquhart (1988); calculations by authors.

fraserinstitute.org                                                     FRASER RESEARCH BULLETIN 9
Prime Ministers and Federal Debt
Economic downturns are measured using two Table 4: Canadian Recessions Since 1926
different methods. The first is to simply iden-
tify the years in which there was a reduction Years of recession Sitting Prime Minister(s)
in inflation-adjusted GDP—that is, the years in
which economic output shrank. Table 3 lists 1929-1933 William Lyon Mackenzie King/
the 23 years in Canada’s history in which there R.B. Bennett
was a year-over-year reduction in GDP, and 1937-1938 William Lyon Mackenzie King
which prime minister was in office at the time.
1947-1948 William Lyon Mackenzie King
The largest reductions in economic output took
place during the Great Depression under R.B. 1951 Louis St. Laurent
Bennett’s tenure. 1953-1954 Louis St. Laurent
However, this method may miss years where 1957-1958 John Diefenbaker
the economy had a downturn, yet where overall 1960-1961 John Diefenbaker
growth for the year was still positive. Such eco-
1974-1975 Pierre E. Trudeau
nomic situations may adversely affect federal
debt government accumulation. To account 1980 Pierre E. Trudeau
for this, the second measure uses the periods 1981-1982 Pierre E. Trudeau
of recession identified by Cross and Bergevin
1990-1992 Brian Mulroney
(2012) after 1926. Table 4 lists the years when a
recession took place and identifies the prime 2008-2009 Stephen Harper
minister who held office during those years.
Source: Cross and Bergevin (2012).
While there is overlap between tables 3 and 4,
the latter indicates that recessions as defined
by Cross and Bergevin (2012) took place during
John Diefenbaker’s tenure and Pierre Trudeau’s
shows the tenures in which a world war or
first tenure, which is not reflected in the annual
economic downturn did occur. An econom-
reduction rates in table 3.
ic downturn is defined as either (or both) a
year-over-year drop in GDP or a recession as
Percent change in federal debt per person by
defined by Cross and Bergevin (2012). There
prime minister
is a total of 23 prime ministerial tenures be-
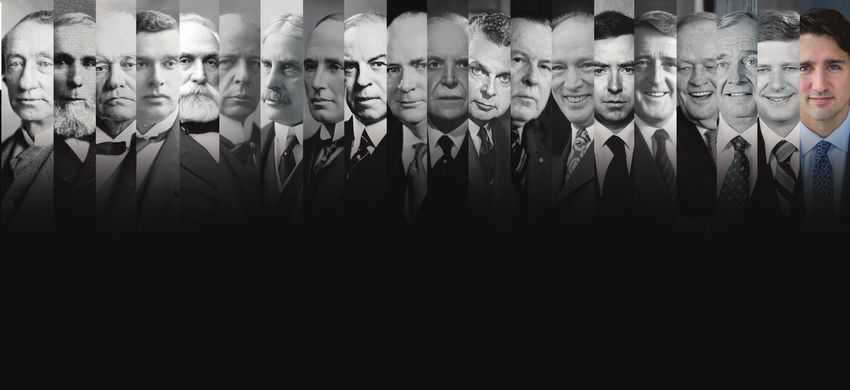
Figures 3a and 3b show the total percent cause three prime ministers had two non-
growth in inflation-adjusted federal debt continuous tenures in office.
per person over the tenures of the Canadian
prime ministers covered in this study. Spe- Of the 23 prime ministerial tenures, federal
cifically, figure 3a displays the prime ministe- debt per person increased in 14. All but three
rial tenures where a world war or economic cases of increases in federal debt per per-
downturn did not take place, while figure 3b son coincided with a world war, an economic
downturn, or both. As figure 3a shows, Justin
Trudeau is the largest debt accumulator (5 per-
in federal debt. However, unlike with economic
downturns and world wars, these prime ministers cent) of any prime minister who did not expe-
had more discretion in deciding to initiate spending rience a world war or an economic downturn
programs that contributed to their legacy of debt. during his tenure. He is followed closely by Sir
fraserinstitute.org FRASER RESEARCH BULLETIN 10Prime Ministers and Federal Debt
Figure 3a: Percent Change in (Inflation-Adjusted) Debt per Person over Prime
Ministerial Tenures Without a World War or Economic Downturn
Images: National Archives of Canada, Office of the Prime Minister and Wikipedia.
Figure 3b: Percent Change in (Inflation-Adjusted) Debt per Person over Prime
Ministerial Tenures With a World War or Economic Downturn
Images: National Archives of Canada, Office of the Prime Minister and Wikipedia.
fraserinstitute.org FRASER RESEARCH BULLETIN 11Prime Ministers and Federal Debt
Mackenzie Bowell, who also saw a 5 percent zie King’s second tenure10 (57 percent).11 How-
increase in per-person debt over his tenure. ever, Trudeau’s second term was marked by
Note that there is a difference of 0.03 per- economic downturns in Canada. Specifically,
centage points between Trudeau (4.73 percent) economic output fell by 3.2 percent in 1982.
and Bowell (4.70 percent). Sir John Abbott (an Cross and Bergevin (2012) identify two reces-
increase of 1 percent) is the third prime min- sions during his tenure (1980 and 1981-1982).
ister who increased federal debt outside of a
Other increases in inflation-adjusted debt per
global conflict or economic downturn. In con-
person during prime ministerial tenures range
trast, five of the eight prime ministers that did
from 6 percent (John Deifenbaker) to 48 per-
not experience a global conflict or economic
cent (Sir John A. Macdonald’s second tenure).
downturn during their tenures reduced fed-
Similar to William Lyon Mackenzie King, Sir
eral debt per person. This includes Liberal
John A. Macdonald reduced per-person debt
prime ministers Jean Chretien (-13 percent),
during his first tenure (-2 percent) despite in-
Paul Martin (-8 percent), and Lester Pearson
creasing it in his second tenure. Notably, there
(-6 percent).
was an economic downturn during Macdonald’s
Among the remaining prime ministers that did second tenure.
experience a world war or economic downturn Four prime ministers reduced federal per-per-
during their tenures (see figure 3b), Sir Rob- son debt despite experiencing an economic
ert Borden, the prime minister during World downturn during their tenures. Louis St. Laurent
War I, oversaw the largest percentage increase reduced federal debt per person by 34 percent
in debt per person by a wide margin. Over his and Sir Wilfred Laurier oversaw a reduction of 14
tenure, federal debt per person nearly tripled, percent. Notably, the percent reductions in both
increasing by 188 percent. Borden’s tenure not
only included World War I, but it coincided
10
with GDP falling in four out of the eight years Pierre Trudeau’s two tenures in office were inter-
rupted by a single year, with the victory and subse-
he was in office (1914, 1917, 1918, and 1919). The
quent defeat of Joe Clark in 1979. Pierre Trudeau’s
second largest percentage increase in debt tenures are separated to be consistent with the
per person took place during the second ten- method used for Sir John A. Macdonald and William
ure of William Lyon Mackenzie King (145 per- Lyon Mackenzie King. If Pierre Trudeau’s two ten-
cent), which also covered the period of Cana- ures are combined, debt per person increased by 126
da’s participation in World War II and multiple percent under him. (This total growth includes the 3
percent reduction under Joe Clark.)
economic downturns by both measures—two
years of falling GDP (1945 and 1946) and two 11
During Pierre Trudeau’s second tenure (1980-
recessions (1937/38 and 1947/48). It is notable 1984), a change in accounting practices meant that
that during Mackenzie King’s first tenure when debt from federally-owned crown corporations
were added to federal government debt. This is
there was no global conflict, federal debt per
reflected in the Fiscal Reference Tables, which item-
person fell by 5 percent.
ized an increase in the category of debt referred to
as "other liabilities" from $3.5 billion in 1982 to $29.5
The next highest per-person debt increase took billion in 1983. To ensure a consistent time series for
place during Pierre Trudeau’s second tenure Pierre Trudeau’s second tenure, the calculation for
and was less than half the increase of Macken- this tenure in figure 3 excludes “other liabilities.”
fraserinstitute.org FRASER RESEARCH BULLETIN 12Prime Ministers and Federal Debt
tenures is higher than the reduction during Worker Paper WP/197. International Mone-
Jean Chretien’s tenure (-13 percent), which did tary Fund.
not include an economic downturn. The two
remaining prime ministers who oversaw debt Clemens, Jason, and Milagros Palacios (2017).
Prime Ministers and Government Spending: A
reductions during their tenures despite global
Retrospective. The Fraser Institute. , as of October 11, 2017.
Conclusion Clemens, Jason, Milagros Palacios, Mathew Lau,
and Niels Veldhuis (2017). End of the Chretien
This bulletin has measured per-person fed- Consensus? Fraser Institute. , as of October 11, 2017.
tin Trudeau’s first term in 2019. By the end of
his term, Justin Trudeau is expected to be the Cross, Philip, and Philippe Bergevin (2012).
largest debt accumulator among prime min- Turning Points: Business Cycles in Canada
isters who did not experience a world war or since 1926. CD Howe Institute. , as of October
tenure. The only other two prime ministers to
11, 2017.
increase federal debt without fighting a world
war or experiencing an economic downturn are Di Matteo, Livio (2017). A Federal Fiscal His-
Sir Mackenzie Bowell and Sir John Abbott who tory: Canada, 1967-2017. The Fraser Insti-
both served in the late 19th century. tute. , as of August 17, 2017.
Canada, Department of Finance (2015). Budget Reinhart, Carmen, and Kenneth Rogoff (2010).
2015. Government of Canada. Growth in a Time of Debt. American Economic
Review 100, 2 (May): 573–78.
, as of October 11, 2017. Statistics Canada (2009a). Canada Year Book
Canada, Department of Finance (2017a). Fiscal 1940. Government of Canada. , as of October 11, 2017.
Statistics Canada (2009b). Canada Year Book
Canada, Department of Finance (2017b). Bud- 1950. Government of Canada. , as of October 11, 2017.
Statistics Canada (2009c). Canada Year Book
Chudik, Alexander, Kamiar Mohaddes, M. Hash- 1960. Government of Canada. , as of August 17, 2017.
fraserinstitute.org FRASER RESEARCH BULLETIN 13Prime Ministers and Federal Debt
Statistics Canada (2009d). Canada Year Book Charles Lammam is Director of Fis-
1967. Government of Canada. , as of August 17, 2017. and 390 original articles on a wide
range of economic policy issues. He
Statistics Canada (2017). Table 052-0005: Pro- holds an MA in public policy and a
jected Population, by Projection Scenario, Age BA in economics with a minor in
and Sex, as of July 1, Canada, Provinces and business administration from Simon
Territories, annual (persons x 1000). Gov- Fraser University.
ernment of Canada. , as
of August 17, 2017. Hugh MacIntyre is a Senior Policy
Urquhart M.C. (1988). Canadian Economic Analyst at the Fraser Institute. He
has co-authored numerous stud-
Growth 1870-1980. Discussion Paper No. 734.
ies on topics such as government
Queen’s University, Economics Department.
finances and government perfor-
mance. He holds an MSc in Politi-
cal Science from the University of
Edinburgh, a post-baccalaureate in
economics from Simon Fraser Uni-
versity, and an Honours BA from the
Acknowledgments University of Toronto.
This bulletin was inspired by the 2017 work
of Professor Livio Di Matteo and his analy-
sis of the finances of Canada over its his-
tory (A Federal Fiscal History: Canada, 1967-
2017) and related work by Jason Clemens
and Milagros Palacios (Prime Ministers and
Government Spending: A Retrospective). The
authors would like to thank Feixue Ren,
former Fraser Institute economist, for her
research assistance on this project. The
authors would also like to express their ap- Copyright © 2017 by the Fraser Institute. All rights
preciation to the anonymous reviewers who reserved. Without written permission, only brief pas-
provided invaluable feedback and sugges- sages may be quoted in critical articles and reviews.
tions, which improved the paper. Any re- ISSN 2291-8620
maining errors or omissions are the sole
Media queries: For media enquiries, please contact
responsibility of the authors. As the re-
our communications department via e-mail: commu-
searchers have worked independently, the nications@fraserinstitute.org; telephone: 604.714.4582.
views and conclusions expressed in this pa-
Support the Institute: call 1.800.665.3558, ext. 574
per do not necessarily reflect those of the
or e-mail: development@fraserinstitute.org
Board of Directors of the Fraser Institute,
the staff, or supporters. Visit our website: www.fraserinstitute.org
fraserinstitute.org FRASER RESEARCH BULLETIN 14You can also read