Road Safety Strategy 2017 2020 - Torbay Council
←
→
Page content transcription
If your browser does not render page correctly, please read the page content below
Road Safety
Strategy
2017 – 2020
Brixham                   *         Paignton                    *        Torquay
Contents

Foreword ................................................................................................................................................. 4

Executive Summary.................................................................................................................................. 5

Setting the Scene ..................................................................................................................................... 6
     Background ............................................................................................................................................... 6
     What is a Road Safety Strategy ................................................................................................................ 6
     Torbay Council’s Roles and Responsibilities? ............................................................................................ 6

Where we are Now? ................................................................................................................................ 7
     Casualty and Collision Data ...................................................................................................................... 7

Our Challenges ....................................................................................................................................... 12
     Who is Getting Killed or Seriously Injured? ............................................................................................. 12
     Why are Some Groups More at Risk?...................................................................................................... 15
     How are Road Traffic Collisions Occurring? ............................................................................................ 16

Where We Want to Be ........................................................................................................................... 18

Targets ................................................................................................................................................... 19
     1.        Smarter Working .......................................................................................................................... 21
     2.        Smarter Data Analysis.................................................................................................................. 21
     3.        Behaviour Change ........................................................................................................................ 22
     4.        Speed Management ..................................................................................................................... 22
     5.        Enforcement................................................................................................................................. 23
     6.        Making our Roads Safer ............................................................................................................... 25
     7.        Safety Audits ................................................................................................................................ 25
     8.        Monitoring and Evaluation .......................................................................................................... 25
     Funding Delivery of Road Safety Services ............................................................................................... 26

Partnerships........................................................................................................................................... 26
     1.        Learn 2 Live .................................................................................................................................. 27
     2.        The Peninsula Motorcycle Forum ................................................................................................. 27
     3.        Bikeability .................................................................................................................................... 28
     4.        Driver Training ............................................................................................................................. 28
     5.        School Crossing Patrols ................................................................................................................ 29

Road Safety Action Plan ......................................................................................................................... 31

Appendix 1 - Torbay Road Safety Audit Policy........................................................................................ 38

Appendix 2: Learn 2 Live ........................................................................................................................ 43

                                  A Road Safety Strategy for Torbay 2017 -2020                                                                                 2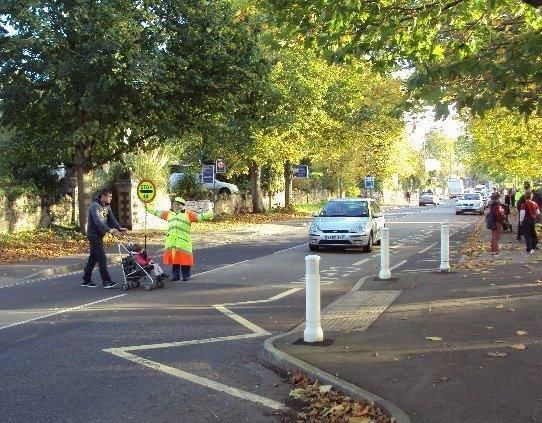
Brixham                  *        Paignton                   *        Torquay
Appendix 3 - School Crossing Patrol sites ............................................................................................... 44

Appendix 5 – Peninsula Road Safety Partnership (formerly the Devon and Cornwall Safety Camera
Partnership) ........................................................................................................................................... 45

Appendix 6 - Useful Contacts ................................................................................................................. 47

Appendix 7 - Road Safety – References and Contacts ............................................................................. 49

Appendix 8 - Glossary ............................................................................................................................ 50

                                 A Road Safety Strategy for Torbay 2017 -2020                                                                           3
Brixham * Paignton * Torquay
Foreword
Torbay Council will continue to improve the safety of all road users and, as a priority,
those who are the most vulnerable. e.g. pedestrians, cyclists and powered two wheelers.
This is reflected in 4 of the Targeted Actions as part of Torbay Council’s Corporate Plan.
Protecting all children and giving them the best start in life
Torbay Council will signpost road users to websites giving advice on Road Safety
training.
Torbay Council will continue to provide a School Crossing Patrol Service at
appropriate locations.
Promoting healthy lifestyles across Torbay
Torbay Council will offer Bikeability training to all primary schools.
Ensuring Torbay remains an attractive and safe place to live and visit
Torbay Council will signpost people through our website with regards to driving
behaviour as this continues to be the main cause of road collisions and traditional
engineering solutions will become more difficult to identify, more expensive and less
effective in reducing casualties.
Protecting and supporting vulnerable adults
Torbay Council will offer advice on the web site with regards to our ageing
population aiming to keep older drivers driving safer for longer.
A Road Safety Strategy for Torbay 2017 -2020 4
Brixham * Paignton * Torquay
Executive Summary
The Road Safety Strategy is a document, which sets out the Council’s response to the
government’s strategic framework for Road Safety (May 2011) which provides freedom
to act locally, but to also increase local accountability on delivery.
This document replaces the Torbay Council Road Safety Strategy 2013 – 2020 to take
account of changes to service provision that have resulted from budget reductions and
ongoing reviews of the service provided.
There are no national casualty reduction targets, but there are key indicators to 2030,
against which all local authorities will be compared.
Torbay Council has had consistent success in meeting its road safety targets. This has
been the result of a wide range of measures, including engineering measures, road
safety education and working with enforcement agencies to deal with identified issues.
The Council starts from a very low baseline when trying to reduce its casualties,
however benchmarking indicates that Torbay has some of the safest roads within the
South West.
In order to maintain this record, the implementation of the Road Safety Strategy will be
based around four key areas:
Education
Engineering
Enforcement
Encouragement
A Road Safety Strategy for Torbay 2017 -2020 5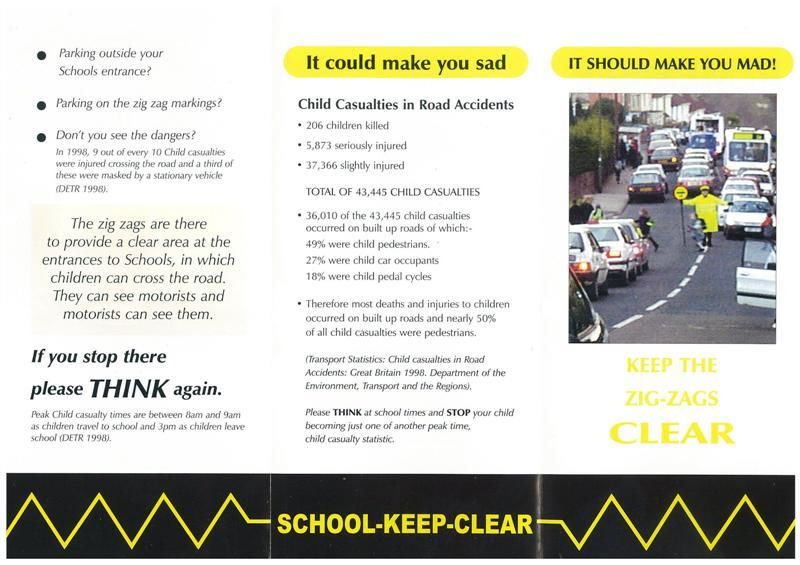
Brixham * Paignton * Torquay
Setting the Scene
Background
Torbay Council became a Unitary Authority in April 1998 and assumed responsibility as
the Highway Authority. In Great Britain, local highway authorities are responsible for
road safety on all roads except the motorway and trunk road network.
The Road Traffic Act was revised in 1988 and gave local authorities the duty to carry out
a programme of measures designed to promote road safety, including the dissemination
of information and advice relating to the road user and providing practical training to road
users.
Road Safety in Great Britain is a statutory responsibility for local Highway Authorities
with section 39 of the 1988 Road Traffic Act (9) placing a requirement to prepare and
carry out a programme of measures designed to improve road safety for all road users.
The role of Road Safety forms an integral part of the Highway Safety and Development
Traffic Team that operates within the Residents and Visitor Business Unit.
What is a Road Safety Strategy
A Road Safety Strategy is a document, which sets out the Council’s response to national
government policies and the needs of the local community. This is done by identifying
the means by which the Council intends to carry out these responsibilities.
Road safety is a concern of the whole community and as such, we are all responsible for
the reduction of road traffic incidents.
Torbay Council’s Roles and Responsibilities?
Torbay Council, through its elected representatives, its partnerships with other
organisations and agencies plays a vital role in co-ordinating the activities of a wide
range of groups within a shared set of aims and objectives.
In its active role as a Highway Authority, Torbay Council is responsible for
Carrying out studies into collisions arising out of the use of vehicles on roads
or parts of roads within their area;
Taking such measures, in the light of the results of those studies, as deemed
appropriate to present such, including the dissemination of information and
advice relating to the use of roads, the giving of practical training to road
users or any class or description of road users, the construction,
improvement, maintenance or repair of roads for which they are the Highway
Authority and other measures taken in the exercise of their powers for
controlling protecting or assisting the movement of road users;
A Road Safety Strategy for Torbay 2017 -2020 6
Brixham * Paignton * Torquay
When constructing new roads, taking such measures as appear to the
Authority to be appropriate to reduce the possibilities of such collisions when
the roads come into use;
The preparation and delivery of a programme of measures designed to
promote road safety and seek contributions towards the cost of measures for
promoting road safety taken by other authorities or bodies.
Where we are Now?
In March 2000 the Government announced new targets for reducing casualties
nationally. The targets were the percentage reductions to be achieved by 2010
compared with the average results for the base years, 1994 – 1998. The targets set by
the Government were as follows:
40% reduction in the number of people killed or seriously injured in road
crashes/collisions;
50% reduction in the number of children killed or seriously injured;
10% reduction in the slight casualty rate, expressed as the number of
people slightly injured.
Casualty and Collision Data
The following graphs outline the road casualty and collision data for the years 1998 to
2016 compared against the government targets (where applicable), which are validated
each year by the Department for Transport. This data only includes collisions that have
been reported to / recorded by Devon and Cornwall Police.
The Department for Transport’s definition of a collision recorded by the Police is as
follows:
[A collision that] involves personal injury occurring on the public highway (including
footways) in which at least one road vehicle or a vehicle in collision with a pedestrian is
involved and which becomes known to the police within 30 days of its occurrence. One
collision may give rise to several casualties. Please note “Damage-only” collisions are
not included in this publication.
Department for Transport Definitions:
Fatal collision: A collision in which at least one person is killed.
Serious injury: An injury for which a person at least one person is detained in
hospital as an “in-patient”, or any of the following injuries whether or not they are
detained in hospital: fractures, concussion, internal injuries, crushings, burns
(excluding friction burns), severe cuts, severe general shock requiring medical
treatment and injuries causing death 30 or more days after the accident.
Slight injury: An injury of a minor character such as a sprain (including neck
whiplash injury), bruise or cut which are not judged to be severe, or slight shock
A Road Safety Strategy for Torbay 2017 -2020 7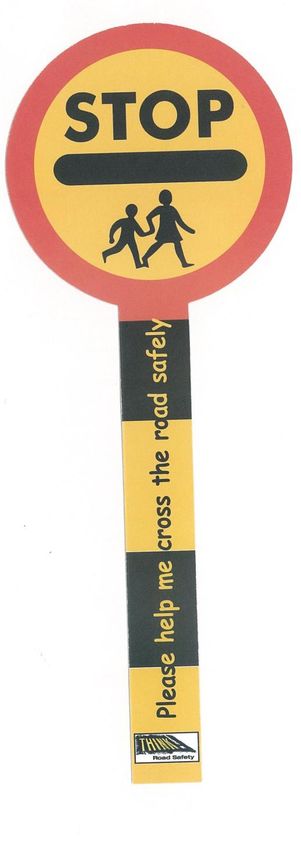
Brixham              *      Paignton              *      Torquay
                                             requiring roadside attention. This definition includes injuries not requiring medical
                                             treatment.

                                 Fatalities
                                 Fig 1 shows the number of fatalities that have occurred within Torbay

                                                                                Figure 1 - Fatalities (all ages)

                         5
                                                                                                                                                               Fatal All

                         4

                         3
No of Fatalities

                         2

                         1

                         0

                        -1
                               1998   1999   2000   2001   2002   2003   2004   2005   2006   2007    2008   2009   2010   2011   2012   2013   2.014   2015    2016
                   Fatal All     3      1      1      0      3      2      3      2      2      4       3      3      1      1      3      2      1       0       3

                                                                                               Year

                                 The average figures remain at a consistent overall level, since the 1998 to 2010 targets
                                 were introduced. Torbay continues to have one of the safest road networks within the
                                 South West. Torbay Council benchmarks with other highway authorities and the number
                                 of road traffic casualties expressed as a percentage of the population is amongst the
                                 lowest in the south west.

                                                            A Road Safety Strategy for Torbay 2017 -2020                                                  8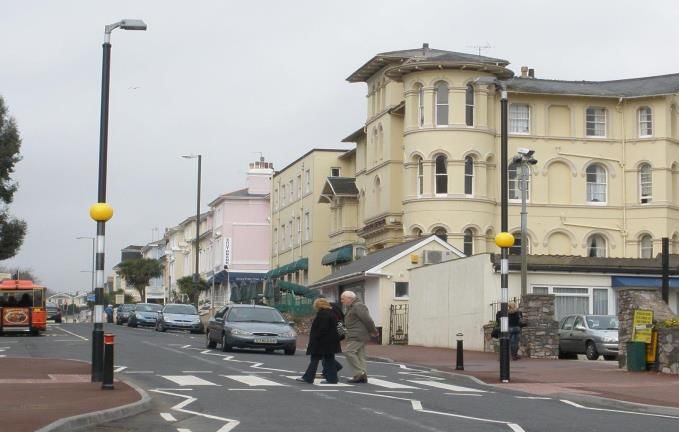
Brixham          *      Paignton             *     Torquay

                   Killed and Seriously Injured (KSI’s) (all age groups)

                                Fig 2 shows the number of people killed or seriously injured within Torbay.

                                                      Figure 2 - Killed and seriously injured (K.S.I.)
                                                                         (all ages)

                           60
                                                                                                          KSI All
                                                                                                          Target KSI All

                           50

                           40
No. of K.S.I's

                           30

                           20

                           10

                            0
                                  1998 1999 2000 2001 2002 2003 2004 2005 2006 2007 2008 2009 2010 2011 2012 2013 2014 2015 2016
                 KSI All           45   54   48   34   33   37   26   37   41   37   36   29   31   30   39   53   43   39   45
                 Target KSI All    46   45   43   42   40   39   37   36   34   33   31   30   28

                                                                                   Year

                                Whilst the Council finished the Department for Transport (DfT) monitoring period
                                just above the 10 year target with a 33% reduction, it continues to show a
                                general downward trend from the 1998 baseline.

                                Torbay Council continues to work from very low base figures and significant
                                reductions can be very hard to identify. Collision data is investigated every year
                                as part of our cluster review, where we carry out a study of all the road traffic
                                collisions that have resulted in a person being injured and all known collision hot
                                spots across the bay area. This information is reported annually to members as
                                part of the Road Safety initiatives Report. See Making Our Roads Safer page 25.

                                             A Road Safety Strategy for Torbay 2017 -2020                                  9
Brixham               *        Paignton             *        Torquay

                        Killed and seriously injured (0 – 15 age group)

                                    Fig 3 shows the number of 0-15’s killed or seriously injured within Torbay.

                                                                Figure 3 - Killed and seriously injured (K.S.I.)
                                                                            (0 - 15 year age group)

                                          20
                                                                                                                                      KSI Child (0-15)
                                          18
                                                                                                                                      Target KSI Child (0-15)
                                          16

                                          14
No. of Child K.S.I's

                                          12

                                          10

                                          8

                                          6

                                          4

                                          2

                                          0
                                                 98   99   00     01   02       03   04   05   06    07       08   09   10   11   12      13    14   15           16
                       KSI Child (0-15)          6    10   3      4     2       5     3   11   6     5        3     0   4    5    1       5     3        3        2
                       Target KSI Child (0-15)   6    6    6      5     5       5     5   4    4     4        4     3   3

                                                                                                    Year

                                    Whilst the Council finished the Department for Transport (DfT) monitoring period
                                    just above the ten year target, the figures for this age group fluctuate from 11 in
                                    2005 to zero in 2009.

                                    Torbay Council continues to work from very low base figures and significant
                                    reductions can be very hard to identify. Collision data is investigated every year
                                    as part of our cluster review, where we carry out a study of all the road traffic
                                    collisions that have resulted in a person being injured and all known collision hot
                                    spots across the bay area. This information is reported annually to members as
                                    part of the Road Safety initiatives Report. See Making Our Roads Safer page 25.

                                                      A Road Safety Strategy for Torbay 2017 -2020                                                           10
Brixham * Paignton * Torquay
Slight Injuries
Fig 4 shows the slight injuries for all ages and the 0-15’s within Torbay
Figure 4 - Slight injury accidents
(all ages above, child 0 - 15 below)
500
450
400
No. Slight casualties
350
300
250
200
150
100
50
0
1998 1999 2000 2001 2002 2003 2004 2005 2006 2007 2008 2009 2010 2011 2012 2013 2014 2015 2016
Slight All 425 420 402 390 359 315 446 489 429 417 427 359 396 349 367 311 320 334 315
Target Slight All 445 441 438 434 430 426 423 419 415 412 408 404 401
Slight Child (0-15) 83 82 67 66 61 49 58 38 51 54 41 44 39 29 47 42 24 23 31
Target Slight Child (0-15) 83 82 82 81 80 80 79 78 77 77 76 75 75
Year
All ages
The Council’s figures finished the Department for Transport (DfT) monitoring
period in 2010 just below the 12 year target. However we continue to show a
general downward trend from the 1988 baseline of 445, with a current reduction
of 29%.
Children (0-15 age group)
The Council figures finished the Department for Transport (DfT) monitoring
period well below the 12 year target.
These figures can be explained by an improved data processing regime and
successful road safety education campaigns, e.g. the number of rear seat
passenger casualties reduced by 75% in 2011.
A Road Safety Strategy for Torbay 2017 -2020 11Brixham * Paignton * Torquay
Our Challenges
Who is Getting Killed or Seriously Injured?
Fig 5 shows casualties in Torbay for the ten year period 2007 – 2016, displayed by age and
category. This shows that whilst collisions involving both the 16 to 24 year-old age group and the
powered two wheelers are falling, those involving the 65 to 99 age group are on the increase.
This increase is also shown nationally, where the population in the over 60 age group has
increased by 6% compared with the 2010-2014 average and by 19% compared with 2006.
40
35
Percentage based on Casualties
30
0 to 15
25
16 to 24
65 to 99
20
P2W
Pedestrians
15
Pedal
10
5
0
2007 2008 2009 2010 2011 2012 2013 2014 2015 2016
Car drivers aged 16–19 have the highest risk of being killed with drivers aged 60–69
having the lowest risk.
Young drivers risk of being killed has fluctuated, while the risk has reduced for all other
age groups of drivers.
Nationally, 95% of pedestrian injuries occur on urban roads, with children being
disproportionally at risk, 22% of killed and seriously injured pedestrians are between 8
and 15 years old. National evidence also shows that children in deprived areas have an
elevated risk of injury and death compared with children in more affluent areas.
The risk of older pedestrians being killed is much higher than for other age groups
because of age-related frailty.
A Road Safety Strategy for Torbay 2017 -2020 12Brixham * Paignton * Torquay
Fig 6 Fig 7
Torbay 3 year average casualties by age National 3 year average casualties by age
12% 12%
14% 12%
Children: 0-17 Chi l dren: 0-17
years yea rs
Adults: 18-59 Adul ts : 18-59
60 and Over 60 a nd Over
74% 76%
Figures 6 and 7 show that the casualty figures recorded for Torbay over the last three
years are very much in line with the national average.
Fig 8
Torbay Casualties by Age: 10 years 2007 - 2016
85+
75-84
65-74
55-64
Age Group
45-54 Female
35-44 Male
25-34
16-24
6-15Brixham * Paignton * Torquay
A ten year survey of casualties by age, shows that across the Torbay area the largest
number of casualties continue to be in the 16-24 age group, with male casualties
outnumbering female casualties by 61% to 39%.
This continues to be the largest discrepancy between genders which, as the casualty
ages increase, narrows considerably.
Fig 9
Top 10 Contributory Factors (10 Years KSI)
Exceeding speed limit
Failed to judge other persons path or speed
Inexperienced or learner driver/rider
Stationary or parked vehicle
Casualties
Travelling too fast for conditions
Careless/Reckless/In a hurry
Poor turn or manoeuvre
Loss of control
Failed to Look Properly (Pedestrian)
Failed to Look Properly (Driver/rider)
0 5 10 15 20 25 30 35
Number of Collisions
A ten year survey of collisions across the Torbay area, which resulted in killed or
seriously injured casualties, shows that the most common contributory factor recorded
by the Police is ‘failed to look properly’ for driver, rider or pedestrian related collisions.
However this may be due to the way officers record collisions, as there may be little
difference between ‘failed to look properly’ or ‘poor turn or manoeuvre’.
Approximately half of the English police forces adopted the CRASH (Collision Recording
and Sharing) system for recording reported road traffic collisions at the end of 2015 or
the first part of 2016. Devon and Cornwall Police switched in December 2015. In
CRASH, the Police officer records the type of injuries suffered by the casualty rather
than the severity (severity is measured simply as ‘slight’ or ‘serious’). The system then
automatically converts the injury type to a severity classification.
The early indications are that switching to CRASH has added between 5 and 15 per cent
to the Great Britain total for serious injuries and more detailed research has been
commissioned to provide guidance to users in understanding these effects and to
produce adjusted back-estimates of already published severity based data. This will
enable the Department for Transport (DfT) to produce consistent time series which are
independent of the reporting system used.
A Road Safety Strategy for Torbay 2017 -2020 14Brixham * Paignton * Torquay
Why are Some Groups More at Risk?
National research suggests that in every collision involving a fatality, there is around a
50% chance the driver responsible for the collision had a criminal record (DfT 2011).
Furthermore, recent analysis of 2001–04 UK road traffic collisions shows a link between
the low socio-economic status of car occupants and the fatality risk at both an individual
area level (individual socio-economic classification) and area level (using area-based
deprivation scores and police data).
Overall, it shows that car occupants from lower socio-economic groups are
overrepresented in fatalities; while three times as many people are classified in the top
two social groups as are in the lowest social group (40% compared with 13%), they each
account for a similar proportion of fatalities (22% and 20%, respectively).
The analysis also raised a number of key issues which may affect an increase in
collisions/injuries in areas of social deprivation, these are as follows:-
Speed
Impairment (alcohol and drugs)
Seat belt wearing
Licence violations
Insurance violations
Torbay, like many other seaside resorts has areas of deprivation – poverty, poor housing
and health are worse than the national average with 15,000 residents living in conditions
similar to the worst 10 per cent in England in terms of poverty, housing and health. In
2015 Torbay was ranked the 71st most deprived area out of 354 in England.
More data analysis and investigations will need to be undertaken in an effort to
understand the current problems within the deprived areas of the bay and to develop a
method of connecting with and passing on the road safety message to this vulnerable
group.
Older Road Users
Torbay is home to more older people than average and these numbers are increasing at
both ends of the social spectrum.
Older people from more deprived backgrounds are less likely to have access to a car,
thereby increasing their reliance on walking and public transport. However, there are
large numbers of the elderly population who wish to demonstrate their independence by
continuing to drive and unfortunately this is reflected in the collision figures. It is for this
reason that Torbay Council, in conjunction with their partners, developed the ‘Drive Safer
For Longer’ project.
Unemployment and the number of people who claim housing benefits is high. The local
economy relies on tourism for many jobs and this contributes to seasonal employment
and low wages.
A Road Safety Strategy for Torbay 2017 -2020 15Brixham * Paignton * Torquay
More people in these areas smoke and drink too much and have poorer physical and
mental health. There is more crime, particularly violence in the home and for a variety of
reasons; people from poorer areas attend hospitals for treatment more often.
Although there is no current robust evidence to ‘prove’ the case, it seems likely that
these factors may influence to contribute to the injury risk faced by children in these
areas in a number of ways.
For example, parents/carers may be less able to supervise their children, less aware of
the risks and less able or disposed to access information and services to address these
risks.
In addition, the lack of play space within the house may mean that children need to play
out in the streets more than in other types of household or in other areas (Towner et
al.,2005).
Older People – Torbay is home to more old people than average and these
numbers are increasing at both ends of the social spectrum.
While there is some evidence nationally of higher rates of pedestrian injuries (Lyons
et al., 2003) among older people in disadvantaged areas, large gaps in knowledge
exist that need to be addressed to enable proper programme planning and
intervention to understand and address this.
How are Road Traffic Collisions Occurring?
Government campaigns would appear to suggest that speed is the number one
causation factor in collisions. However when drivers exceed the limit this accounts for
only 13.9 per cent of fatal collisions. Whilst a larger causation factor 15.9 per cent in fatal
collisions are going too fast for the circumstances.
The largest causation of road collisions in the UK today is driver error or reaction in more
than 65 per cent of fatal crashes with. The most common causation factor is failing to
look properly (the SMIDSY factor – "Sorry mate, I didn't see you”, is relevant in 20.5 per
cent of fatals involving driver error), closely followed by "loss of control”.
Second largest causation of fatal road traffic collision is going too fast for the
circumstances 31 per cent.
Historical national programmes have concentrated on speed as a primary causation
factor and speed data over a number of years has shown that average speeds,
especially within the urban (30mph) areas are coming down, indicating that the
measures taken are having some positive effects. Speed continues to be a primary
causal and secondary contributory factor to both numbers and severities of collisions,
albeit with an improved trend.
Third largest causation is behaviour or inexperience (28 per cent) which includes
careless, reckless, or inexperienced driving.
The fourth main category is "impairment or distraction" (to blame for 19.6 per cent of
fatal accidents) covering "alcohol" (a factor in 9.6 per cent of fatal accidents) and
"distraction in vehicle" (2.6 per cent).
A Road Safety Strategy for Torbay 2017 -2020 16Brixham * Paignton * Torquay
Pedestrian only, casualty or injury collisions account for more than 18 per cent of
collisions, with 10 per cent "failing to look properly".
Age is a factor. Older drivers more frequently fail to look properly while younger road
users are more likely to be going too fast, either for the limit, or the conditions.
Time of day is equally important; between 7pm-7am 'loss of control' is the key factor
while at other times, it is the 'failed to look properly'. Motorists are more likely to be
'distracted or impaired' at weekends
A Road Safety Strategy for Torbay 2017 -2020 17Brixham * Paignton * Torquay
Where We Want to Be
From 2017 and for the years ahead, it remains the intention for the development and
implementation of local road safety strategies to enhance delivery by focussing on
casualty reduction with objectives and targets to support that aim together with
engineering programmes planned to achieve that and thus improve casualty reduction.
The development of a local road safety strategy is included within the current Local
Transport Plan 3 (2011 – 2026), to ensure greater reductions in road casualties
locally by:
Encouraging better and co-ordinated working between local authorities
and their partners;
Enabling local authorities to consider their future priorities;
Involving and informing the public.
Road Safety is of paramount importance to both the Council and the residents it serves.
Road safety issues are wide ranging and sometimes complex, but the Council has a
good record in improving road safety for all road users.
An evidence based approach to road safety engineering will be used in Torbay, where
the population varies so much between the summer and winter periods, to identify and
target investment where it is most needed.
This Road Safety Strategy will reflect local road safety requirements, taking into account
the most up-to-date Government recommendations, guidance, targets and strategies.
Unlike the period up to 2010, the Department for Transport (DfT) have not set any
targets for us to compare our results against which to compare.
However the DfT have published their Strategic Framework for Road Safety (May 2011)
designed to help Government, local organisations and citizens monitor progress in
improving road safety.
The DfT have identified 6 key indicators which relate to road fatalities and will measure
the key outcomes of the strategy at national level. These are:
Number of road deaths (and rate per billion vehicle miles)
Rate of motorcyclist deaths per billion vehicle miles
Rate of car occupant deaths per billion vehicle miles
Rate of pedal cyclist deaths per billion vehicle miles
Rate of pedestrian deaths per billion miles walked
Number of deaths resulting from collisions involving drivers under 25.
At a local level in Torbay, the number of road deaths is small and subject to fluctuation.
For this reason the DfT propose the following as key indicators:
Number of killed or seriously injured casualties
Rate of killed or seriously injured casualties per million people
Rate of killed or seriously injured casualties per billion vehicle miles
A Road Safety Strategy for Torbay 2017 -2020 18Brixham * Paignton * Torquay
The progress will be reported annually, with details published in ‘Reported Road
Casualties Great Britain’. The form of presentation has yet to be decided but it is likely
that this will include, where appropriate, use of rolling averages and percentage changes
to monitor progress.
Enabling local authorities to consider their future priorities;
Involving and informing the public.
At a local level, here in Torbay, the Council will also continue to report casualty figures
for the following categories each year as part of the Road Casualty Reduction Report.
Fatal
Killed and seriously injured
Killed and seriously injured (0 – 15 years-old)
Slightly injured
Slightly injured (0 – 15 years old)
Seven key areas have been identified as priorities for Torbay.
Pedestrian casualties
Motorcycle casualties in particular young scooter riders and riders on lager sports
bikes.
Careless or dangerous road user behaviour
Illegal and inappropriate use of speed.
Vulnerable Young Females
Older Drivers
Driving behaviour continues to be the main cause of road collisions and traditional
engineering solutions will become more difficult to identify, more expensive and less
effective in reducing casualties.
Targets
In the 10 year period up to 2020 Torbay Council intend to make reductions of:
• 25% to all KSI casualties
• 33% to collision casualties which are fatal, permanently disabled as a result, or
where major medical care is required to prevent permanent disability or death.
• 10% to collisions resulting in Slight injuries
• 25% to collisions involving pedestrians
• 25% to casualties resulting from Powered Two Wheelers (PTW). The figures will
take into account changes to levels of ownership of LA Registered PTW.
• 25% to all casualties resulting from collisions involving drivers/riders aged 17 to
24.
A Road Safety Strategy for Torbay 2017 -2020 19Brixham * Paignton * Torquay
Proposed Target
Figure 11 - Killed and seriously injured (K.S.I.)
(all ages)
60
50
40
No. of K.S.I's
30 KSI All
Target KSI All
20
10
0
2010 2011 2012 2013 2014 2015 2016 2017 2018 2019 2020
The target is to reduce all killed and seriously injured (KSI) casualties by 25% in the next
10 years, using a 2010 baseline average of 2006 – 2010.
Figure 12 - Proposed Target Slight injury collisions
(all ages)
450
400
350
No. Slight casualties
300
250
Slight All
200
Target Slight All
150
100
50
0
2010 2011 2012 2013 2014 2015 2016 2017 2018 2019 2020
The target is to reduce all slight injury collisions by 10% in the next 10 years, using a
2010 baseline average of 2006 – 2010.
A Road Safety Strategy for Torbay 2017 -2020 20Brixham * Paignton * Torquay
How We Will Get There
Most collision clusters and challenging stretches of road have been improved and the
safety return on engineering interventions and vehicle safety systems is beginning to
flatten out. Torbay Council will signpost road users to web sites in order to continue to
deliver road safety reductions however, the main focus will encompass engineering
works and signposting road users to educational information based websites.
To do this Torbay Council will develop:
1. Smarter data analysis making use of new databases to understand what groups
are most at risk and also how socio-demographic and lifestyle factors contribute.
2. Signposting road users to Road Safety Education and training programmes via
our website at www.torbay.gov.uk/roads/road-safety/
3. Road safety audit policies that minimise the likelihood of new road safety risks,
inadvertently arising from the building of new roads or highway improvements.
1. Smarter Working
Key to the success of this strategy is strengthening existing partnership working with
other departments within Torbay Council to ensure road safety is integrated with other
objectives contributing to wider local priorities.
The Council recognise that there are work streams within the partnerships with
complimentary aims and objectives, where resources could be shared and programmes
pulled together to achieve joint outcomes.
At a more localised level, ensure the road safety engineering interventions are
consistent.
2. Smarter Data Analysis
Effective road safety planning depends on reliable evidence of the real problems, along
with the identification of both long and short term trends. Torbay Council needs to
understand when and where collisions occur, who is involved and what the
consequences are. The Council are developing a more sophisticated approach, using
new databases.
Torbay Council will use MAST, an innovative web based data analysis tool for road
safety professionals to gain an insight into collisions and the people involved with them.
Mast draws data from two main sources:
National road collision and casualty information from the Police and Department
for Transport.
Socio-demographic insights into the communities most at risk of becoming
involved in crashes using ‘Mosaic Public Sector’, a database which focuses on
the needs of citizens, which provides a detailed and accurate understanding of
each citizens location, their demographics, lifestyles and behaviours.
A Road Safety Strategy for Torbay 2017 -2020 21Brixham * Paignton * Torquay
We will carry out an annual data review to ensure that resources are appropriately
targeted making us more responsive to shifting trends and allowing us to refocus quickly.
3. Behaviour Change
The Department for Transport forecast diminishing casualty reduction returns from
engineering interventions, so signposting road users towards education and more
enforcement measures will need to be stepped up to respond to the need for behaviour
change.
In addition to the traditional road safety aspects of engineering, education and
enforcement, Torbay also uses encouragement in the quest to reduce road traffic
casualties. By encouraging more people to walk or cycle instead of driving, this makes
the promotion of safety for more vulnerable road users as well as the responsible and
considerate behaviour of drivers, even more important.
Road safety publicity campaigns raise public awareness that road traffic collisions do not
just happen, rather they are caused. Public awareness campaigns can help to influence
the attitudes and behaviours that cause collisions. They also create public acceptance
for safety engineering and police enforcement and they give national focus and context
for local initiatives aimed at making the roads safer.
In the case of children and young people, we are trying to influence the formation of
habits, whereas with adults we are trying to persuade people, mainly drivers, to change
often deeply entrenched habits.
However, issues such as drink-driving and speeding need to be kept firmly in the public
consciousness to remind people of the possible consequences of reckless driving and
how simple steps can improve safety.
4. Speed Management
Research shows a strong link between speed and road casualties. Much of this
evidence has been demonstrated by studying the average speed of traffic. Studies show
how each 1mph reduction in average speed can reduce the number of collisions by 5 %.
The three most important issues to tackle are: -
Speeding in urban areas where there are high numbers of vulnerable
road users.
Speeding in rural areas where the problem is often inappropriate speed,
rather than one of exceeding the speed limit.
The most extreme speeds when the speed limits are exceeded by a
considerable margin.
There is a wide range of speed reduction measures available, including active
management, using a range of measures including engineering and enforcement
approaches. Members have agreed the implementation of 20mph speed limit schemes
(both permanent and variable) outside educational establishments across the bay area
and following completion of this programme, have given officers a remit to investigate
the possibility of similar schemes in residential areas.
A Road Safety Strategy for Torbay 2017 -2020 22Brixham * Paignton * Torquay
As well as the targeted efforts acting on the basis of collision data, speed has both a
direct and indirect impact on the health of communities and the fear of harm can have
negative health consequences for residents, even if injury collisions have not occurred.
For this reason some safety camera activity is directed to more extreme areas of
violation, but residents are also able to participate in volunteer programmes such as
‘Community Speedwatch’ which provide a valuable educational intervention and further
intelligence.
5. Enforcement
The Department for Transport’s strategic framework for road safety recognises that more
than half of road deaths are associated with one or more of drink driving, driving whilst
impaired by drugs, speeding and careless driving (including dangerous driving, driving
with a distraction and not wearing seatbelts). The Framework also states that driving
without insurance or a licence is also associated with a disproportionate level of death
and injury.
The Governments intention is to target enforcement and sanctions better, with an
increased focus on educational courses for low level offences.
The authority will tackle those locations where traffic speed is a problem through the
most appropriate of the following interventions:
Careless driving, dangerous driving
Speeding
Driving while distracted (e.g. use of mobile phones to talk or text)
Not wearing a seat belt
Driving unlicensed/uninsured
Devon and Cornwall Police continue to be the main enforcement agency for driving
offences. However, since the decriminalisation of parking in 2004, the authority have
been able to take action against most parking offences including parking on yellow lines
and stopping on “School Keep Clear” markings. We will also continue to use other
powers which impact on road safety, such as those to cut back overhanging trees and
bushes, the removal of illegal signs and abandoned vehicles.
The authority will tackle the locations where the speed of traffic is a problem through the
most appropriate of the following interventions.
Speed enforcement via the Peninsula Road Safety Partnership (formerly the
Devon and Cornwall Safety Camera Partnership) via their network of fixed and
mobile safety cameras.
Fixed and mobile safety cameras
Physical traffic calming measures or other engineering solutions
Permanent vehicle activated signs
Community Speed Watch
20mph speed limits where appropriate
A Road Safety Strategy for Torbay 2017 -2020 23Brixham * Paignton * Torquay
The Peninsula Road Safety Partnership
Safety Camera operation in Torbay is operated through the Peninsula Road Safety
partnership, which is made up of the following organisations:
Devon and Cornwall Constabulary
Devon County Council
Cornwall Council
Devon & Somerset Fire and Rescue
Highways England
Her Majesty’s Courts Service
Plymouth City Council
Torbay Council
If detected, drivers who choose to exceed the legal speed limits will incur a minimum
penalty of £100 and three penalty points on their driving licence. Penalty points are valid
for a period of three years but cannot be removed from your licence until four years have
elapsed.
Alternatively drivers detected at lower speeds and whose offences fall within the criteria,
will be offered the option of attending a Speed Awareness course as an alternative to the
Fixed Penalty process (three penalty points and a £100 fine).
Named drivers are only permitted to attend one Speed Awareness course within a three-
year period. If a named driver subsequently commits a further speeding offence, then
that offence will be dealt with via the Fixed Penalty or Court process. Drivers attending
the course will not be required to pay the fine or receive penalty points provided the
course is successfully completed. However, those offered the Speed Awareness course
will be required to pay a course fee of £85.
It has been proved nationally that safety cameras can reduce the number of road
collisions and protect road users by encouraging people to drive more slowly.
Enforcement is undertaken using a variety of systems including Fixed Camera Sites and
Mobile Safety Camera Units
Camera Data
On 27th June 2011 the Road Safety Minister wrote to Chief Executives of local
authorities instructing them to publish data relating to fixed speed camera enforcement
sites and to identify a website location where information on annual ‘crash and casualty
data’ will be published.
Collision and speed data on individual sites has always been made available by the
Partnership on request, where the cost of collation has not been excessive. However
data is now accessible via the internet, with site specific data available when the user
clicks on the “camera watch” map at the following link.
http://www.prsp.org.uk/cameraWatch/index.aspx
A Road Safety Strategy for Torbay 2017 -2020 24Brixham * Paignton * Torquay
6. Making our Roads Safer
When identifying local safety schemes, Torbay will continue to ensure that budgets are
targeted to achieve the maximum reduction in road traffic casualties. To help us
establish those schemes, every 12 months we continue to carry out a study of all the
road traffic collisions that have resulted in a person being injured and recorded by the
Police and all known collision hot spots in the Bay. As a result, the difficult task of
prioritising the locations for safety improvement projects is determined.
The local safety scheme programme has three main elements:
Single sites – A single location, for example: a junction of two roads or a place
where pedestrians cross.
Routes – Collision data for key routes across the borough is looked at to
highlight those roads or sections of road which experience a higher than
expected number of collisions and casualties.
Areas – At times, the single site and route studies may indicate that a local area
or a network of roads could be investigated as a whole.
To achieve a greater overall reduction in collisions and casualties it may be appropriate
to consider one area-wide scheme rather than one or more smaller schemes.
7. Safety Audits
Road safety audits are undertaken on highway schemes at various stages of their
design and construction to ensure that they will not create future highway safety
problems. The road safety audit process is used to help achieve this by scrutinising
changes to the road network within the borough, to ensure that they are as safe as
possible. Post completion audits are also undertaken on some schemes to check that a
completed scheme does not create any safety hazards.
However, the Institution of Highways and Transportation Guidelines allows scope for
individual highway authorities to adopt their own policies to set the level of audit they
undertake locally, provided that they have a clear policy in place. The likelihood of a
scheme having the potential to create future collisions is linked to the size and
complexity of the scheme and we need to prioritise our resources to ensure they are
being used effectively. Torbay have developed our own safety audit policy in line with
the advice from the Institution of Highways and Transportation. (See Appendix 1)
8. Monitoring and Evaluation
Monitoring and evaluating our projects will help us assess how well we are doing and aid
continuous improvement. It is about asking what has happened, what has worked and
what has not worked. To monitor the impact of programmes our evaluation will include
changes in behaviour, attitudes, knowledge and/or skills. The knowledge we gain will
enable us to create more effective programmes in the future and spend budgets in the
best way. Monitoring the progress and effectiveness of road safety engineering.
A Road Safety Strategy for Torbay 2017 -2020 25Brixham * Paignton * Torquay
Funding Delivery of Road Safety Services
The outcome of the Government’s 2010 autumn spending review led to a reduction in
the funding made available to local authorities, the fire service and the police. This has
provided Torbay with increased challenges and the need for more focused ways of
working.
Throughout this strategy we have identified proposals which we believe will provide
more efficient ways of working:
Smarter partnership working, drawing together the various work streams of
enforcement.
Better co-ordination of work programmes
Improved evaluation and monitoring in order that we gain knowledge to create
more effective engineering programmes in the future.
Contained within the Local Transport Plan Implementation Plan (2016/17 – 2020/21) are
details of the committed budgets which includes Road Safety Initiatives. This information
is shown under the heading of Safety / Congestion / Engineering Work.
This budget will allow for a number of small minor road safety engineering schemes
each year. Any larger schemes will need to be considered as separate business cases
as part of the authority’s capital budget setting process.
We will also, when appropriate, require developers to contribute through section 106
agreements and direct works on the Highway through Section 278 agreements to
include or contribute towards road safety improvements.
In addition, there are occasional opportunities, to submit bids for funding to the
Department for Transport and other organisations for specific projects and initiatives.
Partnerships
Torbay Council continues to work with the following partnership organisations:
Devon and Cornwall Police
Devon and Somerset Fire and Rescue Service(DSFRS)
Health Authority
Learn 2 live young driver/rider partnership project
Peninsula Roads Safety Partnership (formerly the Devon and Cornwall Safety
Camera Partnership)
The Peninsula Motorcycle forum
As well as the other local authorities within the South Western peninsula:
Cornwall County Council
Devon County Council
Plymouth City Council
A Road Safety Strategy for Torbay 2017 -2020 26Brixham * Paignton * Torquay
1. Learn 2 Live
Learn 2 Live is a partnership of Local authorities and Emergency services:-
Devon County Council
Torbay Council
Devon and Somerset Fire and Rescue service
Devon and Cornwall Constabulary
Highways England
South western Ambulance Service Trust
Learn 2 Live began in October 2007. It was based on a road safety presentation by
South Yorkshire Fire Brigade. The first local event took place on 12th March 2008 at the
Riviera International Centre in Torquay, over 25,000 students and service personnel
have now seen this theatre based, real story, education project across Devon and
Cornwall.
The Presentation
The Learn 2 Live presentation is based on a short video, depicting the scene of a group
of friends going out for a night, having a collision, the emergency services arrive, one of
the friends is taken to hospital, where they pass away, and finally the family are
informed.
As the different emergency services arrive, the video is paused and a member of that
emergency service comes out on stage to tell of a collision they have attended. The
stories they tell are real and told from their own personal point of view.
The final speakers are all (extra) ordinary people, who have had a member of their
family killed or seriously injured in a collision. They speak of the collision and also of the
effect it has had on them and their family.
The final speaker is someone who has been the driver in a fatal collision.
2. The Peninsula Motorcycle Forum
The Peninsula Motorcycle Forum (PMF) comprises of key representatives from the
Devon and Cornwall Constabulary, the Highways England, Local Authorities and the
Peninsula Road Safety Partnership (formerly the Devon and Cornwall Safety Camera
Partnership).
The PMF meets on at least two occasions within a 12 month period, at the beginning of
the motorcycle season (normally prior to the Easter Bank Holiday) and after the season.
Aims and Objectives of the Motorcycle Forum
Motorcycling within Devon and Cornwall offers a number of benefits for riders. Riding a
motorcycle, scooter or moped can be an affordable alternative to the car. Motorcycling
can provide independence, mobility and widening employment opportunities, especially
in the many parts of our rural community where public transport is limited. Motorcycling
can also offer efficient and environmentally friendly transport within our congested
A Road Safety Strategy for Torbay 2017 -2020 27Brixham * Paignton * Torquay
conurbations. Finally, many riders just enjoy motorcycling for the pleasure it gives them.
We are blessed in Devon and Cornwall with some of the finest road networks in the
country.
However, we must recognise that motorcyclists are amongst our most vulnerable road
users. The aim is to focus collaboration between authorities to make motorcycling a safe
and enjoyable experience for those who choose that mode. This requires co-ordination
between partners when taking account of the needs of motorcyclists. As a forum we will
promote safety measures and mainstreaming of motorcycling so that its needs are
considered as fully as any other transport mode in the development of transport policy.
The safety of motorcyclists must be seen as a first priority for the Forum. At this time,
although motorcyclists make up less than 2% of our road transport, they make up
approaching 30% of fatalities. Again, for this situation to be reversed there needs to be
focus, collaboration and partnership co-ordination in a local context.
The PMF will be integrated into the PRSP initiatives and as such the aims of the group
are likely to be updated.
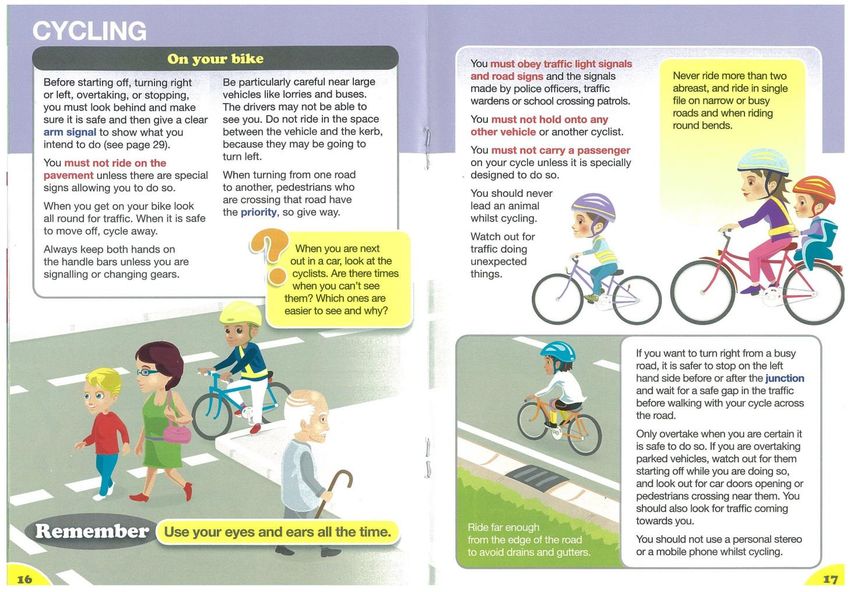
3. Bikeability
Bikeability is Cycling Proficiency for the 21st century, designed to give the next
generation the skills and confidence to cycle on today's roads.
There are three different levels of Bikeability training:
Level 1. Teaches basic bike handling skills in an off-road environment and is ideally
suited to children aged between 7-9 years old.
Level 2. Is covered on quiet roads with real traffic conditions and is available to
children aged 10 and older.
Level 3. Is carried out on busier roads with more complex road junctions and is suited
to secondary aged school children and adults.
Each Bikeability level builds on the skills and experience gained from the previous level
and real-life cycling away from the training area.
Torbay Council is pleased to be working in nearly all primary schools in Torbay to give
as many young people the opportunity to gain this important life skill. Bikeability is
currently subject to funding by the DfT.
4. Driver Training
Torbay Council will signpost road users towards promoting the benefits of a proactive
approach to injury and casualty reduction.
We support the work of advanced driving groups such as the Institute of Advanced
Motorists and RoSPA. Advice on driver training is available to all local organisations
who wish to improve the driving standards of their employees.
A Road Safety Strategy for Torbay 2017 -2020 28Brixham * Paignton * Torquay
Benefits for Employers
Benefits of driver training for the employer include both tangible and non-tangible
elements such as:
Reduced crash and injury rates for employees
Potential reduction in insurance premiums
Reduced down time
Savings in fleet running costs including maintenance and fuel
Reduced environmental impact upon the local and wider community leading to
improved quality of life for all
Enhanced environmental profile
Reduced health and safety problems
Fulfilling health and safety obligations
Dissemination of information beyond the immediate client base
Benefits for Employees
Benefits to the employee are as follows:
Reduced risk
Increased confidence
Reduced stress levels
Reduced conflict
Dissemination of information to family and friends
Greater awareness of the individual's responsibility with regard to other road
users and health and safety issues
Raised awareness concerning the issue of responsibility rather than the current
blame culture
Improved personal fuel economy
Reduced insurance claims
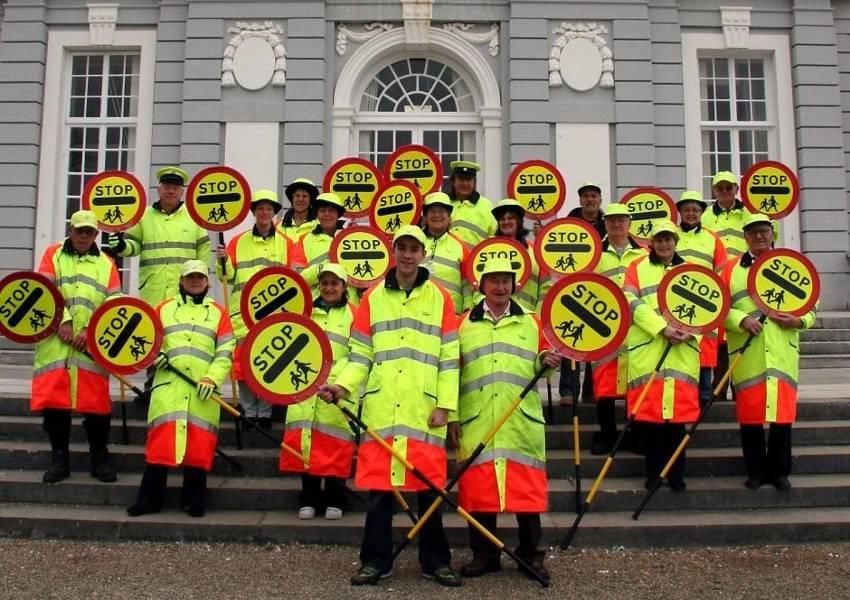
5. School Crossing Patrols
School Crossing Patrol Officers operate at certain places where it can be hazardous or
difficult to cross the road. This is a discretionary service and it remains the responsibility
of parents to ensure the safety of children travelling to and from school.
The law requires drivers to stop when the Stop sign is held upright. It is an offence under
the Road Traffic Regulation Act 1984 if a driver does not stop when signaled to do so by
a School Crossing Patrol. The penalties for not stopping include:
a fine of up to £1000;
three penalty points on your driving licence.
The Transport Act 2000 states that a patrol can stop traffic for any pedestrians and not
just for school children or those accompanying a school child.
Patrol Responsibilities
School Crossing Patrol Officers, sometimes known as “Lollipop People”, work on school
days for approximately 40 minutes each morning and afternoon.
If a patrol officer is unable to work, we attempt to provide cover using a mobile relief
patrol. Our priority is to provide cover for the first day of absence. In these circumstances
A Road Safety Strategy for Torbay 2017 -2020 29Brixham * Paignton * Torquay
we inform schools that the regular patrol officer is unable to attend and that the site is
likely to be unstaffed.
School Crossing Sites
Torbay Council have 26 approved sites in the Bay and re-asses each site when it
becomes vacant, to ensure there is still a need for the school crossing patrol. In addition,
new assessments are carried out at locations where pupils report difficulty in crossing.
Torbay Council has implemented Traffic Regulation Orders on all the zigzag “Keep
Clear” markings in the Bay.
A Road Safety Strategy for Torbay 2017 -2020 30You can also read