Role of a lower cutoff of high sensitivity troponin I in identification of early cardiac damage in non severe patients with COVID 19
←
→
Page content transcription
If your browser does not render page correctly, please read the page content below
www.nature.com/scientificreports
OPEN Role of a lower cutoff
of high sensitivity troponin I
in identification of early cardiac
damage in non‑severe patients
with COVID‑19
Yiting Lin1,7, Kun Yan1,7, Lingling Chen1, Yiqun Wu2, Jielan Liu3, Yingying Chen4,
Bingbo Hou5* & Ping Zhong 6*
Cardiac damage in non-severe patients with coronavirus disease 2019 (COVID-19) is poorly explored.
This study aimed to explore the manifestations of cardiac damage at presentation in non-severe
patients with COVID-19. In this study, 113 non-severe patients with COVID-19 were grouped
according to the duration from symptoms onset to hospital admission: group 1 (≤ 1 week, n = 27),
group 2 (> 1 to 2 weeks, n = 28), group 3 (> 2 to 3 weeks, n = 27), group 4 (> 3 weeks, n = 31). Clinical,
cardiovascular, and radiological data on hospital admission were compared across the four groups. The
level of high sensitivity troponin I (hs-cTnI) in group 2 [10.25 (IQR 6.75–15.63) ng/L] was significantly
higher than those in group 1 [1.90 (IQR 1.90–8.80) ng/L] and group 4 [1.90 (IQR 1.90–5.80) ng/L] (all
Pbonferroni < 0.05). The proportion of patients who had a level of hs-cTnI ≥ 5 ng/L in group 2 (85.71%) was
significantly higher than those in the other three groups (37.04%, 51.85%, and 25.81%, respectively)
(all Pbonferroni < 0.05). Compared with patients with hs-cTnI under 5 ng/L, those with hs-cTnI ≥ 5 ng/L
had lower lymphocyte count (P = 0.000) and SpO2 (P = 0.002) and higher CRP (P = 0.000). Patients with
hs-cTnI ≥ 5 ng/L had a higher incidence of bilateral pneumonia (P = 0.000) and longer hospital length of
stay (P = 0.000). In conclusion, non-severe patients with COVID-19 in the second week after symptoms
onset were most likely to suffer cardiac damage. A detectable level of hs-cTnI ≥ 5 ng/L might be a
manifestation of early cardiac damage in the patients.
Coronavirus disease 2019 (COVID-19), caused by severe acute respiratory syndrome coronavirus-2 (SARS-
Cov-2), has impacted health globally on an unprecedented scale, and the number of cases continues to rise
worldwide1. Whereas COVID-19 is primarily known as a respiratory infection, it has important systemic effects
such as cardiac damage, which was shown to be a significant contributor to the fatal outcomes of patients with
COVID-192,3. Moreover, COVID-19 patients with premorbid cardiovascular diseases were more likely to develop
severe symptoms and represented a large proportion of deaths from COVID-194. Therefore, cardiac damage
should be especially noticed for patients with COVID-19, especially for patients with premorbid cardiovascular
diseases.
To date, the manifestations of cardiac damage, including acute cardiac injury, myocarditis, arrhythmia,
heart failure, and cardiogenic shock, have been noted in several published reports on COVID-195–9. However,
the majority of them focused on the manifestations of cardiac damage in severe patients with COVID-19,
whereas the manifestations in non-severe patients are poorly explored. Since over 80% of COVID-19 patients
1
Department of Respiratory and Critical Care Medicine, Xiamen Haicang Hospital, Xiamen, China. 2Department of
Respiratory Section II, The Third Hospital of Xiamen Affiliated to Fujian University of Traditional Chinese Medicine,
Xiamen, China. 3Department of Internal Medicine, Xiamen Lotus Hospital, Xiamen, China. 4Department of Cardiac
and Cerebral Function, Xiamen Xian Yue Hospital, Xiamen, China. 5Department of Cardiology, Xiamen University
Zhongshan Hospital, No.201‑209 Hubinnan Road, Xiamen 361003, Fujian, People’s Republic of China. 6BE
and Phase I Clinical Trial Center, The First Affiliated Hospital of Xiamen University, School of Medicine, Xiamen
University, NO.55 Zhenhai Road, Xiamen 361002, Fujian, People’s Republic of China. 7These authors contributed
equally: Yiting Lin and Kun Yan. *email: houbingbo@126.com; jgszp2004@163.com
Scientific Reports | (2022) 12:2389 | https://doi.org/10.1038/s41598-022-06378-2 1
Vol.:(0123456789)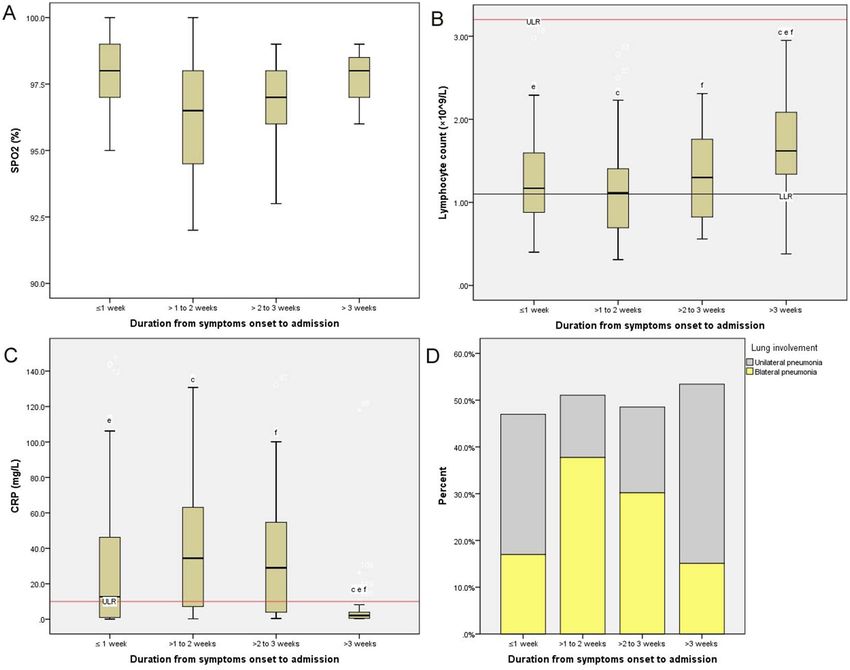
www.nature.com/scientificreports/
are non-severe, there is an urgent need to investigate the manifestations of cardiac damage in non-severe patients
with COVID-19.
In general, a higher level of hs-cTnI than the 99th percentile is recommended to identify cardiac injury in
clinical practice. However, the cutoff of hs-cTnI for effectively predicting mortality of patients with COVID-19
was found to be much lower than the 99th p ercentile10. Moreover, the cardiac involvement, which was revealed
by cardiovascular magnetic resonance, was reported in 78% of COVID-19 patients (78/100), whereas only 5%
of these patients presented a higher level of hs-cTnI than the 99th percentile11. All these results indicated that
cardiac injury might be the tip of the iceberg in the cardiac damage of COVID-19. Furthermore, a much lower
hs-cTnI cut-off of 5 ng/L has been shown to successfully identify patients with suspected acute coronary syn-
drome who were at high risk of cardiac ischemic e vents12,13. Accordingly, we hypothesized that a higher level
of hs-cTnI than 5 ng/L is one of the manifestations of cardiac damage in non-severe patients COVID-19. To
verify this hypothesis, this study aimed to investigate the manifestations of cardiac damage at presentation in
non-severe patients with COVID-19.
Methods
Study population. The study population was collected from the Wuhan Tongji Hospital Guanggu Branch,
Huazhong University of Science and Technology, which was managed by a multidisciplinary team from Xiamen
city. The inclusion criteria of the study population were as follows: (1) Consecutive COVID-19 patients admitted
to the E3-9 ward in this hospital between February 10, 2020, and March 25, 2020. (2) Based on the “diagnosis
and treatment guideline for COVID-19 of China” (http://www.nhc.gov.cn/), patients included in this study were
confirmed by detecting SARS-CoV-2 RNA in pharyngeal swab samples. (3) The severity of patients on hospital
admission was categorized as non-severe type. According to the guideline, the severe type was characterized by
(a) dyspnea (respiratory frequency ≥ 30 rates per minute); (b) blood oxygen saturation ≤ 93%; (c) PaO2/FiO2
ratio < 300, and/or lung infiltrates > 50% within 24–48 h (satisfying at least one of the above items). Non-severe
patients included patients with non-pneumonia and mild to moderate pneumonia and satisfied none of the
above items.
The exclusion criteria of the study population were as follows: (1) Patients without detailed medical records
on hospital admission within 24 h (e.g., without cardiac biomarkers); (2) Patients who had a history or the pres-
ence of myocardial infarction and heart failure; (3) The date of the illness onset had not been recorded accurately.
All methods were carried out following the Declaration of Helsinki. The Ethics Committee of Xiamen Haicang
Hospital approved this study under an expedited review. Meanwhile, informed consent was waived by the Ethics
Committee of Xiamen Haicang Hospital due to this retrospective design.
Study design. Initially, we intended to explore the period when COVID-19 patients were most likely to
suffer cardiac damage. According to the previous theories14–16, we designated four groups of patients based on
the duration from symptoms onset to hospital admission: group 1 (admitted to the hospital within one week),
group 2 (admitted to the hospital > one week to two weeks), group 3 (admitted to the hospital > two weeks to
three weeks), group 4 (admitted to the hospital > three weeks).
Demographic information and clinical medical records from COVID-19 patients on hospital admission
within 24 h were extracted. Clinical characteristics included symptoms onset, the duration from symptoms
onset to hospital admission, vital signs on hospital admission, comorbidities, medications for the treatment of
comorbidities, laboratory indices (e.g. lymphocyte, creatinine, urea, C-reactive protein (CRP), cardiac biomark-
ers, etc.) and radiological findings. In this study, high sensitivity troponin I (hs-cTnI) was measured by using a
high sensitivity assay (ARCHITECT STAT, Abbott Laboratories) at the clinical laboratory of Tongji Hospital.
According to the manufacturer, the 99th percentile concentrations are 34.2 ng/L for males and 15.6 ng/L for
females, with a corresponding coefficient of variation of < 5%. The extracted data were compared across the
four groups. In addition, the levels of CRP, lymphocyte count, pulse oximeter O2 saturation (SpO2), cardiac
biomarkers, and lung involvement, and hospital length of stay were compared between patients with hs-cTnI
under 5 ng/L and ≥ 5 ng/L.
Statistical analysis. The data were analyzed by SPSS statistic 22.0 (SPSS Inc., Chicago, USA). Continuous
variables were expressed as the median and interquartile range (IQR) when they were highly skewed distribu-
tion, and the differences were analyzed using independent samples Kruskal–Wallis test or Mann–Whitney U
test, as appropriate. Categorical values were expressed as frequencies, and the differences were analyzed using
χ2 tests or Fisher’s exact test across the four groups. Correlations between cardiac biomarkers and S pO2, lym-
phocyte count, and CRP were tested by Spearman correlation analyses. Besides, a boxplot (without outliers) was
drawn in the case of a significant difference for this indicator across the four groups. The critical P value (α) was
defined as 0.05, and all statistical significance was defined as P < 0.05. However, the P value was adjusted using
the Bonferroni method when a pairwise comparison in the four groups was conducted.
Results
Comparisons of demographic and clinical characteristics across the four groups. In this study,
we enrolled 113 non-severe patients with COVID-19 finally. Comparisons of demographic and clinical charac-
teristics across the four groups are shown in Table 1. There were no significant differences in age, sex, comorbidi-
ties, medications, symptoms, creatinine, urea, and hospital length of stay across the four groups. Of note, the
level of SpO2 in group 2 was significantly lower than those in group 1 and group 4 (all Pbonferroni < 0.05).
Scientific Reports | (2022) 12:2389 | https://doi.org/10.1038/s41598-022-06378-2 2
Vol:.(1234567890)www.nature.com/scientificreports/
Characteristics Total (n = 113) Group 1 (n = 27) Group 2 (n = 28) Group 3 (n = 27) Group 4 (n = 31) H/χ2 P
Age (years) 57.0 (43.5–69.0) 54.0 (35.0–69.0) 61.0 (52.5–70.0) 64.0 (41.0–69.0) 54.0 (45.0–67.0) 2.438 0.487
< 60 61 (53.98) 18 (66.67) 12 (42.86) 12 (44.44) 19 (61.29) 4.799 0.187
≥ 60 52 (46.02) 9 (33.33) 16 (57.14) 15 (55.56) 12 (38.74)
Sex
Male 59 (52.21) 13 (48.15) 16 (57.14) 15 (55.56) 15 (48.39) 0.754 0.860
Female 54 (47.79) 14 (51.85) 12 (42.86) 12 (44.44) 16 (51.61)
Comorbidity
Hypertension 34 (26.55) 5 (18.52) 9 (32.14) 7 (25.93) 13 (41.93) 4.065 0.255
Diabetes 25 (22.12) 6 (22.22) 3 (10.71) 8 (29.63) 8 (25.80) 3.243 0.356
Coronary heart disease
≥ 1 comorbidity 11 (9.73) 1 (3.70) 3 (10.71) 3 (11.11) 4 (12.91) 1.561 0.668
1–2 41 (36.28) 8 (29.63) 13 (46.42) 9 (33.33) 11 (35.48) 6.087 0.414
≥3 18 (15.93) 4 (14.81) 1 (3.57) 6 (22.22) 7 (22.58)
Medications
1–2 24 (21.24) 2 (7.40) 8 (28.57) 5 (18.52) 9 (29.03) 6.479 0.372
≥3 21 (18.58) 6 (22.22) 4 (14.29) 4 (14.81) 7 (22.58)
Symptoms of illness onset
Fever 65 (57.52) 12 (44.44) 13 (46.43) 18 (66.67) 22 (70.96) 6.518 0.089
Cough 56 (49.56) 11 (40.74) 12 (42.86) 13 (48.15) 20 (64.52) 4.139 0.247
Temperature (°C) 36.5 (36.4–36.8) 36.6 (36.3–36.8) 36.6 (36.4–37.0) 36.5 (36.3–37.0) 36.5 (36.4–36.7) 4.404 0.221
> 37.3 16 (14.16) 4 (14.81) 6 (21.42)c 6 (22.22)f 0 (0.00) c f 7.784 0.018*
Heart rate (beats/
90.0 (78.0–102.5) 96.0 (83.0–104.0) 89.5 (77.75–96.0) 84.0 (76.0–96.0) 90.0 (79.0–105.0) 3.307 0.347
min)
> 100 29 (25.66) 8 (29.63) 5 (18.52) 6 (22.22) 10 (32.26) 1.991 0.574
129.0 (118.5– 126.0 (114.0– 128.0 (114.5– 124.0 (116.0– 136.0 (126.0–
SBP (mm Hg) 8.421 0.038*
140.5) 135.0) 143.3) 140.0) 150.0)
≥ 140 33 (29.20) 3 (11.11)e 8 (28.57) 8 (29.63) 14 (45.16) e 8.101 0.044*
DBP (mm Hg) 80.0 (73.0–90.0) 81.0 (75.0–90.0) 75.5 (71.0–84.75) 78.0 (70.0–90.0) 83.0 (78.0–91.0) 7.425 0.060
≥ 90 29 (25.66) 7 (25.93) 4 (14.29) 8 (29.63) 10 (32.26) 2.830 0.419
96.5 (94.25–98.0)
SPO2 (%) 98.0 (96.0–98.0) 98.0 (97.0–99.0)a 97.0 (96.0–98.0) 98.0 (97.0–99.0)c 11.304 0.010*
ac
Creatinine (μmol
69.0 (57.0–87.0) 64.0 (54.0–83.0) 77.5 (55.0–96.3) 70.0 (57.0–87.0) 67.0 (60.0–80.0) 2.723 0.436
/l)
Urea (mmol/l) 4.4 (3.4–5.6) 4.4 (3.1–5.4) 4.6 (3.2–5.7) 4.0 (3.2–5.6) 4.7 (3.7–5.8) 2.097 0.552
Outcome
Length of stay
13.0 (10.0–17.0) 14.0 (10.0–18.0) 14.0 (10.0–17.0) 14.0 (9.0–18.0) 12.0 (11.0–15.0) 0.653 0.884
(days)
Developing a
2 (1.77) 1 (3.70) 0 (0.00) 0 (0.00) 1 (3.23) 1.950 0.863
severe disease
Oxygen therapy 70 (61.95) 14 (51.85) 18 (64.29) 20 (74.07) 18 (58.06) 3.115 0.375
Table 1. Comparisons of demographic and clinical characteristics across the four groups. Data are shown
as median (interquartile range) or n (%). P values were calculated by Kruskal–Wallis test, χ2 test or Fisher’s
exact test, as appropriate. SBP, systolic blood pressure; DBP, diastolic blood pressure; S PO2, pulse oximeter
O2 saturation; * denoted P < 0.05. a denoted Pbonferroni < 0.05 between group 1 and group 2. b denoted
Pbonferroni < 0.05 between group 2 and group 3. c denoted Pbonferroni < 0.05 between group 2 and group 4. d
denoted Pbonferroni < 0.05 between group 1 and group 3. e denoted Pbonferroni < 0.05 between group 1 and group 4.
f denoted Pbonferroni < 0.05 between group 3 and group 4.
Comparisons of laboratory indices and radiological findings across the four groups. Compari-
sons of laboratory indices and radiological findings across the four groups are shown in Table 2. The level of
hs-cTnI in group 2 [10.25 (IQR 6.75–15.63) ng/L] was significantly higher than those in group 1 [1.90 (IQR
1.90–8.80) ng/L] and group 4 [1.90 (IQR 1.90–5.80) ng/L] (all Pbonferroni < 0.05). The levels of myoglobin, LDH,
and CRP in group 2 were significantly higher than those in group 4 (all Pbonferroni < 0.05). The levels of lympho-
cyte count in group 1 and group 2 were significantly lower than that in group 4 (all Pbonferroni < 0.05). Notably,
the proportion of patients who had a level of hs-cTnI ≥ 5 ng/L in group 2 (85.71%) was significantly higher than
those in the other three groups (37.04%, 51.85%, and 25.81%, respectively) (all Pbonferroni < 0.05). In addition, the
incidence of bilateral pneumonia in group 2 (71.43%) was significantly higher than those in group 1 (33.33%)
and group 4 (25.81%) (all Pbonferroni < 0.05).
Scientific Reports | (2022) 12:2389 | https://doi.org/10.1038/s41598-022-06378-2 3
Vol.:(0123456789)www.nature.com/scientificreports/
Characteristics Total (n = 113) Group 1 (n = 27) Group 2 (n = 28) Group 3 (n = 27) Group 4 (n = 31) H/χ2 P
10.25 (6.75–15.63)
Troponin I (ng/L) 4.50 (1.90–10.60) 1.90 (1.90–8.80)a 5.30 (1.9–11.7) 1.90 (1.90–5.80)c 21.054 0.000*
ac
≤ 34.2 (for males)
≤ 15.6 (for 103 (91.15) 25 (92.59) 23 (82.14) 26 (96.30) 29 (93.55) 3.993 0.262
females) #
> 34.2 or 15.6 10 (8.85) 2 (7.41) 5 (17.86) 1 (3.70) 2 (6.45)
Or < 5 57 (50.44) 17 (62.96)a 4 (14.29)abc 13 (48.15)b 23 (74.19)c 23.389 0.000*
≥5 56 (49.56) 10 (37.04) 24 (85.71) 14 (51.85) 8 (25.81)
BNP (pg/mL) 96.00 (27.5–185.0) 47.0 (19.0–178.0) 155.5 (42.3–229.3) 178.0 (45.0–243.0) 41.0 (20.0–148.0) 9.935 0.019*
< 486 # 97 (85.84) 25 (92.59) 24 (85.71) 21 (77.78) 27 (87.10) 2.399 0.503
≥ 486 16 (14.16) 2 (7.41) 4 (14.29) 6 (22.22) 4 (12.90)
Myoglobin (ng/ 36.90 (27.80– 68.15 (33.50– 32.50 (23.30–
33.2 (23.5–55.5) 38.40 (26.60–78.2) 13.470 0.004*
mL) 77.95) 181.52)c 43.70)c
≤ 154.9 # 100 (88.50) 23 (85.19) 20 (71.43)c 26 (96.30) 31 (100.00)c 13.047 0.001*
> 154.9 13 (11.50) 4 (14.91) 8 (28.57) 1 (3.70) 0 (0.00)
CKMB (ng/mL) 0.80 (0.50–1.20) 0.60 (0.40–1.30) 0.90 (0.60–2.08) 0.80 (0.50–1.20) 0.70 (0.50–1.10) 2.665 0.446
≤ 7.2# 112 (99.12) 26 (96.30) 28 (100.00) 27 (100.00) 31 (100.00) 0.101 1.000
> 7.2 1 (0.88) 1 (3.70) 0 (0.00) 0 (0.00) 0 (0.00)
204.0 (169.5– 204.0 (187.0– 267.0 (235.0– 224.0 (153.0– 170.0 (155.0–
LDH (U/L) 24.288 0.000*
284.0) 246.0)e 351.3)c 342.0)f 195.0)cef
135–225# 64 (56.64) 15 (55.56)e 6 (21.43)c 14 (51.85)f 29 (93.55)cef 31.595 0.000*
> 225 49 (43.36) 12 (44.44) 22 (78.57) 13 (48.15) 2 (6.45)
Lymphocyte count
1.28 (0.85–1.76) 1.17 (0.86–1.66)e 1.12 (0.69–1.42)c 1.30 (0.81–1.80) 1.62 (1.31–2.14)ec 14.291 0.003*
(× 109/L)
< 1.1 40 (35.40) 12 (44.44)e 13 (46.43)c 11 (40.74) 4 (12.90)ce 9.623 0.022*
1.1–3.2 # 73 (64.60) 15 (55.56) 15 (53.57) 16 (59.26) 27 (87.10)
34.45 (6.63–64.93) 2.10 (0.50–4.40)
CRP (mg/L) 9.80 (1.55–46.20) 12.7 (0.90–48.0)e 29.0 (3.90–55.60)f 21.742 0.000*
c cef
< 10.0 # 58 (51.33) 12 (44.44)e 9 (32.14)c 9 (33.33)f 28 (90.32)cef 27.005 0.000*
≥ 10.0 55 (48.67) 15 (55.56) 19 (67.86) 18 (66.67) 3 (9.68)
Chest CT findings
Bilateral pneu-
53 (46.90) 9 (33.33)a 20 (71.43)ac 16 (59.26) 8 (25.81)c 15.954 0.001*
monia
Unilateral pneu-
60 (53.10) 18 (66.67) 8 (28.57) 11 (40.74) 23 (74.19)
monia
Table 2. Comparisons of cardiac biomarkers, CRP, lymphocyte count, and radiological findings across
the four groups. Data are shown as median (interquartile range) or n (%). P values were calculated by
Kruskal–Wallis test, χ2 test or Fisher’s exact test, as appropriate. BNP, B-type natriuretic peptide; CKMB,
creatine kinase-myocardial band; LDH, lactic dehydrogenase; CRP, C-reactive protein; * denoted P < 0.05; #
denoted Reference intervals of analytes. a denoted Pbonferroni < 0.05 between group 1 and group 2. b denoted
Pbonferroni < 0.05 between group 2 and group 3. c denoted Pbonferroni < 0.05 between group 2 and group 4. d
denoted Pbonferroni < 0.05 between group 1 and group 3. e denoted Pbonferroni < 0.05 between group 1 and group 4.
f denoted P bonferroni < 0.05 between group 3 and group 4.
Comparisons of BNP, myoglobin, CRP, lymphocyte count, SpO2, radiological findings, and
outcome between COVID‑19 patients with hs‑cTnI under 5 ng/L and ≥ 5 ng/L. Comparisons
of BNP, myoglobin, CRP, lymphocyte count, SpO2, radiological findings, and outcome between COVID-19
patients with hs-cTnI under 5 ng/L and ≥ 5 ng/L are shown in Table 3. Compared with patients with hs-cTnI
under 5 ng/L, those with hs-cTnI ≥ 5 ng/L presented with significantly lower lymphocyte count (P = 0.000) and
SpO2 (P = 0.002) and higher CRP (P = 0.000). Patients with hs-cTnI ≥ 5 ng/L had significantly higher incidence
of bilateral pneumonia (P = 0.000) and significantly longer hospital length of stay (P = 0.000). Additionally, 2
patients with hs-cTnI ≥ 5 ng/L developed a severe disease during their hospitalization, while no patients with
hs-cTnI under 5 ng/L did.
Correlations between cardiac biomarkers and SpO2, lymphocyte count, and CRP. Scatter
plots of cardiac biomarkers and S pO2, lymphocyte count, and CRP are shown in Fig. 1. The levels of hs-cTnI
(Fig. 1A,D), myoglobin (Fig. 1B,E), and LDH (Fig. 1C,F) were found to be positively correlated with that of
C-reactive protein but negatively correlated with that of lymphocyte count. The level of SpO2 was found to be
negatively correlated with those of hs-cTnI (Fig. 1G), myoglobin (Fig. 1H), and LDH (Fig. 1I).
Scientific Reports | (2022) 12:2389 | https://doi.org/10.1038/s41598-022-06378-2 4
Vol:.(1234567890)www.nature.com/scientificreports/
Characteristics hs-cTnI < 5 ng/L (n = 57) hs-cTnI ≥ 5 ng/L (n = 56) Z/χ2 P
BNP (pg/mL) 37.0 (18.0–115.5) 175.5(70.5–300.0) − 5.328 0.000
< 486 # 54 (94.74) 43 (76.79) 7.489 0.006
≥ 486 3 (5.26) 13 (23.21)
Myoglobin (ng/mL) 29.00(22.85–34.75) 75.65(38.70–127.05) − 6.593 0.000
≤ 154.9 # 57 (100.00) 43 (76.79) 14.952 0.000
> 154.9 0 (0.00) 13 (23.21)
Lymphocyte count (× 109/L) 1.59(1.20–2.05) 1.09 (0.69–1.32) − 4.566 0.000
< 1.1 12 (21.05) 28 (50.00) 10.351 0.001
1.1–3.2 # 45 (78.95) 28 (50.00)
CRP (mg/L) 2.20 (0.75–9.90) 33.85 (9.85–71.20) − 5.540 0.000
< 10.0 # 43 (75.44) 15 (26.79) 26.765 0.000
≥ 10.0 14 (24.56) 41 (73.21)
SpO2 (%) 98.0 (97.0–98.5) 97.0 (95.0–98.0) 3.047 0.002
Chest CT findings
Bilateral pneumonia 16 (28.07) 37 (66.07) 16.380 0.000
Unilateral pneumonia 41 (71.93) 19 (33.93)
Outcome
Hospital length of stay (days) 12.0 (9.0–15.0) 15.5 (12.0–21.75) − 4.111 0.000
Oxygen therapy 32(56.14) 38(67.86) 1.645 0.246
Developing a severe disease 0(0.00) 2(3.57) 2.072 0.243
Table 3. Comparisons of BNP, myoglobin, CRP, lymphocyte count, SpO2, radiological findings, and outcome
between patients with hs-cTnI under 5 ng/L and ≥ 5 ng/L. Data are shown as median (interquartile range) or
n (%). P values were calculated by Mann–Whitney U test, χ2 test or Fisher’s exact test, as appropriate. BNP,
B-type natriuretic peptide; CRP, C-reactive protein; SPO2, pulse oximeter O2 saturation; * denoted P < 0.05; #
denoted Reference intervals of analytes.
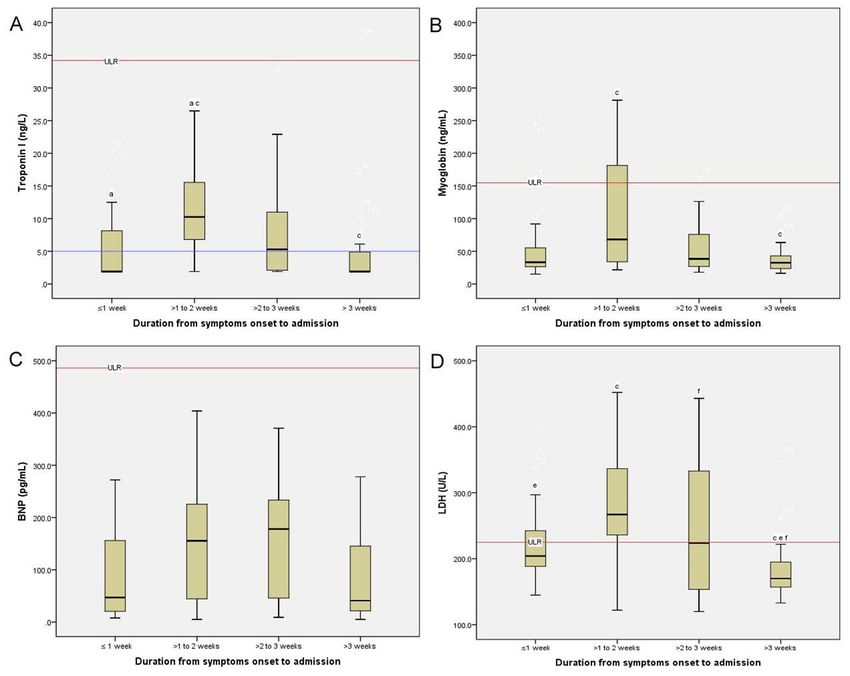
Boxplots of cardiac biomarkers, SpO2, lymphocyte count, and CRP across the four groups. The
boxplots of cardiac biomarkers, SpO2, lymphocyte count, and CRP across the four groups are shown in Figs. 2
and 3. Patients in group 2 had the highest levels of hs-cTnI, myoglobin, lactic dehydrogenase, CRP, and lung
involvement across the four groups. In contrast, Patients in group 2 presented the lowest levels of lymphocyte
and SpO2 across the four groups.
Subgroup analysis. When the patients with higher troponin levels than 99th percentile were excluded, the
level of hs-cTnI in group 2 [1.9 (IQR 1.9–5.0) ng/L] was still significantly higher than those in group 1 [1.90 (IQR
1.825–2.650) ng/L] and group 4 [1.90 (IQR 1.90–5.35) ng/L] (all Pbonferroni < 0.05). Similarly, the proportion of
patients who had a level of hs-cTnI ≥ 5 ng/L in group 2 was also significantly higher than those in the other three
groups (all Pbonferroni < 0.05). Consistent with the aforementioned results, compared with patients with hs-cTnI
under 5 ng/L, those with hs-cTnI ≥ 5 ng/L presented significantly lower lymphocyte count and SpO2, higher
CRP and incidence of bilateral pneumonia, and longer hospital length of stay (all Pbonferroni < 0.05).
Discussion
In this study, we observed that non-severe patients with COVID-19 were most likely to suffer cardiac damage
in the second week after symptoms onset. During this period, a detectable level of hs-cTnI ≥ 5 ng/L might be a
remarkable manifestation of early cardiac damage in the patients. To the best of our knowledge, this is the first
study to demonstrate the value of a lower cutoff threshold of hs-cTnI than the 99th percentile in identification
of early cardiac damage in non-severe patients with COVID-19.
In this study, COVID-19 patients in the second week after symptoms onset had the highest levels of cardiac
biomarkers. This result is in accord with Zhou et al.’8 study indicating that the level of hs-cTnI increased signifi-
cantly from 10 to 13 days after symptoms onset in COVID-19 patients. Similar to the results of a longitudinal
study17, the patients in the second week after symptoms onset had the highest levels of CRP and LDH, which
could be considered as the signs of the systemic inflammatory response. Moreover, in line with a previous study3,
our results demonstrated that the cardiac biomarkers were highly related to lymphocyte count and CRP, sug-
gesting that cardiac damage of COVID-19 was related to viral response and hyperinflammation. Accordingly,
non-severe patients with COVID-19 in the second week after symptoms onset were most likely to suffer cardiac
damage.
Interestingly, patients in group 2 had a significantly higher level of hs-cTnI compared with patients in either
group 1 or group 4. In particular, a remarkably higher proportion of patients who had a level of hs-cTnI ≥ 5 ng/L
was also observed in this group compared with the other three groups. There are several explanations for this
result. First, cardiac troponin is theoretically released from cardiomyocytes following reversible injury, irrevers-
ible injury, or apoptosis, and a significant increase in circulation concentration following the release of the protein
Scientific Reports | (2022) 12:2389 | https://doi.org/10.1038/s41598-022-06378-2 5
Vol.:(0123456789)www.nature.com/scientificreports/
Figure 1. Scatter plots of cardiac biomarkers and S PO2, lymphocyte count, and CRP. The levels of cardiac
biomarkers were significantly correlated with those of SPO2, lymphocyte count, and CRP. S PO2, pulse oximeter
O2 saturation; CRP, C-reactive protein; hs-cTnI, high sensitivity troponin I; BNP, B-type natriuretic peptide;
CKMB, creatine kinase-myocardial band; LDH, lactic dehydrogenase.
by injured cardiomyocytes18,19. Given this theory and the data which suggested that patients with suspected
acute coronary syndrome who had a detectable level of hs-cTnI ≥ 5 ng/L are at high risk of cardiac ischemic
events (e.g. sevenfold greater risk of subsequent myocardial infarction in Bularga et al.’s study)12,13, a detect-
able level of hs-cTnI ≥ 5 ng/L could also be considered as a sign of the high risk of cardiac damage. Second, the
aforementioned proportion in group 2 (89%) was higher than those in the general population (less than 25%)20,
in patients with chronic obstructive pulmonary disease (less than 40.52%)21, or even in patients with suspected
acute coronary syndrome (55.65%)12. In this way, a detectable level of hs-cTnI ≥ 5 ng/L could be considered as a
manifestation of cardiac damage. Third, our results showed that non-severe patients with COVID-19 who had
a level of hs-cTnI ≥ 5 ng/L had significantly higher levels of CRP and lung involvement and lower levels of S pO2
and lymphocyte count compared with those with hs-cTnI under 5 ng/L. Meanwhile, it was suggested that high
levels of CRP and lung involvement, as well as low levels of oxygen saturation and lymphocyte count, were highly
related to cardiac injury in COVID-19 patients20–22. Hence, a relatively high level of hs-cTnI release (≥ 5 ng/L
but < 99th percentile) might be a sign of the high risk of cardiac damage in non-severe patients with COVID-19.
Of note, the hospital length of stay was found to be significantly longer in the patients with hs-cTnI ≥ 5 ng/L
in the present study. Similarly, half of the 99th percentile for hs-cTnI was reported to be significantly related to
the fatal outcomes in patients with COVID-1910,23. Thus, the cutoff of hs-cTnI in stratifying cardiac damage in
non-severe patients with COVID-19 was recommended to be redefined, and the cutoff threshold of abnormality
for hs-cTnI was suggested to be lower than the 99th percentile.
Our findings could help us to fully understand the cardiac damage caused by SARS-Cov-2, providing impor-
tant implications for cardiovascular management in patients with COVID-19. To identify early cardiac damage
in patients with COVID-19, monitoring cardiac biomarkers (particularly hs-cTnI) aggressively was recom-
mended to be considered seriously during treatment, especially when the patients are in the second week after
Scientific Reports | (2022) 12:2389 | https://doi.org/10.1038/s41598-022-06378-2 6
Vol:.(1234567890)www.nature.com/scientificreports/
Figure 2. Simulative changes of cardiac biomarkers in non-severe patients with COVID-19 across the four
groups. COVID-19 patients who were in the second week after symptoms onset presented the highest levels of
hs-cTnI, myoglobin, BNP, and LDH. hs-cTnI, high sensitivity troponin I; BNP, B-type natriuretic peptide; LDH,
lactic dehydrogenase; ULR, Upper limit of reference intervals; LLR, Lower limit of reference intervals.
symptoms onset. More importantly, using the standard cutoff of hs-cTnI (99th percentile) might underestimate
the extent of cardiac damage in non-severe patients with COVID-19, and the cutoff of hs-cTnI should be rede-
fined (e.g. ≥ 5 ng/L) to identify patients who are at high risk of cardiac damage.
Limitation. Despite the intriguing findings of this study, several important limitations should be taken into
account. First, although we have considered several covariates, other potential confounders have not been fully
adjusted. Second, recall bias regarding the date of symptoms onset was great due to the long duration, and mis-
classification of disease course may exist in some patients. Third, The underlying structural heart diseases were
not completely ruled out to be coexisting with COVID-19 patients in this study, and thereby whether elevated
levels of cardiac biomarkers in COVID-19 patients were caused by the potential coexisting heart diseases is still
unknown. Additionally, the level of troponin was found to be related to BMI and epicardial adipose tissue in
COVID-19 patients24. However, the data regarding BMI and epicardial adipose tissue were not recorded in this
study. The potential imbalance in these data across the four groups would have an impact on the results, and the
conclusion was suggested to be interpreted with caution. Fourth, it is thought that the neutrophil to lymphocyte
count ratio is superior to the lymphocyte count in evaluating the disease. However, as the data of neutrophils
were missing, the neutrophil to lymphocyte count ratio was not applied in this study. Last but not least, our
study is single-centered research with a small sample size, and it may be underpowered to detect a significant
difference between patients with different durations at presentation. A large prospective cohort study is needed
to verify our conclusions in the future.
Scientific Reports | (2022) 12:2389 | https://doi.org/10.1038/s41598-022-06378-2 7
Vol.:(0123456789)www.nature.com/scientificreports/
Figure 3. Simulative changes of S pO2, lymphocyte count, CRP, and radiological findings in non-severe patients
with COVID-19 across the four groups. COVID-19 patients who were in the second week after symptoms onset
presented the highest levels of CRP and the lowest levels of S pO2 and lymphocyte count. Meanwhile, the patients
had the highest incidence of bilateral pneumonia. S PO2, pulse oximeter O2 saturation; CRP, C-reactive protein;
ULR, Upper limit of reference intervals; LLR, Lower limit of reference intervals.
Conclusions
In conclusion, non-severe patients with COVID-19 in the second week after symptoms onset were most likely to
suffer cardiac damage. A lower cutoff threshold of hs-cTnI than the 99th percentile (e.g. 5 ng/L) was suggested
to identify early cardiac damage at presentation in the patients. Thus, using the standard cutoff of hs-cTnI (99th
percentile) might underestimate the extent of cardiac damage in patients with COVID-19, and the cutoff thresh-
old (e.g. ≥ 5 ng/L) of abnormality for hs-cTnI was suggested to be lower than the 99th percentile. Our results
can help to provide important references for the management and enrollment for future prospective studies to
accurately validate the risk stratification of cardiac involvement in non-severe patients with COVID-19.
Data availability
The datasets used and/or analyzed during the current study are available from the corresponding author on
reasonable request.
Received: 26 June 2021; Accepted: 27 January 2022
References
1. WHO. https://www.who.int/emergencies/diseases/novel-coronavirus-2019 (accessed 03 January 2022).
2. Guo, T. et al. Cardiovascular implications of fatal outcomes of patients with coronavirus disease 2019 (COVID-19). JAMA Cardiol.
5, 811–818 (2020).
3. Shi, S. et al. Association of cardiac injury with mortality in hospitalized patients with COVID-19 in Wuhan, China. JAMA Cardiol.
5, 802–810 (2020).
4. Zheng, Y. Y., Ma, Y. T., Zhang, J. Y. & Xie, X. COVID-19 and the cardiovascular system. Nat. Rev. Cardiol. 17, 259–260 (2020).
Scientific Reports | (2022) 12:2389 | https://doi.org/10.1038/s41598-022-06378-2 8
Vol:.(1234567890)www.nature.com/scientificreports/
5. Atri, D. et al. COVID-19 for the cardiologist: A current review of the virology, clinical epidemiology, cardiac and other clinical
manifestations and potential therapeutic strategies. JACC Basic Transl. Sci. 5, 518–536 (2020).
6. Inciardi, R. M. et al. Cardiac involvement in a patient with coronavirus disease 2019 (COVID-19). JAMA Cardiol. 5, 819–824
(2020).
7. Doyen, D., Moceri, P., Ducreux, D. & Dellamonica, J. Myocarditis in a patient with COVID-19: A cause of raised troponin and
ECG changes. Lancet 395, 1516 (2020).
8. Zhou, F. et al. Clinical course and risk factors for mortality of adult inpatients with COVID-19 in Wuhan, China: A retrospective
cohort study. Lancet 395, 1054–1062 (2020).
9. Deng, Q. et al. Suspected myocardial injury in patients with COVID-19: Evidence from front-line clinical observation in Wuhan,
China. Int. J. Cardiol. 311, 116–121 (2020).
10. Qin, J. J. et al. Redefining cardiac biomarkers in predicting mortality of inpatients with COVID-19. Hypertension 76, 1104–1112
(2020).
11. Puntmann, V. O. et al. Outcomes of cardiovascular magnetic resonance imaging in patients recently recovered from coronavirus
disease 2019 (COVID-19). JAMA Cardiol. 5, 1265–1273 (2020).
12. Shah, A. S. et al. High-sensitivity cardiac troponin I at presentation in patients with suspected acute coronary syndrome: A cohort
study. Lancet 386, 2481–2488 (2015).
13. Bularga, A. et al. High-sensitivity troponin and the application of risk stratification thresholds in patients with suspected acute
coronary syndrome. Circulation 140, 1557–1568 (2019).
14. Subbarao, K. & Mahanty, S. Respiratory virus infections: Understanding COVID-19. Immunity 52, 905–909 (2020).
15. Siddiqi, H. K. & Mehra, M. R. COVID-19 illness in native and immunosuppressed states: A clinical-therapeutic staging proposal.
J. Heart Lung Transplant 39, 405–407 (2020).
16. Lin, Y. et al. A clinical staging proposal of the disease course over time in non-severe patients with coronavirus disease 2019. Sci.
Rep. 11, 10681 (2021).
17. Zeng, H. L. et al. Longitudinal profile of laboratory parameters and their application in the prediction for fatal outcome among
patients infected with SARS-CoV-2: A retrospective cohort study. Clin. Infect. Dis. 74, 626–633 (2020).
18. Mair, J. et al. How is cardiac troponin released from injured myocardium?. Eur. Heart J. Acute Cardiovasc. Care 7, 553–560 (2018).
19. Giannoni, A., Giovannini, S. & Clerico, A. Measurement of circulating concentrations of cardiac troponin I and T in healthy
subjects: A tool for monitoring myocardial tissue renewal?. Clin. Chem. Lab. Med. 47, 1167–1177 (2009).
20. Fan, Q. et al. Risk factors for myocardial injury in patients with coronavirus disease 2019 in China. ESC Heart Fail. 7, 4108–4117
(2020).
21. Zhou, W. et al. Cardiac injury prediction and lymphocyte immunity and inflammation analysis in hospitalized patients with
coronavirus disease 2019 (COVID-19). Int. J. Cardiol. 326, 237–242 (2020).
22. Xu, H. et al. Clinical characteristics and risk factors of cardiac involvement in COVID-19. J. Am. Heart Assoc. 9, e016807 (2020).
23. Cao, J. et al. Myocardial injury and COVID-19: Serum hs-cTnI level in risk stratification and the prediction of 30-day fatality in
COVID-19 patients with no prior cardiovascular disease. Theranostics 10, 9663–9673 (2020).
24. Conte, C. et al. Epicardial adipose tissue characteristics, obesity and clinical outcomes in COVID-19: A post-hoc analysis of a
prospective cohort study. Nutr. Metab. Cardiovasc. Dis. 31(7), 2156–2164 (2021).
Author contributions
Z.P., H.B. conceived and designed the research; H.B., W.Y., L.J., and C.Y. collected the data and performed the
research; Data were analyzed by L.Y., Y.K., and Z.P. L.Y., Y.K., and Z.P. drafted the manuscript; Z.P., C.L. initi-
ated and organized this study. All authors reviewed and edited the manuscript and approved the final version
of the manuscript.
Funding
This research did not receive any specific grant from funding agencies in the public, commercial, or not-for-
profit sectors.
Competing interests
The authors declare no competing interests.
Additional information
Correspondence and requests for materials should be addressed to B.H. or P.Z.
Reprints and permissions information is available at www.nature.com/reprints.
Publisher’s note Springer Nature remains neutral with regard to jurisdictional claims in published maps and
institutional affiliations.
Open Access This article is licensed under a Creative Commons Attribution 4.0 International
License, which permits use, sharing, adaptation, distribution and reproduction in any medium or
format, as long as you give appropriate credit to the original author(s) and the source, provide a link to the
Creative Commons licence, and indicate if changes were made. The images or other third party material in this
article are included in the article’s Creative Commons licence, unless indicated otherwise in a credit line to the
material. If material is not included in the article’s Creative Commons licence and your intended use is not
permitted by statutory regulation or exceeds the permitted use, you will need to obtain permission directly from
the copyright holder. To view a copy of this licence, visit http://creativecommons.org/licenses/by/4.0/.
© The Author(s) 2022
Scientific Reports | (2022) 12:2389 | https://doi.org/10.1038/s41598-022-06378-2 9
Vol.:(0123456789)You can also read