Sentiment in New York City: A High Resolution Spatial and Temporal View
←
→
Page content transcription
If your browser does not render page correctly, please read the page content below
Sentiment in New York City: A High Resolution Spatial and
                                      Temporal View

 Karla Z. Bertrand, Maya Bialik, Kawandeep Virdee, Andreas Gros and Yaneer Bar-Yam
                           New England Complex Systems Institute
                      238 Main St. S319 Cambridge MA 02142, USA
                                    (Dated: August 20, 2013)

                                            Abstract
  Measuring public sentiment is a key task for researchers and policymakers alike. The explosion
of available social media data allows for a more time-sensitive and geographically specific analysis
than ever before. In this paper we analyze data from the micro-blogging site Twitter and generate
a sentiment map of New York City. We develop a classifier specifically tuned for 140-character
Twitter messages, or tweets, using key words, phrases and emoticons to determine the mood of
each tweet. This method, combined with geotagging provided by users, enables us to gauge public
sentiment on extremely fine-grained spatial and temporal scales. We find that public mood is
generally highest in public parks and lowest at transportation hubs, and locate other areas of
strong sentiment such as cemeteries, medical centers, a jail, and a sewage facility. Sentiment
progressively improves with proximity to Times Square. Periodic patterns of sentiment fluctuate
on both a daily and a weekly scale: more positive tweets are posted on weekends than on weekdays,
with a daily peak in sentiment around midnight and a nadir between 9:00 a.m. and noon.

                                                1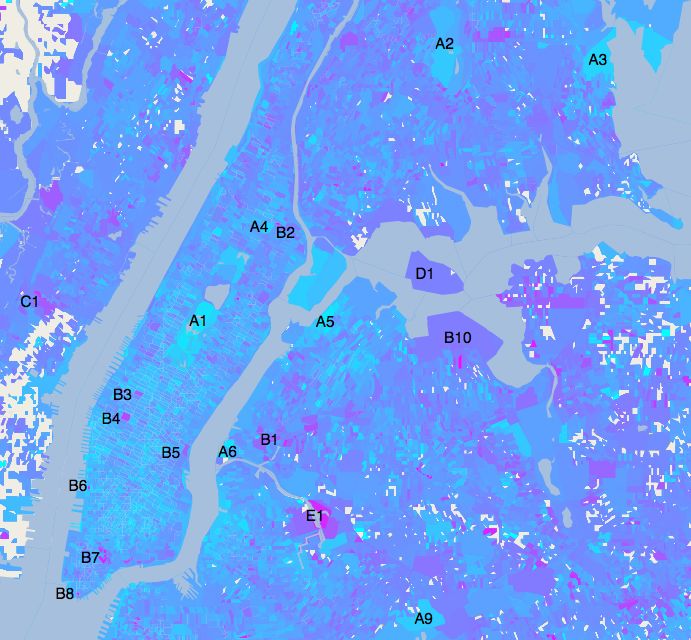
Twitter is a microblogging site created in 2006 [1] that is used by over 500 million people
worldwide [2]. Researchers have found it an invaluable data repository for opinion mining
and prediction in a number of fields, including politics [3–5] and financial markets [6–8].
Twitter has also served as a resource for predicting and tracking the propagation of natural
disasters, epidemics, and terrorist incidents [9]. Public mood can be quantified using Twit-
ter and other Internet sources [10–15]. The usefulness of Twitter as a tool for sentiment
analysis has been verified by comparison to more traditional metrics, such as polls [16],
socio-economic conditions [17], and stock market performance [18], as well as common sense
predictors such as weather [19]. Recent studies have begun to explore both the dynamics
[20] and geography [21] of twitter sentiment.
Here we use Twitter to study the fine-grained geography and dynamics of sentiment in the
greater New York City area, identifying areas and times of positive and negative sentiment.
We collected 603,954 tweets via Twitter’s API [22], restricted to those which were tagged
with geocoordinates around the immediate New York metropolitan area over the course of
two weeks in April 2012. We built a sentiment classifier in order to assess the mood of the
tweets. Using emoticons we constructed a customized classifier directly from tweets rather
than lexicons obtained from other sources. A set of tweets that included emoticons such as
;) or :-( served as the training corpus for positive and negative sentiment classifiers. Then,
for each tweet in our full set, we removed the URLs and usernames, tokenized the text, and
assigned a sentiment score based on these two classifiers. Methodological details are in the
Appendix.
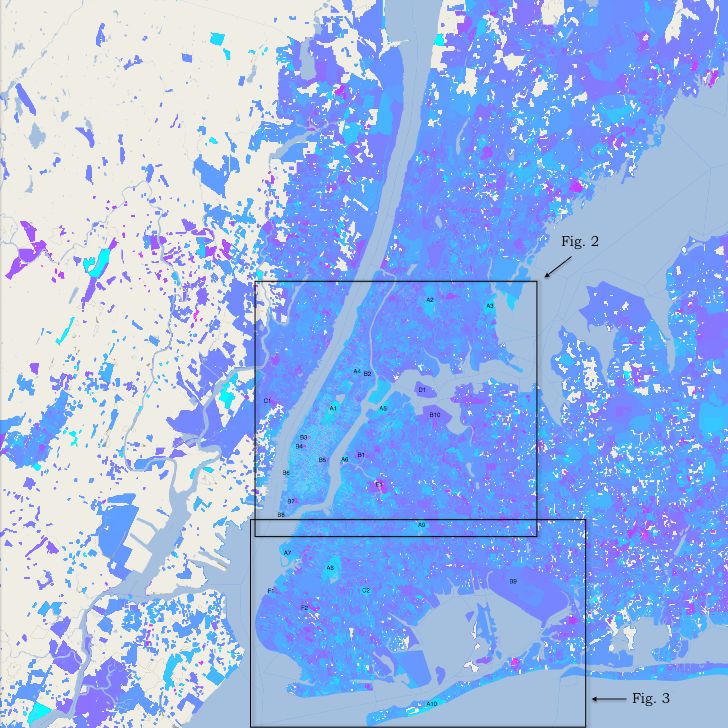
We combined the sentiment ratings with geotags to create a map of public mood, as
shown in Fig. 1. Expanded views are shown in Fig. 2, centered on the island of Manhattan,
and Fig. 3, centered on Brooklyn.
By comparing the sentiment map to a street map of New York, we determine the land-
marks corresponding to areas with high and low sentiment (figure labels A through F in
Table I). Generally, areas of very positive sentiment are public parks and gardens (A1 –
A10). This is consistent with knowledge from urban design [23], as well as increasing empir-
ical evidence of the importance of public parks to residents’ quality of life [24]. Central Park
(A1) is visible as a long rectangle of lighter cyan running down the center of Manhattan.
Many of the areas with very negative sentiment are related to transportation hubs such
as entrances to tunnels and bridges (B1 – B10), including the Midtown Tunnel (B5), the
2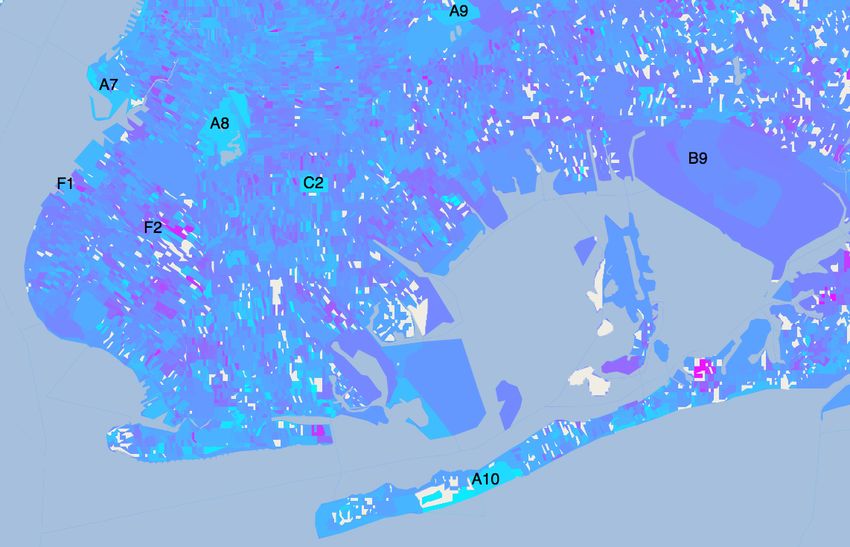
FIG. 1: Public sentiment map of the New York City metropolitan area according to analysis of
over 600,000 tweets, organized by census block. Cyan represents the most positive sentiment and
magenta the most negative. White represents areas with insufficient tweet density for analysis. The
region analyzed consists of the area between latitudes 40◦ to 41◦ N and longitudes 73◦ to 74◦ W.
The boxes indicate subareas depicted in subsequent figures.

Brooklyn Bridge (B7), Port Authority Bus Terminal (B3) and Penn Station (B4). This
is consistent with the finding that people get angry in traffic [25]. Difficulties with other
forms of transportation such as buses, trains and flights also seem to be sources of negative
sentiment.

                                               3
FIG. 2: Public sentiment analysis of Manhattan and surrounding areas. Areas of strong sentiment
are labeled by A – F as follows: A: Parks; B: Transportation Hubs; C: Cemeteries; D: Riker’s
Island ; E: Maspeth Creek; F: Medical Centers. For a full list, see Table I.
Some cemeteries show strong sentiments: the Palisades and Weehawken cemeteries (C1)
are negative and the Holy Cross cemetery (C2) is positive. It is unclear why the sentiment
at the Holy Cross cemetery is positive. Medical Centers (F1 – F2) and Riker’s Island (D1)
— New York City’s main jail complex — are also areas of strong negative sentiment.
One area with markedly negative sentiment is Maspeth Creek in Brooklyn (E1). While
its geographic features are unremarkable, this area is “one of the most polluted urban water
bodies in the country,” according to EPA regional administrator Judith Enck [26]. Once one
4FIG. 3: Public sentiment analysis of Brooklyn and surrounding areas. Areas of strong sentiment
are labeled by A – F as follows: A: Parks; B: Transportation Hubs; C: Cemeteries; D: Riker’s
Island ; E: Maspeth Creek; F: Medical Centers. For a full list, see Table I.
of New York’s industrial hubs with more than 50 refineries along its coast [27], this area was
the site of the largest oil spill in the country [28] and now contains a 15-foot-thick layer of
petroleum-based pollutants that scientists have dubbed “black mayonnaise” [26]. The creek
continues to receive 288 million gallons of untreated sewage a year [29] and was listed as
a Superfund site on the National Priorities List in 2010 [27]. Although there is a clean up
plan in effect and 12 million gallons of oil have already been extracted [26] and resold [28],
current efforts to meet the standards for oxygen levels have involved aerating the water, and
by doing so, spreading the bacteria into the air [30]. The Hudson River program director
Phillip Musegaas claims “if and how it affects the local population is somewhat ... obscure”
[28]; our findings of negative sentiment reflect the impact on the local population.
In Fig. 4 we plot the proportion of positive tweets as a function of distance from Times
Square. The sentiment declines from a highly positive value, 0.74, to 0.6. The drop is
not solely a property of Times Square itself, as the distance until the sentiment declines to
a steady level is approximately 10km. The trend towards more positive tweets nearer to
5TABLE I: Areas of Strong Sentiment
Parks
A1. Central Park
A2. New York Botanical Garden
A3. Pelham Bay Park
A4. Marcus Garvey Park
A5. Astoria Park
A6. Gantry Plaza State Park
A7. Red Hook Park
A8. Prospect Park
A9. Highland Park
A10. Jacob Riis Park
Bus and Train Stations
B1. Hunterspoint Avenue train station
B2. Harlem 125th St. station
B3. Port Authority Bus Terminal
B4. Penn Station
Entrances to Bridges and Tunnels
B5. Midtown Tunnel
B6. Holland Tunnel
B7. Brooklyn Bridge
B8. Hugh L. Carey Tunnel
Airports
B9. JFK Airport
B10. LaGuardia Airport
Cemeteries
C1. Palisades Cemetery / Weehawken Cemetery
C2. Holy Cross Cemetery
Jail Complex
D1. Riker’s Island
Sewage Facility
E1. Maspeth Creek
Medical Centers
F1. Lutheran Medical Center
F2. Maimonides Medical Center
Times Square may be due in part to tourism at famous locations and landmarks in the heart
of Manhattan, as well as proximity to Central Park.
The temporal patterns of fluctuations in sentiment shown in Fig. 5 reflect the common
notion that people are generally happier when they are not at work. On a weekly scale,
6FIG. 4: Spatial analysis – Public sentiment as reflected by proportion of positive and negative
tweets, decreases as a function of distance from Times Square (km).
sentiment is consistently more positive on the weekends than on the weekdays, though the
dynamics over the span of one day are remarkably similar in both cases. On a daily scale,
sentiment is low in the mornings at 9:00 am, presumably when many people are arriving
at work, and steadily rises until it reaches a peak at approximately 4:00-5:00 pm, when
many finish their workday. After work there is another rise of sentiment, with a peak at
approximately midnight and a monotonic decrease through the night until 9:00 am.
In summary, we have analyzed the geographical and temporal sentiment in New York City
during a period of two weeks in April 2011. By building classifiers based on emoticons and
averaging sentiment across census blocks, we are able to map the general trends and identify
areas of strong sentiment. We find high sentiment in parks and low sentiment in areas of
transportation such as train stations, bus stations, entrances to bridges and tunnels, and
airports. Other areas of strong sentiment include cemeteries, medical centers, a jail complex,
and a polluted sewage facility. We also find a temporal pattern of fluctuation during the
weekdays and a similar but higher pattern of fluctuation during the weekends.
Our method of public mood analysis has several strengths. By utilizing Twitter’s abun-
dance of geotagged data, we can obtain spatial information that is both wide-ranging and
fine-grained. The brevity of tweets allows for rapid processing and classification, while their
frequency produces a time-sensitive picture of public sentiment. Because we do not use se-
7FIG. 5: Temporal analysis – Public sentiment over the course of the day. Left: All days. Right:
Weekdays (open diamonds) and weekend days (filled circles) plotted separately.
Error bars represent the standard error of the mean.
mantic analysis or lemmatization in our classification, our method is language independent—
a significant advantage given that fewer than 40% of tweets worldwide are composed in En-
glish [31] and that previous studies of twitter sentiment have been constrained by lexicons
which were not adapted to twitter data [21].
I. APPENDIX
We collected tweets from the Twitter Streaming Application Programming Interface
(API) [22], filtering by location to those geotagged within a bounding box of New York
City. We retrieved a total of 603,954 of these tweets between the latitudes of 40◦ to 41◦ N
and longitudes of 73◦ to 74◦ W, from April 13th–April 26th, 2012.
We constructed a classifier based upon supervised learning [32] with training labels de-
termined by the presence and type of the emoticons in Table II.
8TABLE II: Emoticons used in training of classifiers.
Positive Emoticons Negative Emoticons
:) :(
:-) :-(
:D ;(
=) =(
=D : (
;) :/[1] Twitter turns six, Twitter Blog (3/21/2012 http://blog.twitter.com/2012/03/
twitter-turns-six.html).
[2] I. Lunden, Analyst: Twitter passed 500M users in June 2012, 140M of them in US; Jakarta
biggest tweeting city, TechCrunch (7/30/2012 http://techcrunch.com/2012/07/30/
analyst-twitter-passed-500m-users-in-june-2012-140m-of-them-in-us-jakarta-biggest-tweetin
[3] N. A. Diakopoulos, D. A. Shamma, Characterizing debate performance via aggregated Twitter
sentiment, Proceedings of the SIGCHI Conference on Human Factors in Computing Systems
(2010 http://dmrussell.net/CHI2010/docs/p1hananuparpandEe-PengLimandJingJiang).
[4] A. Tumasjan, T. O. Sprenger, P. G. Sandner, I. M. Welpe, Predicting elections with Twitter:
What 140 characters reveal about political sentiment, Proceedings of the Fourth International
AAAI Conference on Weblogs and Social Media (2010 http://www.aaai.org/ocs/index.
php/ICWSM/ICWSM10/paper/viewFile/1441/1852).
[5] A. Bermingham, A. F. Smeaton, On using Twitter to monitor political sentiment and predict
election results, Sentiment Analysis where AI meets Psychology (SAAIP) Workshop at the
International Joint Conference for Natural Language Processing (2011 http://doras.dcu.
ie/16670/).
[6] A. Mittal, A. Goel, Stock prediction using Twitter sentiment analysis,
Standford University, CS229 (2011 http://cs229.stanford.edu/proj2011/
GoelMittal-StockMarketPredictionUsingTwitterSentimentAnalysis.pdf).
[7] J. Bollen, H. Mao, X.-J. Zeng, Twitter mood predicts the stock market, Journal of Computa-
tional Science 2, 1 (2011 http://arxiv.org/pdf/1010.3003.pdf).
[8] J. Bollen, H. Mao, Twitter mood as a stock market predictor, Computer 44, 91 (2011 http:
//www.computer.org/csdl/mags/co/2011/10/mco2011100091-abs.html).
[9] S. Doan, B.-K. H. Vo, N. Collier, An analysis of Twitter messages in the 2011 Tohoku Earth-
quake, eHealth pp. 58–66 (2011 http://arxiv.org/pdf/1109.1618.pdf).
[10] Facebook Data Team, Continuing our study of happiness (2010 http://www.facebook.com/
notes/facebook-data-team/continuing-our-study-of-happiness/375901788858).
[11] Facebook Data Team, Gross National Happiness (2011 http://apps.facebook.com/gnh_
index,).
10[12] A. Kramer, Proceedings of the ACM Conference on Human Factors in Computing Systems
(CHI 2010), p. 287290.
[13] G. Mishne, M. de Rijke, Capturing global mood levels using blog posts, Proceedings of AAAI-
CAAW-06, The Spring Symposia on Computational Approaches to Analyzing Weblogs (2006
http://www.aaai.org/Papers/Symposia/Spring/2006/SS-06-03/SS06-03-028.pdf).
[14] G. Mishne, Proceedings of ACM SIGIR 2005 Workshop on Stylistic Analysis of Text
for Information Access, vol. 19 (2005 http://staff.science.uva.nl/~gilad/pubs/
style2005-blogmoods.pdf).
[15] R. Yamashita, S. Yamaguchi, K. Takami, The Third International Conference on Advances
in Human-Oriented and Personalized Mechanisms, Technologies, and Services (2010 http:
//dx.doi.org/10.1109/CENTRIC.2010.9), pp. 67–72.
[16] B. O’Connor, R. Balasubramanyan, B. R. Routledge, N. A. Smith, From Tweets to polls:
Linking text sentiment to public opinion time series, ICWSM 11, 122 (2010 http://www.
aaai.org/ocs/index.php/ICWSM/ICWSM10/paper/viewFile/1536/1842).
[17] D. Quercia, J. Ellis, L. Capra, J. Crowcroft, Proceedings of the ACM 2012 Conference on
Computer Supported Cooperative Work (ACM, 2012 http://dl.acm.org/citation.cfm?id=
2145347), pp. 965–968.
[18] J. Sharma, A. Vyas, Twitter sentiment analysis, Indian Institute of Technology unpublished
report (2010 http://home.iitk.ac.in/~jaysha/cs365/projects/report.pdf).
[19] A. Hannak, et al., Tweetin’ in the rain: Exploring societal-scale effects of weather on mood,
AAAI Publications, Sixth International AAAI Conference on Weblogs and Social Media
(2012).
[20] M. Thelwall, K. Buckley, G. Paltoglou, Sentiment in Twitter events, Journal of the Ameri-
can Society for Information Science and Technology 62, 406418 (2011 http://www.uvm.edu/
~pdodds/files/papers/others/2011/thelwall2011a.pdf).
[21] L. Mitchell, M. R. Frank, K. D. Harris, P. S. Dodds, C. M. Danforth, The geography of
happiness: Connecting Twitter sentiment and expression, demographics, and objective char-
acteristics of place, PLoS ONE 8, e64417 (2013 http://www.plosone.org/article/info%
3Adoi%2F10.1371%2Fjournal.pone.0064417).
[22] The Twitter REST API v1 (https://dev.twitter.com/docs/api/1).
[23] A. Garvin, R. Brands, Public parks: The key to livable communities (New York: WW Norton
11& Company, 2011).
[24] A. Chiesura, The role of urban parks for the sustainable city, Landscape and Ur-
ban Planning 68, 129 (2004 http://www.sciencedirect.com/science/article/pii/
S0169204603001865).
[25] J. L. Deffenbacher, R. S. Lynch, E. R. Oetting, R. C. Swaim, The Driving Anger Expression
Inventory: A measure of how people express their anger on the road, Behaviour Research and
Therapy 40, 717 (2002).
[26] V. Dobnik, Newtown Creek in NYC, one of the most polluted areas in US,
awaiting cleanup, Huffington Post (2013 http://www.huffingtonpost.com/2013/03/02/
newtown-creek-in-nyc-polluted-cleanup_n_2796500.html).
[27] E. P. Agency, Newtown Creek, year = http://www.epa.gov/region2/superfund/npl/
newtowncreek/,.
[28] SLYBOOTSVIDEO, Newtown Creek: NYC’s Dirty Little Secret (2011 http://www.youtube.
com/watch?v=DHgVnucJvLA&feature=youtube_gdata_player).
[29] M. Waxman, Sacred Grove, Newtown Pentacle (2013 http://newtownpentacle.com/
category/newtown-creek/maspeth-creek/).
[30] M. E. Dueker, G. D. O’Mullan, A. R. Juhl, K. C. Weathers, M. Uriarte, Local environmental
pollution strongly influences culturable bacterial aerosols at an urban aquatic superfund site,
Environmental Science & Technology 46, 10926 (2012).
[31] S. Bennett, 39% of all tweets are in English, but Arabic now fastest-growing
language on Twitter, Media Bistro (2011 http://www.mediabistro.com/alltwitter/
twitter-language-share_b16109).
[32] S. Bird, E. Loper, E. Klein, Natural Language Processing with Python (O’Reilly Media Inc,
2009).
12You can also read