Skills and Higher Education in Canada - Towards Excellence and Equity - Prepared for: Canada 2020
←
→
Page content transcription
If your browser does not render page correctly, please read the page content below
Skills and Higher Education in Canada
Towards Excellence and Equity

Prepared for: Canada 2020       Prepared by: Daniel Munro, Principal Research Associate
                                       Centre for Skills and Post-Secondary Education
May 2014                                              The Conference Board of Canada
Introduction
ABOUT CANADA 2020
Canada 2020 is Canada’s leading, independent, progressive think-tank working to
redefine the role of the federal government for a modern Canada. We produce research
(like this paper), host events, and start conversations about Canada’s future. Canada
2020’s goal is to build a progressive community of people and ideas that will move and
shape governments. Visit us online at www.canada2020.ca.
About the paper series About the Author
Canada’s marketplace for new ideas is about to rapidly expand. Daniel Munro is a Principal Research Associate with the
Centre for Skills and Post-Secondary Education at The
And as we head into an election year, our federal government Conference Board of Canada, and Lecturer in Ethics in the
will be required to make smart, strategic choices about the Graduate School of Public and International Affairs at the
ideas that will carry Canada’s social and economic prosperity University of Ottawa. Prior to joining the Board in 2008, Daniel
to 2020 and beyond. was a senior analyst with the Council of Canadian Academies
and, before that, Assistant Professor and Democracy and
This policy paper series – published spring and summer 2014
Diversity Postdoctoral Fellow in the Department of Philosophy
– is about those choices.
at Queen’s University. He has taught politics, philosophy, and
Canada 2020 believes the federal government can be a force for ethics at Harvard University, Queen’s University, the University
significant and positive change. But for that to happen, it requires of Toronto, and Western University where he received the
a serious public policy strategy for the country that does less of Award of Excellence in Undergraduate Teaching in 2006.
some things, while focusing decisively and aggressively on a
Daniel has more than ten years of experience in research and
few important things. This requires in-depth analysis of the
policy analysis on post-secondary education, innovation, and
really big challenges and opportunities facing the country.
labour and skills issues, and has written and spoken on demo-
These papers, and our authors, do just that. cratic citizenship, institutional design, and multiculturalism
for academic and public audiences. Daniel holds degrees from
To follow the series, and for extra content like video interviews Toronto (B.A.), Western Ontario (M.A.), and MIT (Ph.D.).
and other commentary, visit www.canada2020.ca/publications.
And to stay up to date with all our work, sign-up for our mailing Follow Daniel on Twitter: @dk_munro
list, and connect with us on social media:
Follow us on Twitter: @Canada2020 | #Can2020
Like us on Facebook: facebook.com/Canada2020
2 Canada 2020 Skills and Higher Education in Canada www.canada2020.caIntroduction
TABLE OF CONTENTS
1. INTRODUCTION 4
Excellence 5
Equity 5
2. A FOUNDATION FOR HEALTH, WEALTH AND WELL-BEING 6
3. EXCELLENCE 8
Higher Education Attainment 8
Skills Attainment 10
Foundational Skills 15
From Expansion to Excellence 16
4. EQUITY 17
Aboriginal Achievement 17
Gender Gaps 19
Immigrant Achievement and Recognition 20
Regional Differences 21
5. POLICY OPTIONS 23
Excellence and Equity in Skills and Higher Education 25
3 Canada 2020 Skills and Higher Education in Canada www.canada2020.ca1
Introduction
INTRODUCTION
Canada’s performance in higher education and skills development has been fairly
strong for many years. On key measures we are at or near the top of international
rankings and our highly skilled people contribute to economic competitiveness, social
innovation, and political and community well-being. But there are troubling indications
that Canada’s skills and education performance is deteriorating, that not enough is
being done to address a range of economic and social problems, and that opportunities
and benefits have been poorly distributed across regions and groups. In short, there
are signs that we are not doing enough to achieve the high levels of skills excellence
and equity we need. Action is needed to sustain and enhance the performance of
higher education and skills development in Canada.
But why should we act? Skills and education are essential to Recognizing the importance of skills, Canada spends enormous
Canada’s economic prosperity and social well-being, and to sums on their development. Combined private and public
the health and welfare of individuals. Canadians who have spending on higher education alone was over $40 billion
acquired advanced skills and education are able to make in 2012.1 At $22,475 (USD), Canada’s per student spending
greater contributions to the economy, society, their communities on higher education is second in the OECD and well above
and their own well-being than those without such skills the average of $13,528 (USD).2 As a result, over 51 per cent of
and credentials. Moreover, the economy is becoming more Canadians hold a university or college credential—versus
technology and knowledge-intensive, and addressing an OECD average of 32 per cent—and another 12 per cent hold
persistent and emerging policy challenges—such as innovation trades certificates.3 And Canadians perform well in international
and productivity, climate change, health, inequality, and the assessments of skills such as literacy, numeracy, and problem-
fairness and effectiveness of our political institutions—require solving. But we need to do much better.
ever-increasing levels of scientific, economic, cultural and
political literacy. Succeeding in the new economy and
addressing key policy challenges will require greater excellence
and equity in skills and higher education.
Admittedly, the challenges and opportunities we face cannot
be addressed through a skills and higher education strategy
alone. Improving innovation and productivity, addressing
inequality and climate change, and achieving social and
economic justice for all, require thinking and action on many
levels. Still, without a highly skilled and educated population
we cannot even begin to address these issues adequately, nor
tackle new challenges as they arise.
1
M. Grant, The Economic Impact of Post-Secondary Education in Canada
(Ottawa: The Conference Board, forthcoming 2014).
2
OECD, Education At a Glance 2013: Country Note—Canada (Paris: OECD, 2013).
http://www.oecd.org/edu/Canada_EAG2013%20Country%20Note.pdf
3
OECD, Education At a Glance 2013: Country Note—Canada.
4 Canada 2020 Skills and Higher Education in Canada www.canada2020.caIntroduction
Excellence Equity
Is Canada is producing graduates with the right skills to sustain Are some regions and groups being left behind? Despite
and enhance the country’s economic competitiveness and strong performance overall, the distribution of skills and
social well-being?Although we lead the world in higher education opportunities and achievements is uneven across
educational attainment and score well in international skills regions and groups. While provinces like British Columbia,
assessments, performance is weakening and competitors Alberta, and Ontario perform well, other provinces and
are catching up. Additionally, we have too few people with territories struggle to keep up, and looking through the lenses
advanced degrees (particularly PhDs), insufficient graduates of Aboriginal status, immigration status and gender we see an
from the STEM disciplines, deficits in essential, innovation uneven distribution of opportunity and achievement. In too
and commercialization skills, and a poor track record on many cases, participation and achievement are determined
workplace training—all necessary to support an innovative not by choice, but by circumstances over which individuals
economy and society. have little control.
After briefly discussing how skills and higher education
contribute to economic, social, and individual well-being,
this paper examines two key challenges—excellence and
equity—and concludes with six policy options to improve
Canada’s performance.
5 Canada 2020 Skills and Higher Education in Canada www.canada2020.ca2
Introduction
A FOUNDATION FOR HEALTH,
WEALTH AND WELL-BEING
A highly skilled and educated population is essential to achieving a range of economic
and social outcomes, as well as to improving the health and welfare of individuals
themselves. These provide the basic motivations to improve Canada’s skills and
higher education performance.
1. Skills and education are key determinants of economic 3. Individuals with advanced skills and education do better in the
productivity and growth. Differences in average literacy skills labour market than those without. Canadians with university,
explain 55 per cent of the variation in economic growth college and/or trade credentials have higher employment
among OECD countries since 1960.4 With very high skills and rates and lower unemployment rates than those who have
higher education attainment rates, it is not surprising to find only a high school diploma or less.10 (See “Unemployment
Canada among the most developed and prosperous countries rates aged 15 and over, by educational attainment”). While
in the world. But with fewer advanced degree-holders (e.g., those without high school have an employment rate of only
Masters and PhDs),5 and weak performance on workplace 55 per cent, those with university or college credentials have
education and training,6 it is also not surprising to find that employment rates of 82 and 81 per cent, respectively.11 There
Canada has been lagging key international peers in innovation are differences across disciplines and regions but, on average,
and productivity growth for many years.7 higher education credential holders aged 25 to 64 earn 39 per
cent more than high school graduates.12
2. Individuals with strong foundational skills are more likely
to complete high school and post-secondary education, and to 4. Highly educated Canadians are more active in their
go on to good careers. The Youth in Transition Survey reveals a communities and politics. Canadians with a university or
“strong association between reading proficiency and educational college education are much more likely to volunteer in their
attainment.”8 Fifteen year old Canadian students who took communities than those with a high school education or less.
the OECD’s Programme for International Student Assessment In 2010, 58 per cent of adults with a university degree and 45
(PISA) test and who scored in the bottom quartile on reading per cent with a post-secondary diploma or certificate reported
proficiency “were much more likely to drop out of secondary doing volunteer work, compared to 43 per cent with a high
school and less likely to have completed a year of postsecondary school education and only 37 per cent of adults with less than
education than those in the highest quartile of reading high school.13 Similarly, an analysis of the 2011 federal election
scores.” Moreover, Canadian students who scored in the top shows that while 78 per cent of people with a university degree
level on reading performance “were 20 times more likely to go voted, those with a high school education or less voted at
to university than those in the lowest PISA level.”9 rates of only 60 per cent or less.14
4
S. Coulombe, J.F. Tremblay and S. Marchand, Literacy Scores, Human Capital
and Growth Across Fourteen OECD Countries, International Adult Literacy
Survey Series (Ottawa: Statistics Canada, 2004).
5
The Conference Board of Canada, Advanced Skills and Innovation (Ottawa:
The Conference Board, 2011) http://www.conferenceboard.ca/hcp/hot-topics/ 10
Statistics Canada, “Unemployment rates of population aged 15 and over, by
innovation.aspx educational attainment, Canada, 1990 to 2012.”
6
D. Munro, Developing Skills: Where Are Canada’s Employers? (Ottawa: The 11
Ministry of Training, Colleges, and Universities, Ontario Labour Market Statistics
Conference Board, 2014). http://www.conferenceboard.ca/topics/education/ for January 2012, 2.
commentaries/14-03-20/developing_skills_where_are_canada_s_employers.aspx 12
OECD, Education At a Glance 2013: Country Note—Canada.
7
The Conference Board of Canada, Advanced Skills and Innovation. 13
M. Vézina and S. Crompton, Volunteering in Canada (Ottawa: Statistics Canada,
8
CMEC, Measuring Up: Canadian Results of the OECD PISA Study 2012), 41,42.
(Toronto: CMEC, 2013). 14
S. Uppal and S. LaRochelle-Côté, Factors associated with voting (Ottawa: Statistics
9
CMEC, Measuring Up, 10. Canada, 2012), 6.
6 Canada 2020 Skills and Higher Education in Canada www.canada2020.caA Foundation for Health, Wealth and Well-Being
Figure 1: Unemployment rates aged 15 and over, by educational attainment, Canada, 2005 to 2012 (per cent)
18
16
14
12
10
8
6 Less than high school
4 High school
2 College or trade
0 University
2005 2006 2007 2008 2009 2010 2011 2012
Source: Statistics Canada (81-582-X), 2013.
5. Advanced skills and higher education are associated with Skills and higher education have additional benefits which
better physical and mental health. As skills and educational are harder to quantify, but no less important to individual and
attainment increase, so does the ability to find secure, well-paid community well-being. The artistic and cultural contributions
employment; find, understand, and follow health information; of those who have studied and developed skills in the fine arts
navigate the health system; and acquire the resources needed enrich our communities. The capacity of experts and citizens
to lead a healthy lifestyle.15 Given Canada’s high rate of tertiary to address difficult policy issues, such as homelessness, public
educational attainment, it is not surprising to find that Canadians health, multiculturalism and integration, and transportation
are among the world’s healthiest citizens.16 infrastructure, is enhanced through higher education and
skills development. And individuals with higher levels of skills
and educational attainment are also better equipped to pursue
knowledge of self and the world, and to engage in critical
reflection about oneself, one’s community, and the world.
15
Chief Public Health Officer of Canada, Report on the State of Public Health in
Canada 2008 - Addressing Health Inequalities (Ottawa: Public Health Agency of
Canada, 2008). See chapter 3.
16
World Health Organization, Canada: Health Profile (Geneva: WHO, 2013). www.
who.int/gho/countries/can.pdf.
7 Canada 2020 Skills and Higher Education in Canada www.canada2020.ca3
Introduction
EXCELLENCE
The benefits of skills and higher education are clear. But are Canadians skilled and
educated enough to experience the full range of benefits? Is Canada is producing
graduates with the right skills to sustain and enhance the country’s economic
competitiveness and social well-being?
Higher Education Attainment §§ Only 10.7 per cent of Canadians aged 25 to 34 hold trades
certificates versus 12.8 per cent of those aged 55 to 64.22 As
More than half of Canadians (aged 25 to 64) held a university
the latter cohort retires, Canada may face shortages in key
or college credential in 2011—the highest rate among OECD
skilled trades—though this will depend on the level and
countries, and well above the average of 32 per cent.17 An
specific kinds of industry demand.
additional 12 per cent of Canadians hold trades certificates,
bringing the proportion of Canadians with some form of
FIELDS OF S TUDY
PSE credential to nearly two thirds.18 Canada’s proportion of
Canadians earn credentials in a wide range of subjects. In the
university graduates (27 per cent) is slightly higher than the
25-64 year old population, the majority of degrees are held
OECD average (23 per cent) and our proportion of college
in business, management and public administration (20 per
graduates (25 per cent) is world-leading and more than twice
cent); social and behavioural sciences and law (17 per cent);
the OECD average (10 per cent).19
education (13 per cent); architecture, engineering, and related
Overall, the rate of tertiary education attainment in Canada is technologies (12 per cent); humanities (11 per cent); and
11 percentage points higher now than it was in 2001—primarily health and related fields (9 per cent).23 Recent graduates are
the result of higher PSE participation among younger Canadians. most likely to hold credentials in the social and behavioural
sciences; business, management and public administration;
§§ 57 per cent of 25 to 34 year-old Canadians hold a higher and health and related fields. (See “Proportion of undergraduate
education credential versus an OECD average of 39 per cent. university degrees awarded annually, by discipline, 2001 to 2011”).
This includes university (32 per cent), college (22 per cent),
and other non-trades related credentials (3 per cent).20
§§ 43 per cent of the 55 to 64 year-old population in Canada
hold such credentials—including those with university
(20 per cent), college (18 per cent), and other (4.5 per cent)
credentials.21 Thus, a more educated population is set to
replace Canada’s retiring workers.
17
OECD, Education At a Glance 2013: Country Note—Canada.
18
Statistics Canada, Education in Canada: Attainment, Field of Study and Location
of Study (Ottawa: Statistics Canada, 2013). http://www12.statcan.gc.ca/
nhs-enm/2011/as-sa/99-012-x/99-012-x2011001-eng.pdf
19
Statistics Canada, Education Indicators in Canada: An International Perspective
(Ottawa: Statistics Canada, 2014). Table A.1.3. http://www.cmec.ca/Publications/
Lists/Publications/Attachments/322/Education-Indicators-Canada-Interna-
tional-Perspective-2013.pdf
20
Statistics Canada, Education in Canada; Statistics Canada, Education Indicators
in Canada. Table A.1.3.
21
Statistics Canada, Education in Canada; Statistics Canada, Education Indicators 22
Statistics Canada, Education Indicators in Canada. Table A.1.3.
in Canada. Table A.1.3. 23
Statistics Canada, Education in Canada, 7.
8 Canada 2020 Skills and Higher Education in Canada www.canada2020.caExcellence
Figure 2: Proportion of undergraduate university degrees awarded annually, by discipline, 2001 to 2011(per cent)
25 Social and behavioral sciences and law
Business, management and public administration
20
Education
Humanities
15
Health, parks, recreation and fitness
Physical and life sciences and technologies
10
Archictecture, engineering and related technologies
5 Mathematics, computer and information sciences
Visual and preforming arts, and communication technologies
0
2001 2002 2003 2004 2005 2006 2007 2008 2009 2010 2011 Agriculture, natural resources and conservation
Sources: Statistics Canada, CANSIM 477-0020; The Conference Board of Canada.
S TEM DEGREES ADVANCED DEGREES
Nearly 25 per cent of all degrees are in the STEM disciplines— Canada also needs more advanced degrees holders to contribute
science, technology, engineering, and mathematics. Twenty to innovation—both business innovation and social innovation.
six per cent of master’s and 53 per cent of PhDs are held in a A Conference Board study on advanced skills and innovation,
STEM discipline.24 Although Canada has a higher share of found associations between the number of PhDs per 100,000
university graduates in STEM fields than the OECD average,25 population and both patents per population and business R&D
we lag key international competitors, like Finland and spending—important indicators of innovation performance.28
Germany, who have made science a fundamental part of their And a study focused on Ireland found that “R&D active firms
educational cultures.26 employing PhD researchers have rates of patenting 2.5 times
greater than similarly active firms which do not employ PhD
Moreover, immigrants hold more than half of all STEM researchers.”29 Because they value research and understand
credentials in Canada (51 per cent) despite representing only research methods, graduate degree holders in both the private
a quarter of adults.27 This suggests that Canada relies more and public sectors constitute an important support and receptor
on a strategy of international recruitment than domestic community for research and development—a key weakness in
development for STEM degree-holders. Given the importance Canada’s innovation performance.
these disciplines to innovation—including business innovation
and innovation in health, education, social services, and other
public sectors—and the rising global competition for STEM
graduates, Canada must do better on domestic development.
24
Statistics Canada, Education in Canada, 14.
25
C. Cheung, Y. Guillemette and S. Mobasher-Fard, “Tertiary Education: Developing
Skills for Innovation and Long-Term Growth in Canada.” OECD Economics
Department Working Papers, No. 991. (Paris: OECD, 2012), 26.
26
The Conference Board of Canada, Percentage of Graduates in Science, Math,
Computer Science, and Engineering (Ottawa: Conference Board, 2014). http://
www.conferenceboard.ca/hcp/details/education/graduates-science-math- 28
The Conference Board of Canada, Advanced Skills and Innovation.
computer-science-engineerin.aspx 29
Advisory Science Council, The Role of PhDs in the Smart Economy (Dublin:
27
Statistics Canada, Education in Canada, 15. Forfas, December 2009), ix.
9 Canada 2020 Skills and Higher Education in Canada www.canada2020.caExcellence
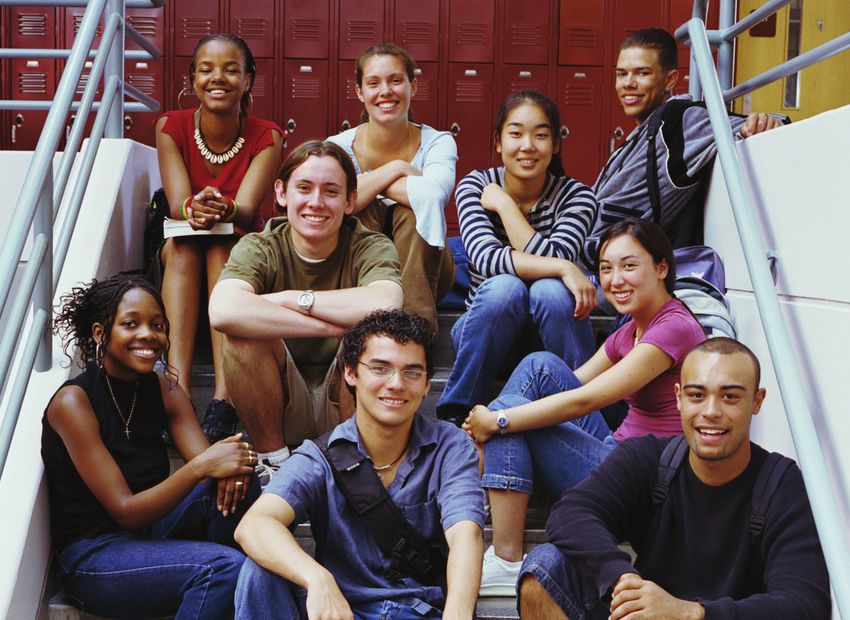
Figure 3: Top skills proficiency by educational credential (per cent)
35
30
Less than high school
25
20 High school diploma
15
PSE other than batchelor’s,
10 master’s, doctorate
5
PSE batchelor’s, master’s,
0 and/or doctorate
Literacy Level 4 or 5 Numeracy Level 4 or 5 PS-TRE Level 3
Sources: OECD; Statistics Canada.
While the number of master’s and doctoral degrees earned While the last result is positive, Canada should be doing
annually by Canadians has doubled over the past two decades, better given that adults with PSE credentials generally score
we still lag international peers.30 Canada ranks below the OECD higher than those without and there are proportionally more
average in graduate degrees awarded annually per capita31 and PSE graduates in Canada than in other countries. (See “Top
ranks 15th of 16 key competitor countries in PhDs per capita.32 In Skills Proficiency by Educational Credential”). In fact, Canadians
light of Canada’s poor performance in innovation over the past two with higher education credentials score lower than higher
decades,33 increasing the number of advanced degree holders education graduates in other countries. For example,
and employing their skills more effectively in private and public §§ Canadians with tertiary credentials scored only 290
organizations is a strategy Canada cannot afford to neglect. (out of 500) in literacy, which is below the OECD average of
297. Only three countries had lower scores.35
Skills Attainment §§ 47 per cent of Canadians with tertiary credentials scored at
Canadians’ higher education attainment is world-leading Level 3 or higher using technology to solve problems, versus
but our development of key skills is less impressive than our the OECD average of 52 per cent, putting Canada behind 14
education success would predict. of the 19 countries surveyed.36
The Impact of Immigration
LITERACY, NUMERACY AND PROBLEM-
Part of the explanation emerges from the differences in scores
SOLVING USING TECHNOLOGY
between immigrant and non-immigrant credential-holders.
The OECD’s Programme for the International Assessment of Adult
While “native-born, native-language” university graduates
Competencies (PIAAC) shows that Canadians, on average, score:
in Canada score 313 in literacy—above the OECD mean of
§§ at the OECD average in literacy; 307—“foreign-born, foreign-language” university graduates
§§ below the OECD average in numeracy; and in Canada score 275—versus the OECD mean of 273. Taking
§§ above the OECD average in using technology to solve problems.34 immigrants’ scores out of the picture would see Canada ranking
7th (rather than 13th) in literacy. By contrast, “native-born, native
language” college graduates score 281—below the OECD
mean of 287—while foreign-born, foreign-language graduates
score 251—versus the OECD mean of 253).37
30
Statistics Canada, Table 477-0020.
31
Cheung, Guillemette and Mobasher-Fard, “Tertiary Education,” 8.
32
The Conference Board of Canada, PhD Graduates (Ottawa: Conference Board, 35
OECD, OECD Skills Outlook 2013, 119. See Table A3.9 (L) and data at
2014). http://www.conferenceboard.ca/hcp/details/education/phd-graduates.aspx http://dx.doi.org/10.1787/888932901011.
33
The Conference Board of Canada, How Canada Performs—Innovation (Ottawa: 36
OECD, OECD Skills Outlook 2013. See Table A3.10 (P) and data at
Conference Board, 2014). http://dx.doi.org/10.1787/888932901030.
34
Statistics Canada, Skills in Canada: First Results from the Programme for the 37
All results in this paragraph from A. Parkin, “Is Canada’s Post-Secondary
International Assessment of Adult Competencies (PIAAC) (Ottawa: Statistics System Prepared for the Challenges of the 21st Century?” Presentation at the
Canada, 2013). http://www.statcan.gc.ca/pub/89-555-x/89-555-x2013001-eng.pdf Skills and Post-Secondary Education Summit 2013. Toronto, November 5-7, 2013.
10 Canada 2020 Skills and Higher Education in Canada www.canada2020.caExcellence
Figure 4: Essential Skills Gaps (percentage of employers observing gaps)
Critical thinking and problem solving skills
Oral communication skills
Literacy skills (reading, writting, document use)
Working with others
Continuous learning
Numeracy skills
0 10 20 30 40 50 60 70 80
Source: The Conference Board of Canada, Ontario Employers Skills Survey.
Canada’s higher proportion of immigrants explains some INNOVATION SKILLS
of the lower than expected performance on literacy among Canadians are highly educated and we rank very well in
university graduates and suggests that the higher education international comparisons of research output and quality.40
system may be performing better than initially thought. But But the innovation performance of Canadian businesses is
from the perspective of skills held in the workforce and their weak—scoring a “D” and ranking 13th of 16 peer countries in
contribution to economic and social outcomes, the fact that so the Conference Board of Canada’s Report Card on Innovation.41
many Canadians and permanent residents have less than ideal While many factors contribute to weak innovation performance,
literacy, numeracy and problem-solving skills is something inadequate innovation and commercialization skills are a key
that must be addressed. piece of the puzzle.42
ESSENTIAL SKILLS Canadian firms consistently rank skills among the top three
Essential skills are those that “provide the foundation for or four factors necessary for innovation success. In the Confer-
learning all other skills and enable people to evolve with their ence Board’s Survey on Innovation Metrics and Management,
jobs and adapt to workplace change.”38 Unfortunately, Cana- 40 per cent of firms cited employees’ skills, attitudes, and
dians appear to have weaker essential skills than economic behaviours as a “critical competitive attribute” for innovation,
and individual success require. A 2013 survey of over 1,500 placing it fourth among 19 factors necessary for innovation
Ontario employers, for example, revealed serious concerns success.43 In Statistics Canada’s Survey of Innovation and
about the essential skills of Ontario workers.39 Over 70 per Business Strategy, lack of skills was cited by over a quarter of
cent of employers reported gaps in the critical thinking and firms as an obstacle to innovation—the second most frequently
problem-solving skills of current and prospective employees. cited barrier.44
Nearly half also reported insufficient oral communication (46
per cent) and literacy skills (42 per cent) in the workforce. (See
“Essential Skills Gaps”). Canadian firms and individuals can-
not expect to excel in the face of such deficits. 40
Expert Panel on the State of Science and Technology in Canada, The State of
Science and Technology in Canada, 2012 (Ottawa: The Council of Canadian
Academies, 2013).
41
The Conference Board of Canada, How Canada Performs—Innovation
(Ottawa: Conference Board, 2014).
42
The Conference Board’s Innovation Skills Profile 2.0 identifies the skills, attitudes
and behaviours employees and managers need to contribute to innova-
tion—including creativity, problem-solving, risk assessment and risk-taking,
relationship-building, communication, and implementation skills. Innovation
Skills Profile 2.0 (Ottawa: Conference Board, 2014). http://www.conferenceboard.ca/
Libraries/PUBLIC_PDFS/InnovationSkillsProfile.sflb
38
ABC Life Literacy Canada, 9 Essential Skills. 2013. http://abclifeliteracy.ca/ 43
D. Watt and D. Munro, Skills for Business Innovation Success: It’s People Who
nine-essential-skills Innovate (Ottawa: Conference Board, 2014), 15.
39
D. Munro and J. Stuckey, The Need to Make Skills Work: The Cost of Ontario’s 44
Industry Canada, Survey of Innovation and Business Strategy (Ottawa: Statistics
Skills Gap (Ottawa: Conference Board, 2013). Canada, 2009). www.ic.gc.ca/eic/site/eas-aes.nsf/eng/ra02097.html
11 Canada 2020 Skills and Higher Education in Canada www.canada2020.caExcellence
To improve Canada’s innovation performance we need to LIFELONG LEARNING AND
improve innovation skills. A number of PSE institutions have WORKPLACE SKILLS DEVELOPMENT
taken important steps to integrate innovation skills development PSE institutions are central to developing the skills that
into their programs, but there is considerable room to offer contribute to economic, social, and individual well-being, and
more, as well as to conduct systematic assessments of outcomes there are opportunities for improvement. Workplace training
to determine what works best in developing innovation skills.45 and lifelong learning are also important, but Canada’s track record
in these areas is weak. In 2009, only 31 per cent of Canadian
UNIVERSIT Y GRADUATES ’ adults participated in some form of non-formal job-related
VIEWS OF SKILLS AT TAINMENT education. This was slightly higher than the OECD average
University graduates’ views reinforce many concerns about (28 per cent), but behind leading countries such as Sweden
skills. A 2012 survey of 15,000 graduating undergraduate (61 per cent), Norway (47 per cent), and Finland (44 per cent).47
students found that a quarter did not feel that university (See “Adult participation in non-formal job-related education”).
contributed much or very much to their knowledge of their
subject area, and only 45 per cent felt prepared for further Although more Canadians participated in 2009 (31 per cent)
study in a graduate or professional program.46 On other skills, than in 2003 (25 per cent), our performance relative to inter-
graduates’ views about the contribution of university to their national peers has slipped. In 2003, the average participation
development are underwhelming. (See Chart “Contribution rate for 13 comparator countries for whom data was available
of university education to skills development”). Subjective was 23 per cent—a rate that Canada exceeded by 2 percentage
measures of skills attainment are problematic, but the fact points. But by 2009, those same 13 countries had an average
that so many graduates believe that their university educa- participation rate of 33 per cent—a rate that Canada lagged by
tion did not contribute to their development raises pressing 2 percentage points 48 . In fact, other evidence shows that em-
questions about higher education quality. ployer spending on training and development has declined
by about 40 per cent over the past two decades. 49
Figure 5: Contribution of university education to skills development(per cent of graduates responding “much” or “very much”)
Thinking logically and analytically
Ability to access information
Ability to understand abstract reasoning
Skills for planning and completing projects
Effective study and learning skills
Commitment to lifelong learning
Identifying and solving problems
0 10 20 30 40 50 60 70 80
Source: Canadian University Survey Consortium.
47
OECD, LSO network special data collection on adult learning activities.
Tables C5.1a and C5.2a.
48
The Conference Board of Canada, Adult Participation in Education
(Ottawa: The Conference Board, 2014). http://www.conferenceboard.ca/hcp/
details/education/adult-participation.aspx
45
D. Watt and D. Munro, Skills for Business Innovation Success. 49
D. Munro, Developing Skills: Where Are Canada’s Employers? (Ottawa: The
46
Canadian University Survey Consortium. 2013 First-Year University Student Conference Board, 2014). http://www.conferenceboard.ca/topics/education/
Survey. (CUSC, 2013). commentaries/14-03-20/developing_skills_where_are_canada_s_employers.aspx
12 Canada 2020 Skills and Higher Education in Canada www.canada2020.caExcellence
Figure 6: Adult Participation in Non-Formal Job-Related Education, 2009 or Most Recent Year (per cent)
70
60
50
40
30
20
10
0
den
way
land
land
y
s
k
U.S
tria
ada
.
ce
ium
ge
lia
nd
Italy
U.K
man
and
mar
Fran
vera
trai
Irela
Aus
Can
Swe
Belg
Nor
Find
tzer
herl
Den
Ger
Aus
DA
Swi
Net
OEC
Source: OECD, Education at a Glance 2011 (Indicator C5).
To be fair, employers who invest in employee skills develop- Even when workplace training is offered, many potential
ment face an investment risk—specifically that employees participants face barriers to participation. Many are hampered
whose training they support may be “poached”, and there by limited time and resources, geography, health and confidence.52
is some evidence that this occurs.50 Even where poaching And those who participate in employer-sponsored skills
is a low risk, the widespread belief that it occurs perpetuates development are more likely to already have relatively high
a collective action problem. When employers do invest, educational attainment and skills compared with those who
the perceived risks encourage investments in specific skills do not participate. In 2008, “more than two-thirds of workers
for particular tasks and jobs rather than more general and with university degrees took part in formal work-related
transferable skills.51 This situation persists despite the fact training, while only 22 per cent of workers without a high
that larger investments in employee training can improve school diploma took part.”53 Results from PIAAC show that
employee retention. (See “Turnover Rates, by per employee participation in job-related training increases with literacy
TLD spending”). proficiency. (See “Participation of Canadians in Job-Related
Education or Training by Literacy Level”).
Simply put, the more educated and skilled an individual is,
the more likely she is to receive even more skills training,
while those who most need training are least likely to get it.
This can have pervasive, life-long effects.
52
V. Peters, Results of the 2003 Adult Education and Training Survey; OECD,
Thematic Review on Adult Learning—Canada: Country Note (Paris: OECD, 2002);
D. Munro, Job-Related Training: Barriers to Learner Participation (Ottawa: The
50
Nordicity, Labour Supply/Demand Dynamics of Canada’s Information and Conference Board, 2014). http://www.conferenceboard.ca/topics/education/
Communications Technology (ICT) Sector (Toronto: Nordicity, 2012), 22. commentaries/14-04-10/job-related_training_barriers_to_learner_participation.aspx
51
C. Halliwell, No Shortage of Opportunity: Policy Ideas to Strengthen Canada’s 53
Canadian Council on Learning, Securing Prosperity Through Canada’s Human
Labour Market in the Coming Decade. IRPP Study 42 (Montreal: Institute for Infrastructure: The State of Adult Learning and Workplace Training in Canada
Research on Public Policy, 2013), 27. (Ottawa: CCL, 2009), 26.
13 Canada 2020 Skills and Higher Education in Canada www.canada2020.caExcellence
Figure 7: Turnover Rates, by per employee TLD spending, 2008 (per cent)
Turnover Rates, by per employee TLD spendng, 2008 (per cent)
20
18
16
14 $400 or less
12
10 $401 to $1000
8
More than $1000
6
4
2
0
Voluntary Involuntary Overall
Source: The Conference Board of Canada, Learning and Development Outlook, 2009.
Figure 8: Participation of Canadians in Job-Related Education or Training By Literacy Level (per cent)
70
60
50
40
Participation in
30 Job-Related
Education or
Training
20
10
0
Below Level 1 Level 1 Level 2 Level 3 Level 4 and 5
Source: OECD, PIAAC (Figure 5.7 (L)).
Recognizing that successful workplace training depends not skills shortages, not enough are taking steps to address the
only on the behaviour of employers, but on employees and challenge. As part of an excellence agenda for skills and
other stakeholders, it is nevertheless the case that employers’ higher education in Canada, employers need to take more
weak investment in training exacerbates skills pressures and responsibility for the training that, ultimately, produces great
prevents businesses and individuals from becoming more benefits for them.54 And all stakeholders should take action
competitive. Even as many employers raise concerns about to reduce the barriers faced by Canadians who would benefit
from skills development opportunities.
54
Canadian Council on Learning, Securing Prosperity Through Canada’s Human
Infrastructure, 27.
14 Canada 2020 Skills and Higher Education in Canada www.canada2020.caExcellence
Foundational Skills §§ Reading. Canadian students scored 27 points above the
OECD average in reading, ranking 6th among 65 participating
Proficiency in certain skills—including reading, mathematics,
countries and 5th in the OECD.60 Reading scores in Canada
and science skills—among students in the K-12 system shapes
have declined, but the Council of Ministers of Education
and constrains future skills development opportunities and
in Canada maintains that the decline is not yet statistically
helps to explain advanced skills outcomes. These skills provide
significant. Still, Canada has slipped from 2nd to 6th among
a foundation upon which further learning depends, and
participating countries and the decline is significant in some
achievement by age 15 helps to explain future skills development
provinces, ranging from a 16 point drop in Quebec to a 34
performance. Although the K-12 system is beyond the scope
point drop in Manitoba.61 (See “Canadian PISA Results in
of this paper, a brief look at the skills proficiency of Canada’s
Mathematics, Reading and Science Over Time”).
15 year olds provides a useful picture of the preparedness of
Canada’s future higher education attendees and workers. With the exception of Prince Edward Island, all provinces were
at or above the OECD average.62 Additionally, girls performed
The PISA scores of Canadian 15 year olds in mathematics, significantly better than boys in reading in Canada (by 35
reading, and science are, on average, strong by international points on average)—ranging from 26 points better in British
standards. But Canada’s scores and international rankings Columbia to 53 points better in Newfoundland and Labrador.63
have slipped in recent years, and there is significant variation
across the country. §§ Science. Canadian students scored 24 points above the OECD
average in science and ranked 8th among PISA participants
§§ Mathematics. Canadian students scored 24 points above and 6th among OECD peers.64 Science scores in Canada have
the OECD average in mathematics, ranking 10th among 65 declined by 9 points over the past six years and Canada has
participating countries and 4th among OECD countries.55 slipped from 3rd to 8th place. The largest declines occurred
But recent trends are troubling. Scores have declined by 14 in Newfoundland and Labrador (11 points), Quebec (15
points across the country as a whole over the past nine years, points), Prince Edward Island (18 points) and Manitoba
with very large declines in Manitoba (36 points), Alberta (21 points).65 (See “Canadian PISA Results in Mathematics,
(32 points) and Newfoundland and Labrador (26 points).56 Reading and Science Over Time”).
(See “Canadian PISA Results in Mathematics, Reading and
Science Over Time”). Alberta and British Columbia scored higher than both the
Canadian and OECD average while Prince Edward Island
Sixteen per cent of Canadian students scored at level 5 scored below the OECD average and well below the Canadian
or 6—indicating high level performance—but an almost average.66 There were no statistically significant gender
equal proportion (15 per cent) scored at or below the level differences in science performance among Canadian 15 year
of basic proficiency needed to participate in modern life.57 olds who took the PISA test.
Wide variation across provinces is also evident, with Quebec
leading all provinces and, along with BC, scoring higher than
both the Canadian and OECD averages, while students in
Prince Edward Island score well below both the Canadian
and OECD averages.58 Finally, boys performed better than
girls in Canada (by 10 points on average), but this was only
statistically significant in four provinces – Quebec, Ontario,
Alberta, BC.59
60
CMEC, Measuring Up, 34-5.
61
CMEC, Measuring Up, 40
55
CMEC, Measuring Up, 18. 62
CMEC, Measuring Up, 37.
56
CMEC, Measuring Up, 30. 63
CMEC, Measuring Up, 40.
57
CMEC, Measuring Up, 24-5. 64
CMEC, Measuring Up, 36.
58
CMEC, Measuring Up, 19-21. 65
CMEC, Measuring Up, 41.
59
CMEC, Measuring Up, 27. 66
CMEC, Measuring Up, 37.
15 Canada 2020 Skills and Higher Education in Canada www.canada2020.caExcellence
Figure 9: Canadian PISA Results in Mathematics, Reading and Science Over Time (Score)
540
535
530
525
Science
520
Reading
515
Mathematics
510
505
500
2000 2003 2006 2009 2012
Source: CMEC.
From Expansion to Excellence In particular, we should consider ways to assess learning
outcomes more directly, encourage and incentivize institutions
Canada’s performance on skills and higher education is
to improve skills outcomes, and hold them accountable
impressive on many levels, but we may not be achieving the
for performance. We should be much more attentive to the
level of excellence we require to sustain and enhance economic
quality of graduates’ skills—including literacy, numeracy,
prosperity and social well-being. Simply producing more
critical thinking, problem-solving, communication, and
graduates of lower quality is not an ideal strategy for economic
innovation and employability skills—and support initiatives
competitiveness, nor social and individual well-being. We
that enhance those skills. And we should think about ways
need to focus on the quality of education, the mix of disciplines,
to encourage more students to pursue degrees in the STEM
the number and quality of advanced degree holders, and
disciplines and advanced degrees such as master’s and PhDs
opportunities to sustain and enhance skills through workplace
in order to support both business and social innovation.
training and life-long learning.
16 Canada 2020 Skills and Higher Education in Canada www.canada2020.ca4
Introduction
EQUITY
While many Canadians have developed advanced skills and completed higher education
and enjoy the associated economic and other benefits, many others face barriers to
participation and completion, leaving them and the country economically and socially
less secure and successful than they could be. Differences in skills and educational
attainment track characteristics that include Aboriginal status, gender, and immigration,
as well as region. In some cases, these disparities harm both those left out and the
economic and social well-being of Canada overall.
Higher education and the development of advanced skills §§ Notably, 14.4 per cent of those who identify as Aboriginal
are not for all Canadians. Some may simply choose to pursue held a trades certificate—a rate that is more than two per-
other paths. But in too many cases, participation and achieve- centage points higher than the non-Aboriginal attainment of
ment are determined not by choice, but by circumstances 12 per cent.68
over which individuals have little control. Where communi-
ties and governments have power to shape those circum- GAPS IN SKILLS DEVELOPMENT
stances it is imperative that we discuss whether and how There are also substantial gaps between Aboriginals and non-
to do so. In addition to designing and pursue an excellence Aboriginals in the development of core skills. PIAAC results
agenda for skills and higher education, we need to design and show that, on average, the Aboriginal population scores below
pursue an equity agenda. the non-Aboriginal population in both literacy and numeracy.
§§ On average, the Aboriginal population scored 260 (out of
Aboriginal Achievement 500) in literacy versus 274 for the non-Aboriginal population.
Many who identify as Aboriginal have earned university, college §§ The average numeracy score for the Aboriginal population
and/or trades credentials and many exhibit advanced skills that was 244 versus 266 for the non-Aboriginal population.69
contribute to economic, social, and individual well-being. But
there is a large achievement gap between Aboriginal and non- The size of the gaps varies across provinces and territories, and
Aboriginal individuals that contrasts sharply both with Canada’s it narrows or widens in different age cohorts. But across all prov-
egalitarian values and responsibilities to Aboriginal peoples. inces, territories and age groups tested, the Aboriginal population
consistently scores below the non-Aboriginal population.
HIGHER EDUCATION AT TAINMENT
By 2011, 48 per cent of those who self-identify as Aboriginal SKILLS DEVELOPMENT
held a post-secondary credential. This was higher (55 per BY EDUCATIONAL AT TAINMENT
cent) for those reporting Métis as their single identity, but However, comparing the skills attainment of Aboriginal and
lower (36 per cent) for those reporting Inuit as their single non-Aboriginal populations with similar levels of education
identity.67 Overall, there is an attainment gap of 16 percentage reveals an interesting picture. Similarly educated cohorts of
points between the Aboriginal and non-Aboriginal popula- Aboriginal and non-Aboriginal individuals achieve nearly
tions in Canada. identical literacy scores and similar numeracy scores.70
Among those with Bachelor’s degrees or higher, Aboriginal
§§ Fewer than 10 per cent of Aboriginals held a university degree graduates score slightly higher on literacy (305) than non-
(versus 27 per cent of non-Aboriginals) and 21 per cent held a Aboriginal graduates (300).
college diploma (versus 25 per cent for non-Aboriginals).
68
Statistics Canada, The educational attainment of Aboriginal peoples in Canada, 4.
67
Statistics Canada, The educational attainment of Aboriginal peoples in Canada 69
CMEC, “PIAAC in Canada.” Slide Presentation. 2013.
(Ottawa: Statistics Canada, 2013), 7. 70
CMEC, “PIAAC in Canada.” Slide Presentation. 2013.
17 Canada 2020 Skills and Higher Education in Canada www.canada2020.caEquity
Figure 10: Educational Attainment and Literacy Scores, Aboriginals (off-reserve)
and Non-Aboriginals (per cent educational attainment; PIAAC literacy score out of 500)
40 320
35 305
35
33
300 Educational Attainment:
30 300
Aboriginal (Off reserve)
30
26 26 280
25
25 Educational Attainment:
Non-Aboriginal
20 273 260
234
276
14 Literacy Score:
15
Aboriginal (Off reserve)
267 11 240
265
10
Literacy Score:
225 220 Non-Aboriginal
5
0 200
Less than high school High school PSE - Below Bachelor’s PSE - Bachelor’s or Higher
Sources: CMEC, OECD.
Figure 11: Educational Attainment and Numeracy Scores, Aboriginals (off-reserve)
and Non-Aboriginals (per cent educational attainment; PIAAC numeracy score out of 500)
40 320
35
35
33 300 Educational Attainment:
30 295
Aboriginal (Off reserve)
30
26 290 26 280
25
25 Educational Attainment:
Non-Aboriginal
248
20 260
207 269
260 Numeracy Score:
15 14
Non-Aboriginal
240
257 11
10
Numeracy Score:
223 220 Aboriginal
5
0 200
Less than high school High school PSE - Below Bachelor’s PSE - Bachelor’s or Higher
Sources: CMEC, OECD.
18 Canada 2020 Skills and Higher Education in Canada www.canada2020.caIntroduction
At first glance, it appears that skills levels relate more to edu-
cational attainment than to Aboriginal status which would
Gender Gaps
Differences in skills and higher education achievement
suggest that improving PSE access and completion rates for
between Canadian men and women are another challenge.
Aboriginal people could lead to enhanced skills. But it is not
On some measures, men outperform women, while in others
clear how much of a contribution education makes to skills
the reverse is true. Notable differences in the kinds of higher
development (versus serving as a selection and sorting mech-
education paths men and women pursue and the benefits
anism for already highly skilled people). Nor is it clear that
they experience are another issue to examine.
enough has been done to prepare more Aboriginal students to
succeed in higher education. The high proportion of Aborigi-
nal students who do not complete high school (nearly 30 per EDUCATIONAL AT TAINMENT
cent) is a glaring indicator of the challenge and highlights Canadian women are more likely to have a university or col-
that the issue is much broader than the PSE system alone. lege credential, but much less likely to have a trades certifi-
cate, than Canadian men.
LABOUR MARKE T OUTCOMES §§ Among adults aged 25-64, university credentials are held by
Higher education and skills attainment for Aboriginals is 28 per cent of women and 26 per cent of men, while college
not always associated with better labour market outcomes. credentials are held by 28 per cent of women and 21 per cent
Aboriginals with PSE credentials have lower employment of men.
and participation rates, and higher unemployment rates, §§ Overall, there is a gap of nearly 10 percentage points be-
than non-Aboriginals with PSE credentials. And although tween women and men in terms of university and college
Aboriginal graduates earn higher incomes than Aboriginal completion—placing Canada 9th among 16 peer countries in
non-graduates, there is persistent income inequality between the Conference Board of Canada’s analysis of gender gaps in
Aboriginal and non-Aboriginal graduates.71 tertiary education.72
Table 1: Employment Outcomes of Aboriginal In the younger 25 to 34 age cohort, the gap is even wider.
and non-Aboriginal populations, aged 25-54, with PSE
§§ Sixty five per cent of women and 49 per cent of men aged 25
ABORIGINAL NON-ABORIGINAL WITH to 34 hold a university or college credential—a gap of 16 per
WITH PSE CREDENTIAL PSE CREDENTIAL
(PER CENT) (PER CENT) cent.73 For this age cohort, Canada ranks 12th among 16 peer
UNEMPLOYMENT RATE 9.5 5.7 countries on gender equity in tertiary education.74
EMPLOYMENT RATE 76.0 84.5
As the Conference Board notes, “just 20 years ago, a smaller
PARTICIPATION RATE 84.0 90.0
proportion of women than men had a tertiary education, and
Source: Statistics Canada (71-588-X, no.3).
a key challenge was to make higher education more acces-
sible and welcoming to women. While the challenge remains
All of this suggests that while PSE completion can improve
in some of the mathematics, computer, and engineering
the economic and social well-being of Aboriginal graduates,
disciplines, the overall gender imbalance tipped in women’s
addressing persistent socio-economic inequalities between
favour in Canada in the early 1990s.”75 Some are now asking
Aboriginal and non-Aboriginal populations will require more
whether there is a “boy crisis” in education and wondering
than an education strategy. Still, given how critical skills
what can be done to address it.76
and education are to various social and economic outcomes,
supporting higher participation and achievement among
Aboriginals in Canada must be a key goal.
72
The Conference Board of Canada, Gender Gap in Tertiary Education (Ottawa:
Conference Board, 2014). http://www.conferenceboard.ca/hcp/details/educa-
tion/gender-gap-tertiary.aspx
73
Statistics Canada, Education in Canada, 9.
74
The Conference Board of Canada, Gender Gap in Tertiary Education.
75
The Conference Board of Canada, Gender Gap in Tertiary Education.
71
TD Economics, Employment and Education Among Aboriginal Peoples: A New 76
Paul Cappon, Exploring the “Boy Crisis” in Education (Ottawa: Canadian Coun-
Perspective From the 2011 National Household Survey (Toronto: TD Economics, 2013). cil on Learning, 2011), 1.
19 Canada 2020 Skills and Higher Education in Canada www.canada2020.caIntroduction
In the skilled trades, however, men aged 25 to 64 are almost Individuals will choose different education paths for a variety
twice as likely to have achieved certification (15 per cent) as of personal reasons, but we must ensure that all paths are
women (8 per cent). In the younger 25 to 34 age cohort, 79 per open to both men and women. If women freely choose STEM
cent of those who hold a Registered Apprentice certificate pathways less often than men, or if men freely choose trades
are men.77 Moreover, a high proportion of trade certificates rather than college or university more often than women,
earned by women tend to be in fields such as personal ser- that is fine. But if, in reality, those choices are constrained by
vices (e.g., hairstyling, esthetics) and cooking where labour differences in early-life acquisition of foundational skills and/
market outcomes are weaker.78 or by inhospitable educational or occupational cultures, then
attention is needed.
LITERACY, NUMERACY
AND PROBLEM-SOLVING SKILLS Immigrant Achievement
A similarly mixed story emerges when we examine the lit-
eracy, numeracy, and problem-solving skills of Canadian men
and Recognition
and women. To meet its skills needs, Canada relies to a great extent on immi-
grants. Given the way Canada selects immigrants, on average,
§§ The literacy and problem-solving skills of Canadian men and
they tend to have higher educational attainment than other
women, as measured by the OECD’s PIAAC, are essentially
Canadians. The 2006 census showed that while 19 per cent of all
the same—though in the 55 to 64 age group, men score
Canadians held a university degree, more than half (51 per cent)
slightly higher than women in literacy and more men (19 per
of recent immigrants had attained a university degree.83
cent) than women (14 per cent) score at the highest levels in
problem-solving in technology-rich environments.79 At the same time, many immigrants have weaker literacy and
§§ However, PISA scores for Canadian 15 year olds highlight communication skills (as noted above) and their educational
a gap in reading achievement. Girls performed better than and occupational credentials are often not recognized by
boys in reading in Canada by 35 points on average—ranging Canadian institutions and employers. Consequently, labour
from 26 points better in British Columbia to 53 points better market outcomes for immigrants are weaker than similarly
in Newfoundland and Labrador.80 Given the importance of educated and skilled Canadians. The employment rate of
reading as a foundation for future education and lifelong university-educated immigrants (as of March 2014) stood at
learning, that gap requires attention. 68.8 per cent, versus a rate of 78 per cent for university degree-
holders born in Canada. The unemployment rate for universi-
With respect to numeracy, the situation is reversed.
ty-educated immigrants stood at 7 per cent, versus a mere 3.1
§§ PIAAC results show a gap of nearly 15 points between men per cent for those born in Canada with university degrees.84
(273) and women (258) in numeracy. The gap is largest in the This is all the more remarkable when one considers that im-
55-64 age group—with men scoring 262 and women scoring migrants hold the majority of STEM degrees in Canada which
242—and smallest in the 16-24 age group—with men scoring tend to be in higher demand than some other disciplines.
273 and women scoring 264.81
§§ PISA mathematics scores of 15 year old Canadians indicate If Canada is going to rely on highly educated immigrants to
that things are not likely to improve anytime soon. Canadian meet skills and occupational needs, then a better system of
boys outperformed girls by 10 points on average—though this credential recognition will be needed. Additionally, given the
was only statistically significant in four provinces (Quebec, integration challenges many immigrants face, additional es-
Ontario, Alberta, B.C.).82 Given how important math skills sential and other skills training should be provided to ensure
are in the STEM disciplines, and given our need to improve that they are able to use their full range of skills to contribute to
STEM participation and performance—especially among Canada’s economy and society, as well as their own well-being.
women—there is a need to take action on the numeracy gap.
77
Statistics Canada, Education in Canada, 9.
78
D. Boothby and T. Drewes, Returns to Apprenticeship in Canada (Ottawa: C.D.
Howe Institute, 2010).
79
Statistics Canada, Skills in Canada, 29. 83
Employment and Social Development Canada, Learning: Educational
80
CMEC, Measuring Up, 40. Attainment (Ottawa: ESDC, 2014). http://www4.hrsdc.gc.ca/.3ndic.1t.4r@-eng.
81
Statistics Canada, Skills in Canada, 86. Table B.2.3. jsp?iid=29#M_5
82
CMEC, Measuring Up, 27. 84
Statistics Canada, Table 282-0105. http://www5.statcan.gc.ca/cansim/a05
20 Canada 2020 Skills and Higher Education in Canada www.canada2020.caYou can also read