Social Norms and Elections: How Elected Rules Can Make Behavior (In)Appropriate - Econtribute
←
→
Page content transcription
If your browser does not render page correctly, please read the page content below
ECONtribute
Discussion Paper No. 068

    Social Norms and Elections: How Elected
    Rules Can Make Behavior (In)Appropriate

                Arno Apffelstaedt                    Jana Freundt                     Christoph Oslislo

February 2021                                                                                        www.econtribute.de

                      Funding by the Deutsche Forschungsgemeinschaft (DFG, German Research Foundation) under
                          Germany´s Excellence Strategy – EXC 2126/1– 390838866 is gratefully acknowledged.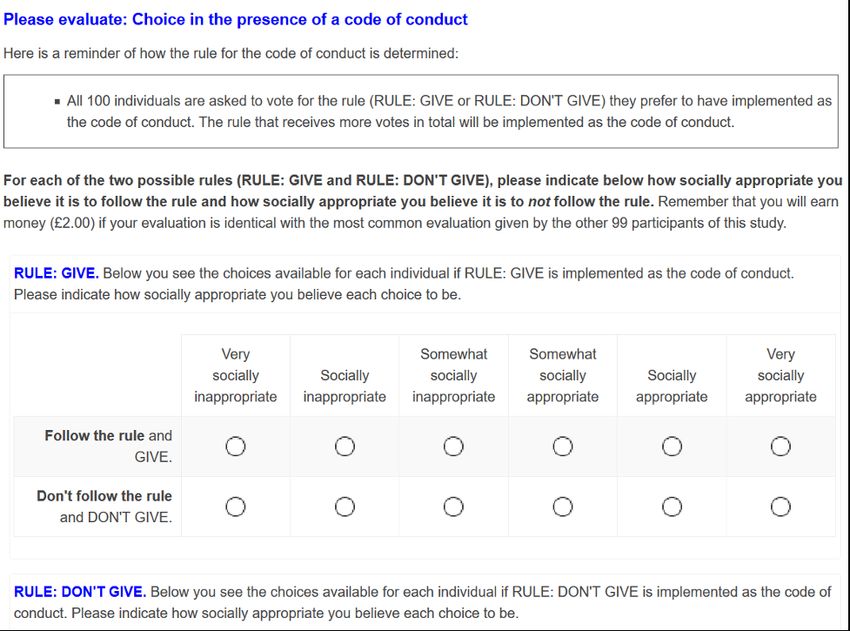
Social norms and elections:
            How elected rules can make behavior (in)appropriate∗
                        Arno Apffelstaedt        Jana Freundt Christoph Oslislo

                                    This Version: 27th February 2021

                                                    Abstract

       Can elections change people’s ideas about what is ethically right and what is wrong? A number of
       recent observations suggest that social norms can change rapidly as a result of election outcomes.
       We explore this conjecture using a controlled online experiment. In our experiment, participants
       rate the social appropriateness of sharing income with poorer individuals. We compare situations
       in which a rule has been elected that asks people to share or not to share, respectively, with
       situations in which no rule has been elected. In the absence of an election, sharing is widely
       considered socially appropriate, while not sharing is considered socially inappropriate. We show
       that elections can change this social norm: They shift the modal appropriateness perception
       of actions and, depending on the elected rule, increase their dispersion, i.e. erode previously
       existing consensus. As a result, actions previously judged socially inappropriate (not sharing)
       can become socially appropriate. This power prevails, albeit in weaker form, even if the election
       is subject to controversial practices such as vote buying or voter disenfranchisement. Drawing
       on behavioral data from another experiment, we demonstrate that election-induced norm shifts
       predict behavior change.

 Keywords:      social norms, elections, prosocial behavior, rule compliance
 JEL Codes:     D02, D91, C91

   ∗
    Apffelstaedt: University of Cologne, Center for Social and Economic Behavior (C-SEB) and ECONtribute. Ad-
dress: Albertus-Magnus-Platz, 50931 Cologne, Germany. Email: apffelstaedt@wiso.uni-koeln.de. Phone: +49 221
470 1842. Freundt: University of Fribourg, Department of Economics and University of Pennsylvania, School of
Arts and Sciences. Address: University of Fribourg, Boulevard de Pérolles 90, 1700 Fribourg, Switzerland. Email:
jana.freundt@unifr.ch. Phone: +41 26 300 8267. Oslislo: University of Cologne, Institute for Economic Policy.
Adress: Pohligstraße 1, 50969 Cologne, Germany. Email: oslislo@wiso.uni-koeln.de. Phone: +49 221 470 5351. We
thank the Graduate School of Economics and Social Sciences of the University of Hamburg and the Chair of Industrial
Economics at the University of Fribourg for funding. Apffelstaedt further thanks the German Research Foundation:
Funded by the Deutsche Forschungsgemeinschaft (DFG, German Research Foundation) under Germany’s Excellence
Strategy – EXC 2126/1 – 390838866.

                                                        1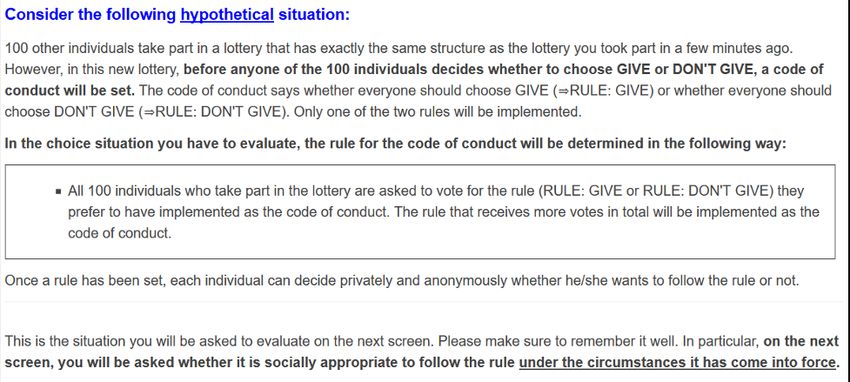
1     Introduction
Can elections shift people’s ideas of what is ethically right and what is wrong? A number of recent
observations suggest that social norms, often considered persistent long-standing social constructs,
can change rapidly as a result of election outcomes. In 2016, shortly after the United Kingdom
voted for Brexit, the country experienced a sharp rise in hate crime, which many observers attribute
to a Brexit-induced increase in the social acceptability of xenophobic views and actions. As a result
of the referendum, “anti-immigrant and anti-foreigner rhetoric had become ‘normalised’ ”, making
Britain effectively “a more racist country”, the United Nations claim.1 Similar claims were made
after the election of Donald Trump as president of the United States that same year.2 There are also
examples where elections appear to have lead to more tolerant norms: Baskaran and Hessami (2018)
and Kedia and Pareek (2020) observe that electoral successes of female candidates in Germany and
the US, respectively, seem to have improved norms regarding the treatment of women and reduced
bias against them in elections as well as in the workplace. Jung and Tavits (2021) document an
increase in the social acceptability of abortion following a pro-abortion vote in the Irish referendum
of 2018.
    Social norms—defined as “shared understandings about actions that are obligatory, permit-
ted, or forbidden” (Ostrom, 2000, p.144)—govern many parts of our everyday lives, ranging from
economic and political decisions to cultural practices and are thus an important element of any
social group. If the general conjecture that elections can influence norms is true, it most likely
holds for other domains as well, be it norms regarding same-sex relationships (Aksoy et al., 2020),
compliance with Covid-19 regulations (Galbiati et al., 2020), or everyday behavior such as alcohol
consumption (Lane and Nosenzo, 2019). However, a fundamental challenge is that elections are
typically not exogenous to the society in which social norms evolve and thus, observed differences
in social norms may as well be attributed to other (potentially unobservable) factors that correlate
with the election outcome, which makes it difficult to establish causality.
    In this paper, we provide causal evidence on the effect of elections on social norms using a simple
experiment. Our experiment abstracts from the complexity of a real world election and introduces
a majority vote on a simple rule of behavior. The elected rule targets a rather general domain in
which social norms have been shown to be highly important for behavior, namely prosociality. A
major contribution of our study is that we provide direct clean evidence of whether social norms can
change as a result of elections, thereby complementing previous studies that cannot directly identify
social norms and disentangle their impact from, for example, personal moral views or changes in
    1
      See Brown, D. and Coates, S., “UK ‘more racist after Brexit”’, The Times, May 12, 2018. Available at:
https://www.thetimes.co.uk/article/uk-more-racist-after-brexit-qb7hd7xl7 (accessed February 18, 2021).
    2
      Many popular press articles reported an increase in racially motivated violence and sexism after Trump’s election,
the cause of which was attributed to a change in social norms. The election of a person who is “openly hostile to
women [...] normalizes abusive behavior and gives implicit permission for others to perpetuate it”, the Huffington
Post (Nov 16, 2016), for instance, writes. See Jeltsen, M., “Trump’s Election Raises Fears Of Increased Violence
Against Women”, The Huffington Post, Nov 16, 2016. Available at: https://www.huffpost.com/entry/trump-
women-rights-violence-fears_n_582a0f63e4b02d21bbc9f186 (accessed February 18, 2021).

                                                           2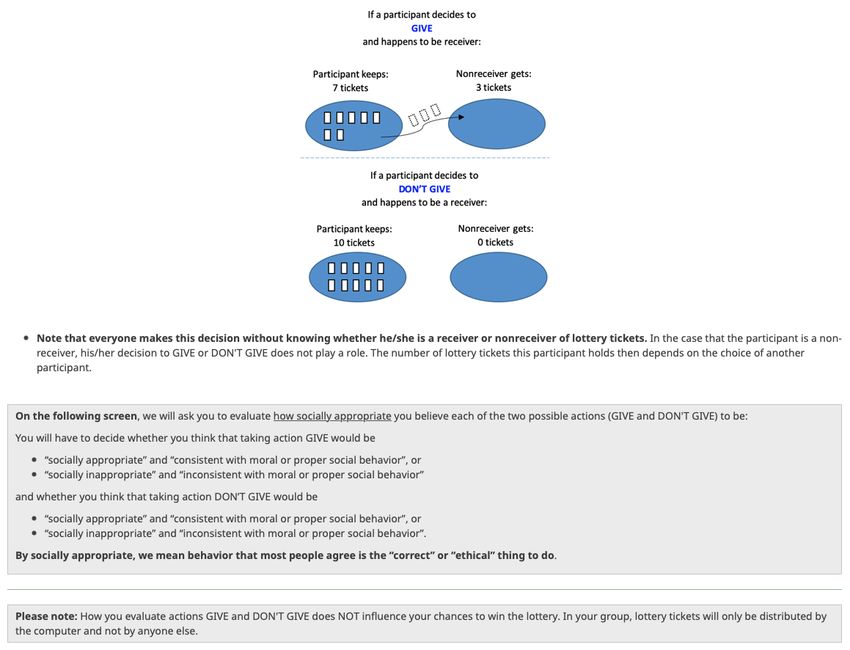
preferences.
   Our experimental setting is as follows. For each treatment, 100 international subjects are
recruited via the online platform Prolific. Among the subjects of each treatment, we distribute
experimental income unequally, making 50% of the subjects “rich” and 50% “poor”. We then
ask subjects to rate, on a scale from very socially inappropriate to very socially appropriate, two
opposing actions, Give and Don’t Give, where “Give” means that a rich subject shares her income
with a randomly selected poor subject and “Don’t Give” means that the subject does not share
her income. Following the elicitation method proposed by Krupka and Weber (2013), subjects are
incentivized to provide a rating that is identical with the most common rating in their session,
making the elicited social approval a direct elicitation of social norms or “normative expectations”.
   In our main treatment (T StdMajority), we elicit social approval ratings conditional on a simple
majority vote among participants having elected a behavioral rule. The elected rule tells subjects
either that “everybody should choose Give” (Rule:Give) or that “everybody should choose Don’t
Give” (Rule:Don’t). To identify the effect of this election on social norms, we compare the ratings
elicited in T StdMajority to the ratings in a benchmark treatment T NoRule in which subjects rate
actions Give and Don’t Give in the absence of an election. We find that the election indeed has a
strong impact on social norms. Most impressively, and much in line with the anecdotal evidence
reported above, we show that majority-elected rules can cause actions previously judged socially
inappropriate (Don’t Give) to become socially appropriate. This is the case, specifically, if the
elected rule asks subjects to not give (Rule:Don’t). We also find a statistically significant effect on
social norms of Rule:Give being elected into power, but the size of the effect is much smaller.
   Having established this main result, we answer two additional questions. First, we ask whether
norm shifts require “free and fair” majority votes. To answer this question we conduct three
additional treatments that describe a situation in which votes have been manipulated by asking
voters to pay a fee, by offering them money to change their vote or by excluding poor voters.
After a manipulated election, elected rules still shift social norms about prosocial actions, but their
power to do so is weakened. Finally, we ask the question of whether the norm shifts we observe
in our experiment can predict changes in behavior. Drawing on behavioral data from a previous
experiment in Apffelstaedt and Freundt (2020), we show that social norms indeed predict giving
decisions under each elected rule in a different sample of participants.
   In a separate section, we discuss our results and relate them to possible channels of how elections
can change normative expectations. As a first channel, we discuss the possibility that elections carry
informative value about the underlying preferences in society. As a second channel, we discuss the
possibility that showing compliance with the elected rule (irrespective of its content) may be a
source of social approval. Our discussion leads to an important question: Do elections always lead
to more agreement on social norms? In our experiment, in addition to observing shifts in modal
appropriateness, we observe that elections can lead ratings to become more dispersed. In other
words, elections can erode previously existing norm consensus. Both the election-induced mean

                                                  3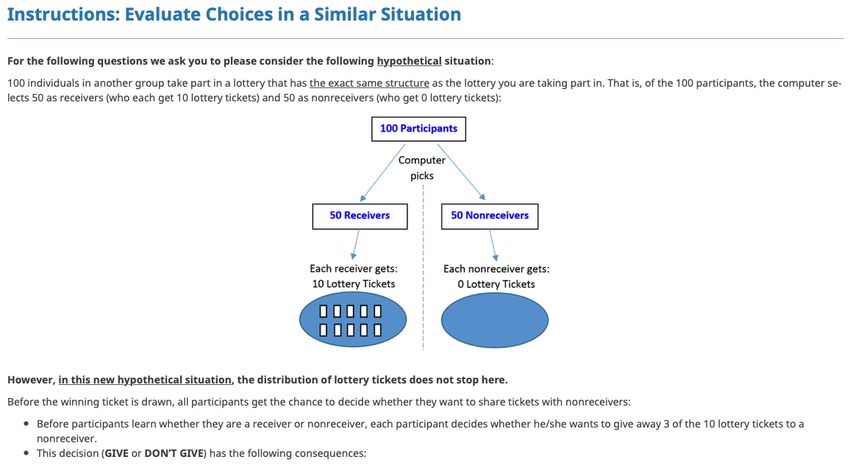
shift and the erosion of consensus could be responsible for affecting people’s moral behavior.

Related Literature.         In this paper, we focus on so-called injunctive norms or normative expecta-
tions in a   population.3   Building on work by Cialdini and Trost (1998) and Ostrom (2000), Krupka
and Weber (2013) define injunctive social norms as collective perceptions or judgments regarding
the appropriateness of actions. This requires that norms are ”jointly recognized, or collectively
perceived, by members of a population” (Krupka and Weber, 2013, pp.498-499).
    In this context, our results contribute to four different literatures. First, our work complements
a handful of previous papers that examine factors in the institutional environment that can cause
long-standing social norms to change. For instance, recent research has shown that social norms
can change quickly as a result of policy interventions. One example are studies of so-called ”norm-
nudges” (for overviews see Bicchieri and Dimant, 2019; Hauser et al., 2018). In particular, our work
adds to a recent literature that examines how public decision-making processes (such as elections,
initiatives, or referenda) can lead to very rapid changes in social norms, which in turn can lead
to changes in behavior. Jung and Tavits (2021) argue, based on results of a panel survey, that
the outcome of the 2018 Irish abortion referendum changed Irish citizens’ perceptions of the social
norm regarding abortion. Baskaran and Hessami (2018) and Kedia and Pareek (2020) show that
elections have the potential to affect norms regarding gender as well as gender-related behavioral
outcomes. Using an experimental setup, Bursztyn et al. (2020a) show that Donald Trump’s victory
in the 2016 Presidential election increased individuals’ willingness to publicly express xenophobic
views as well as accept related expressions by others.4 In a similar vein, Albornoz et al. (2020) argue
that the increase in hate crime following the Brexit referendum should be attributed to a change
in social norms: They show that hate crime spiked especially in regions in which the outcome of
the election came as a surprise and thus, can be explained by an update of beliefs about whether
xenophobic views are extreme or mainstream (Albornoz et al., 2020). In the existing studies,
the effect of elections on social norms is inferred indirectly from observed behavior or revealed
preferences. Our experimental design instead allows us to directly elicit social norms and thus
examine the immediate response of norms to elections. Using a well-established norm elicitation
method (Krupka and Weber, 2013), we highlight the role of shifts in the social appropriateness of
actions in bringing about behavioral change. To our knowledge, our paper is the first to directly
measure changes in social norms in response to the election of a behavioral rule.
    Second, our paper contributes to a growing experimental literature on the effect of social norms
on behavior. This literature assumes that most individuals tend to learn and follow social norms,
leading, for instance, to a willingness to constrain selfish behavior (Ostrom, 2000, p.143,149).
Following this conjecture, a number of recent experiments show that many people do indeed have
   3
      We do not consider descriptive norms or empirical expectations, i.e. expectations about what others actually
do. For a discussion of both concepts see also Bicchieri (2010, 2016); Bicchieri and Dimant (2019). Several studies
have shown that both, injunctive and descriptive norms, can influence behavior (e.g., Bicchieri and Chavez (2010);
Bicchieri et al. (2020a); Bursztyn et al. (2020b); Cialdini et al. (1990); Krupka and Weber (2009)).
    4
      For related results see Crandall et al. (2018) and Huang and Low (2017).

                                                        4
an intrinsic preference to conform to what is collectively perceived as socially appropriate, and that
norm conformity can explain behavior in a variety of social contexts (Kimbrough and Vostroknutov,
2016; Krupka et al., 2017; Gaechter et al., 2017). Krupka and Weber (2013) find that social norms
vary with different framings in dictator games and argue that this variation can provide a plausible
explanation for observed differences in behavior. By providing information about the moral views
of others, Bursztyn et al. (2020b) manage to directly manipulate perceived social norms and show
that this in turn changes behavior. Importantly, these studies suggest that there is a fairly stable
preference for following social norms across different settings. Our results are consistent with these
findings: In our experiment, we observe systematic shifts in individual perceptions of social norms
and present evidence that—by assuming a stable preference for following social norms exists—
these shifts are well suited to explain behavioral changes after elections. Note that we are primarily
interested in changes in perceived social norms in a society, which is conceptually distinct from
studies that examine changes in individual adherence to existing stable norms (e.g. Bicchieri et al.,
2020b).
Third, our work adds to the literature on determinants of prosocial behavior and the analysis
of the broader set of motives that shape people’s social conduct. Norms and social pressure have
been found to be important driving factors of altruistic behavior by attaching honor to good deeds
and shame to selfish behavior (Bénabou and Tirole, 2006). A number of experimental studies has
since then investigated the crucial role of social norms for prosocial behavior in various contexts
(Krupka and Weber, 2009; Gaechter et al., 2012; Kimbrough and Vostroknutov, 2016). Our results
confirm the view that prosocial behavior can be highly context-dependent and that a shift in social
norms can lead to large shifts in prosocial outcomes. We add to the literature by showing that
norms regarding prosocial behavior can be influenced by elections.
Fourth, we link to a recent literature that examines how rules and laws can change attitudes
and social norms and thus influence behavior beyond the imposition of explicit sanctions. Using
survey data, Galbiati et al. (2020) show that social distancing rules during the Covid-19 pandemic
causally affected social norms regarding social interactions. Several other studies empirically
investigate how laws shape attitudes on morally controversial issues, e.g., by studying the
efficacy of anti-discrimination laws (Aksoy et al., 2020; Barron and Hebl, 2010, 2013). However,
these studies are usually not able to disentangle precise channels to explain where changes in
behavior or personal opinions stem from. An exception is Lane and Nosenzo (2019), who provide
direct evidence that the legal status of an action causally affects its normative appropriateness.
We investigate how democratically elected rules, in particular, affect social norms and thus behavior.
The paper proceeds as follows. In the next section, we explain the experimental setup in detail.
In section 3 we present our results. In section 4, we discuss our findings with a focus on possible
mechanisms and ways in which elections can influence and change norms. Section 5 concludes.
52 The Experiment
We design an experiment to analyze the influence of majority-elected rules on social norms. In our
experiment, subjects have to rate two actions, Give and Don’t Give, on a scale from very socially
inappropriate to very socially appropriate. We are interested in how ratings are influenced by the
majority election of a behavioral rule which either demands that “everyone should choose GIVE”
(Rule:Give) or that “everyone should choose DON’T GIVE” (Rule:Don’t). To be able to interpret
the elicited ratings as a social norm, we use the elicitation method suggested by Krupka and Weber
(2013): Subjects are told that “by socially appropriate, we mean behavior that most people agree is
the ‘correct’ or ‘ethical’ thing to do” and are incentivized to provide a rating that is identical with
how most of the other subjects in their treatment evaluate the action.
We run four election treatments and one benchmark treatment (see Table 1). In the election
treatments, subjects are asked to rate actions Give and Don’t Give under the assumption that
Rule:Give or Rule:Don’t has been elected into power. Between treatments, we vary the specifics of
how the rule is elected. In our main treatment (T StdMajority), we ask subjects to assume that
the rule is elected by a simple majority vote, counting the votes of all 100 subjects who take part
in the experimental session. The other three election treatments (T Pay4Vote, T MoneyOffer, and
T ExcludePoor) allow us to investigate whether social norms only shift in response to “free and
fair” elections. Here, we consider majority votes that are subject to controversial practices which
likely result in a subset of votes either being manipulated or not counted in the election. Finally,
treatment T NoRule is a benchmark treatment which provides us with social appropriateness rat-
ings (i.e., social norms) of actions Give and Don’t Give in the absence of an election. All treatments
are between-subjects. We expect behavioral rules implemented by a referendum to have predictive
power for the perceived social appropriateness of the respective behavior after the election. Specif-
ically, we predict that the referendum will shift upward the social approval of actions that comply
with the elected rule and will shift downward the social approval of actions opposed to the elected
rule. Intuitively, we also expect that referenda that can be perceived as being less democratic will
have a reduced (moral) power to shift social norms.
Treatment Election? Description n
T NoRule No Rating of actions in the absence of an election (benchmark rating) 100
T StdMajority Yes Rules elected by standard majority vote (all votes counted) 100
T Pay4Vote Yes Voters have to pay £0.20 to make vote count 100
T MoneyOffer Yes Voters are offered £0.20 to vote for the opposite rule 100
T ExcludePoor Yes Voters with household income < GBP 40K excluded from ballot 100
Table 1: Overview of Treatments
6Our main predictions guiding the design and analysis of our experiment are as follows:
Prediction 1. Majority-elected rules shift social norms. Relative to T NoRule, the election of
Rule:Give (Rule:Don’t) will shift upward (downward) the social approval rating of action Give and
will shift downward (upward) the social approval rating of action Don’t Give.
Prediction 2. “Free and fair” elections have the strongest power to change norms. Relative to
T NoRule, the effect of elected rules on social approval ratings will be largest in T StdMajority.
2.1 Design
The experimental design builds on Apffelstaedt and Freundt (2020). In Apffelstaedt and Freundt
(2020), we investigate the extent to which rules enacted through (more or less) democratic elections
affect people’s behavior. For the present paper, we adapted the design of the experiment to be able
to investigate whether elections shift social norms.
Give or Don’t Give. Social norms in our experiment concern choices in a simple behavioral
paradigm. In a group of 100 subjects, income is distributed unequally. Before learning whether
one is rich or poor, each subject has to decide privately whether to Give or Don’t Give, where
“Give” means that, conditional on being rich, the person shares her income with another (poorer)
subject and “Don’t Give” means that the subject does not share her income. We operationalize
this paradigm using a lottery: In each treatment, we raffle a cash prize of £100 among the 100
participating subjects. At the beginning of the experiment, subjects learn that lottery tickets for the
raffle will be distributed unequally: While 50 subjects receive 10 lottery tickets each, the remaining
50 subjects receive no (zero) lottery tickets. Actions Give and Don’t Give are then introduced as
follows: “If you happen to be a receiver of lottery tickets, do you want to GIVE or DON’T GIVE
3 of your 10 lottery tickets to a randomly selected participant who has received no tickets?”
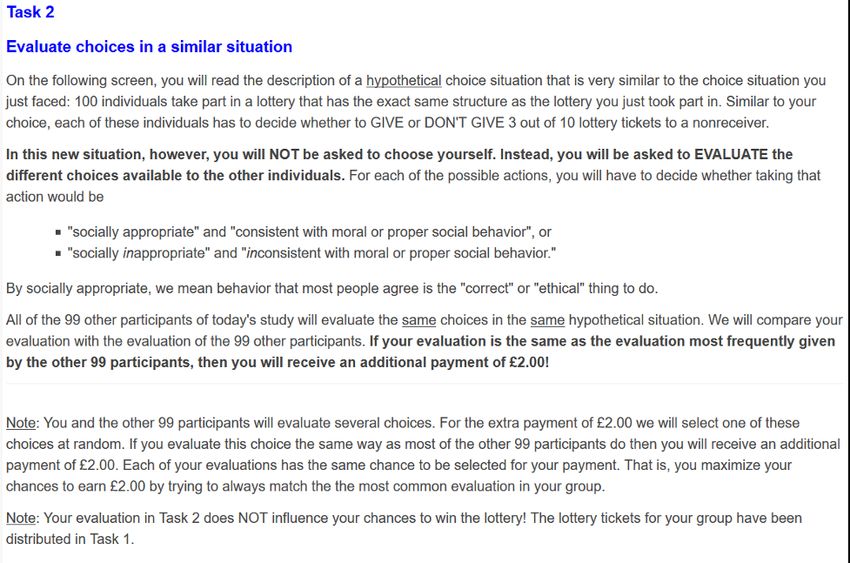
Social Norms. We elicit social norms using the coordination game method suggested by Krupka
and Weber (2013). Following their definition, a social norm is an empirically measurable collective
judgment that assigns to each action a degree of appropriateness or inappropriateness. For each of
the two possible actions, Give and Don’t Give, we ask subjects to evaluate the “social appropriate-
ness” of the action on a 6-point scale. The scale allows subjects to evaluate the action negatively
as “very socially inappropriate”, “socially inappropriate”, or “somewhat socially inappropriate”,
or positively as “somewhat socially appropriate”, “socially appropriate”, or “very socially appro-
priate”.5 Two measures are taken to ensure that the elicited rating reveals a social norm—that
is, a coordinated belief about what is wrong and what is right: First, we tell subjects that “by
socially appropriate, we mean behavior that most people agree is the ‘correct’ or ‘ethical’ thing to
5
We chose to omit a “neutral” category from the scale for the same reason as Krupka and Weber (2013), namely
that such a midpoint would represent an artificial focal point that is separate from the focal point arising from the
social norm, and thus, could interfere with the coordination incentive.
7do”. Second, subjects are incentivized to provide a rating that is identical with how most of the
other subjects evaluate the action. Specifically, we pay the subject a bonus payment of £2.00 if,
for a randomly selected rating, the subject’s rating matches the modal rating among the 99 other
subjects in her treatment.6
Elections: Rule:Give vs. Rule:Don’t. Our prime interest is in understanding how social
norms regarding Give and Don’t Give change in response to a behavioral rule being elected in
a (more or less) democratic manner. In our four election treatments, we therefore ask subjects
to evaluate actions Give and Don’t Give assuming that a “code of conduct” has been elected by
participants demanding either that “everyone should choose GIVE” (Rule:Give) or, contrarily, that
“everyone should choose DON’T GIVE” (Rule:Don’t). Subjects are informed that the final rule
is non-binding: “Once a rule has been set, each individual can decide privately and anonymously
whether he/she wants to follow the rule or not.” Treatments differ as to the exact manner in which
the rule is presumed to have been voted into power.
Treatments. There are five between-subjects treatments, each with 100 subjects (see Table 1).
In a benchmark treatment (T NoRule), we ask subjects to evaluate actions Give and Don’t Give
without a behavioral rule being in place. In this treatment, we neither talk about an election nor
about a rule, but simply let subject evaluate each action in a neutral setting. In our four election
treatments, subjects evaluate actions Give and Don’t Give conditional on Rule:Give or Rule:Don’t
being elected. In T StdMajority, the rule is assumed to have been elected with a “free and fair”
majority vote: Subjects are told that “all 100 individuals who take part in the lottery are asked to
vote for the rule they prefer to have implemented as the code of conduct. The rule that receives more
votes in total will be implemented as the code of conduct.” In T Pay4Vote, subjects are presented
with the same statement, to which we add, however, that “only the votes of individuals who pay
£0.20 will be counted”. In T MoneyOffer, we instead add the information that before the votes
are finally counted, “all individuals are offered an additional payment of £0.20 to vote for the rule
that is opposite to the one they originally intended to vote for”. Finally, in T ExcludePoor, we
add the information that “only the votes of individuals with a household income above £40,000 are
counted”. Participants are not informed about the share of voters who decide to pay the fee in
T Pay4Vote, about the share who accept the bonus payment in T MoneyOffer, or about the share
whose votes are excluded due to their household income in T ExcludePoor.
6
The definition and measurement of social norms suggested by Krupka and Weber (2013) differs from previous
binary conceptions of social norms by allowing for actions to vary in the degree to which they are regarded as socially
(in)appropriate. This is especially important for our purpose of studying changes in these perceptions dependent
on the election procedure. We speculate that focal points in the coordination game might be created via “cultural
values” such as prosociality, obedience to societal rules or the importance of democratic principles.
82.2 Procedures
The exact setup of the experiment and the wording of instructions can be found in appendix A.2.
Below, we summarize the procedures of the election treatments and of the benchmark treatment.
Procedure of Election Treatments. Each session consist of two tasks in the same fixed order.
In task 1, subjects are informed about the raffle and the fact that lottery tickets are distributed
unequally among the 100 participants of the treatment. Subjects are then asked to privately decide
whether—in the case of being awarded 10 tickets—they want to Give or Don’t Give 3 of their
tickets to a randomly selected nonreceiver. There is no mention of an election (nor of a rule)
at this stage of the experiment. Subjects’ decisions in this part of the experiment determine the
final allocation of lottery tickets and thus each participant’s chances of winning the £100 cash
prize. The winner of the raffle is drawn after the experiment. Subjects are not informed about
the choices of other participants in their treatment. In part 2 of the experiment, subjects are
confronted with a “hypothetical choice situation”, in which they are instructed to assume that a
“code of conduct” has been voted into power that either demands that “everyone should choose
GIVE” (Rule:Give) or, contrarily, that “everyone should choose DON’T GIVE” (Rule:Don’t). The
details of the voting procedure depend on the treatment (see above). We then ask them to rate
the social appropriateness of actions Give and Don’t Give conditional on Rule:Give or Rule:Don’t
being elected. Subjects can earn a bonus payment of £2.00 for matching the modal rating among
the 99 other participants in the treatment. This concludes the experiment.
Procedure of Benchmark Treatment (NoRule). This treatment consists of one task. At
the beginning of the session, subjects are informed about the raffle and the fact that lottery tickets
are distributed unequally among the 100 participants of the treatment. There is no decision to be
made: The initial allocation of lottery tickets by the computer determines each participant’s final
chances of winning the £100 cash prize. Subjects are then confronted with a “hypothetical choice
situation”, in which they are instructed to assume that each participant would be asked to privately
decide whether—in the case of being awarded 10 tickets—they want to Give or Don’t Give 3 of
their tickets to a randomly selected nonreceiver. There is no mention of an election (nor of a rule).
Instead of making the choice themselves, we ask them to rate the social appropriateness of actions
Give and Don’t Give. Subjects can earn a bonus payment of £2.00 for matching the modal rating
among the 99 other participants in the treatment. This concludes the experiment.
2.3 Implementation
The experiment was programmed using LimeSurvey and conducted on the online survey platform
Prolific using a randomly drawn sample of international participants. Prolific automatically pro-
vides us with basic (self-declared) demographic information about individual subjects. Additional
9to this basic information, which includes gender, age, and student status, we required that partici-
pants had filled in information about their nationality and country of residence. The four election
treatments were conducted over a period of two weeks in September 2018. On average, subjects
spent about 15 minutes to go through the experiment. In addition to the chance to win a cash
prize of £100 and a possible bonus payment of £2.00 in the social norm task, subjects received a
base payment of £1.60 for completing the experiment. The benchmark treatment (NoRule) was
conducted as a separate control treatment in November 2020. Since this experiment took only 10
minutes to complete, we reduced the base payment to £1.10. Data collection for each of the five
treatments was preset to stop when the number of subjects reached 100.
The entire sample of 500 participants has a mean age of 28.73 years (SD 9.59), 46.60 percent
of participants are female, and 38.87 percent are students. The largest share of participants have
a British nationality (38.08 percent), followed by 11.62 percent US Americans.7 The share of
“Non-Western” subjects is 21.84 percent.8
3 Results
3.1 Do elections shift norms? StdMajority vs. NoRule
To what extent can elections change social norms? We begin our analysis by comparing social
approval ratings after a “free and fair” majority election of Rule:Give or Rule:Don’t (T StdMajority)
with those elicited in the absence of an election (T NoRule).
Figure 1 displays the mean and median of social approval ratings across treatments T NoRule
and T StdMajority. The left-hand side of the figure shows how subjects rate action Give in the
absence of an election (T NoRule), when Rule:Give is elected by majority vote (T StdMajority)
and when Rule:Don’t is elected by majority vote (T StdMajority). The right-hand side of the figure
(grey bars) shows how subjects rate action Don’t Give under the same conditions. Following the
convention introduced by Krupka and Weber (2013), we have converted subjects’ responses into
numerical scores. A rating of “very socially inappropriate” received a score of -1, “socially inap-
propriate” a score of -2/3, “somewhat socially inappropriate” a score of -1/3, “somewhat socially
appropriate” a score of 1/3, “socially appropriate” a score of 2/3, and “very social appropriate” a
score of 1.
Recall our main prediction (Prediction 1): We predicted that majority-elected rules will shift
upward the social approval of actions that comply with the rule and will shift downward the
social approval of actions opposed to the rule. Specifically, we predicted that the election of
Rule:Give (Rule:Don’t) will shift upward (downward) the social approval of action Give and will
7
Not every participant had filled out all questions about demographics. Of 500 subjects, only 494 subjects filled
in information on their student status and only 499 filled provided their nationality.
8
Western = 1 if Nationality = United Kingdom (190 participants), United States (58), Austria (4), Australia (7),
Belgium(6), Canada (19), Denmark (4), Finland (5), Germany (11), Greece (12), Ireland (4), Italy (30), Netherlands
(8), Norway (1), New Zealand (1), Portugal (25), Sweden (4), Switzerland (1).
10Social approval of action Give Social approval of action Don‘t Give
StdMajority StdMajority
NoRule Rule:Give Rule:Don't NoRule Rule:Give Rule:Don't
is elected is elected is elected is elected
Very socially appropriate +1
Socially appropriate + 2/3
Somewhat socially appropriate + 1/3
Somewhat socially inappropriate – 1/3
Socially inappropriate – 2/3
Very socially inappropriate –1
Mean Median
Figure 1: Elicited social approval (mean and median) of actions Give (left panel) and Don’t Give (right
panel) in the absence of an election (T NoRule) and after a standard majority election of Rule:Give or
Rule:Don’t (T StdMajority).
shift downward (upward) the social approval of action Don’t Give. This is exactly what we find.
Consider first action Give (left-hand side of Figure 1): In the absence of an election (NoRule),
the action is rated as “socially appropriate” (mean: .72, median: .67). The election of Rule:Give
shifts the rating of action Give moderately upward toward “very socially appropriate” (mean: .74,
median: 1.00), whereas the election of Rule:Don’t leads to a strong downward shift to at or below
“somewhat socially appropriate” (mean: .17, median: .33). Although the mean and median ratings
of action Give remain positive throughout, close to 40% of subjects rate action Give negatively
under Rule:Don’t, which is an increase of 35 and 32 percentage points, respectively, compared to
NoRule and Rule:Give. We find a similar, flipped version of this pattern for action Don’t Give
(right-hand panel of Figure 1): In the absence of an election (NoRule), action Don’t Give is rated
as moderately socially inappropriate (mean: -.48, median: -.67). The election of Rule:Give pushes
this rating slightly further into the negative (mean: -.63, median: -.67), whereas the election of
Rule:Don’t produces a strong effect in the opposite direction. Under Rule:Don’t, mean and median
social approval of action Don’t Give are positive (mean: .23, median: .50), and even higher than
that of the opposite action Give. Two thirds (66%) of subjects rate action Don’t Give positively
under Rule:Don’t, an increase of 54 and 58 percentage points, respectively, compared to NoRule
and Rule:Give. This finding shows that a majority election can cause actions previously judged
socially inappropriate (Don’t Give) to become socially appropriate.
Detailed information on the distributions of approval ratings can be found in Table 2. Similar
shifts to those observed in the mean and median are also observed in the modal rating of actions
11T StdMajority T NoRule
Rule:Give Rule:Don’t NoRule
Rating Give Don’t Give Give Don’t Give Give Don’t Give
––– 5% 36% 8% 10% 0% 15%
–– 1% 41% 13% 11% 2% 41%
– 0% 15% 17% 13% 1% 32%
+ 5% 4% 24% 16% 11% 8%
++ 34% 1% 20% 32% 49% 4%
+++ 55% 3% 18% 18% 37% 0%
Mean .74 −.63 .17 .23 .72 −.48
Median 1.00 −.67 .33 .50 .67 −.67
Rule vs. NoRule −2.24∗∗ 3.68∗∗∗ 6.34∗∗∗ −7.00∗∗∗ (Rank-sum test (z))
Rule:Don’t vs. Rule:Give 6.41∗∗∗ −7.48∗∗∗ (Signed rank test (z))
∗ p < 0.1; ∗∗ p < 0.05; ∗∗∗ p < 0.01; all two-tailed.
Ratings are: “very socially inappropriate” (– – –), “socially inappropriate” (– –),“somewhat socially inappropriate”
(–), “somewhat socially appropriate” (+), “socially appropriate” (+ +), “very socially appropriate” (+ + +); modal
ratings are shaded. For means and medians, responses are converted into numerical scores −1 (– – –), −2/3 (– –),
−1/3 (–), +1/3 (+), +2/3 (+ +), +1 (+ + +).
Table 2: Elicited social approval (full distribution and non-parametric tests) of actions Give and Don’t Give
in the absence of an election (T NoRule) and and after a standard majority election of Rule:Give or
Rule:Don’t (T StdMajority).
Give and Don’t Give (shaded values in Table 2). Non-parametric rank-sum and signed rank tests
reported at the bottom of the table verify that social norms are significantly altered by the outcome
of the majority election: Compared to NoRule, Rule:Give significantly shifts upward the social
approval of action Give (z = −2.24, p = .025) and significantly shifts downward the social approval
of action Don’t Give (z = 3.68, p < .001). Analogously, Rule:Don’t significantly shifts downward
the social approval of action Give (z = 6.34, p < .001) and significantly shifts upward the social
approval of action Don’t Give (z = −7.00, p < .001).9 We summarize our findings below:
Result 1. Majority-elected rules (T StdMajority) shift social norms. The election of Rule:Give
makes action Give (Don’t Give) more (less) socially appropriate. The election of Rule:Don’t makes
action Don’t Give (Give) more (less) socially appropriate. Majority-elected rules can cause actions
previously judged socially inappropriate (Don’t Give) to become socially appropriate.
3.2 Do norm shifts require “free and fair” elections?
Having established that an inclusive and unbiased majority election has the power to shift social
norms, we now ask whether this power is sensitive to controversial practices that can make the
9
A notable additional observation (which we did not predict) is that social approval ratings become more dispersed
following the election of Rule:Don’t (see Table 2). That is, compared to the case of Rule:Give or NoRule, people
seem to agree less on which action constitutes “the right thing to do” if Rule:Don’t has been elected into power.
One possible interpretation of this finding is that elections can sometimes lead to a fragmentation rather than to a
consolidation of normative expectations. We will elaborate on this additional finding and the particular aspects of
our setting that may be driving it in section 4.
12election appear less democratic: Are norms affected less if voting is costly (T Pay4Vote), voters are
bribed (T MoneyOffer), or parts of the electorate are excluded from the ballot (T ExcludePoor)?
Figure 2 displays mean and median ratings of actions Give (left panel) and Don’t Give (right
panel) following the election of Rule:Give or Rule:Don’t, respectively, across the four election
procedures T StdMajority, T Pay4Vote, T MoneyOffer, and T ExcludePoor. In this figure, the
benchmark average rating for the case where there exists no rule (Give: .72, Don’t Give: −.48) is
represented by a dashed line. Complementing the figure, in Table 3 we present OLS estimates of
the effect of elected rules on mean approval ratings by treatment. Column (1) shows estimates for
the effect of rules on the mean social approval of action Give. Column (3) shows estimates for the
effect of rules on the mean social approval of action Don’t Give. Here, the benchmark rating of
NoRule serves as the constant. Columns (2) and (4) replicate and add individual-specific controls
for gender, age, student status and country of origin.10
Social approval of action Give Social approval of action Don‘t Give
Rule:Give Rule:Don‘t Rule:Give Rule:Don‘t
is elected is elected is elected is elected
Very socially appropriate +1
Socially appropriate + 2/3 **
***
Somewhat socially appropriate + 1/3
*
Somewhat socially inappropriate – 1/3
Socially inappropriate – 2/3
Very socially inappropriate –1
StdMajority Pay4Vote MoneyOffer ExcludePoor
Mean Median NoRule (Mean)
Figure 2: Elicited social approval (mean and median) of actions Give (left panel) and Don’t Give (right
panel) across different election procedures. Dashed line denotes mean social approval in the absence of
an election (T NoRule; Give: .72, Don’t Give: -.48). Stars denote significant results of Rank-sum tests
comparing the social approval after a standard majority election (T StdMajority) with the social approval
after a non-standard majority election (T Pay4Vote, T MoneyOffer, T ExcludePoor): ∗ p < 0.1; ∗∗ p < 0.05;
∗∗∗
p < 0.01.
Analyzing Figure 2 and Table 3, we first see that all four election procedures have the power to
change norms: Relative to the baseline rating of NoRule, the election of Rule:Give shifts the social
10
The entire distribution of ratings for each of the four treatments T StdMajority, T Pay4Vote, T MoneyOffer,
and T ExcludePoor, including non-parametric Rank-sum test vs. NoRule and StdMajority can be found in Table A.1
in the Appendix.
13Dep. Var. Mean social approval
Give Don’t Give
(1) (2) (3) (4)
Election of Rule:Give
StdMajority .02 .03 -.16∗∗ -.12∗
(.056) (.059) (.061) (.064)
Pay4Vote .09∗ .09∗ -.16∗∗ -.12∗
(.045) (.051) (.064) (.067)
MoneyOffer .02 .02 -.06 -.02
(.053) (.056) (.066) (.067)
ExcludePoor .04 .04 -.09 -.04
(.049) (.051) (.068) (.069)
Election of Rule:Don’t
StdMajority -.55∗∗∗ -.54∗∗∗ .71∗∗∗ .75∗∗∗
(.073) (.075) (.079) (.082)
Pay4Vote -.59∗∗∗ -.59∗∗∗ .70∗∗∗ .74∗∗∗
(.071) (.076) (.076) (.078)
MoneyOffer -.44∗∗∗ -.44∗∗∗ .47∗∗∗ .51∗∗∗
(.066) (.071) (.075) (.077)
ExcludePoor -.39∗∗∗ -.39∗∗∗ .33∗∗∗ .38∗∗∗
(.070) (.073) (.076) (.075)
Constant .72 .63 -.48 -.30
(.031) (.080) (.041) (.087)
Mean rating NoRule .72 -.48
Controls No Yes No Yes
Observations 900 900 900 900
(Subjects) (500) (500) (500) (500)
R2 .219 .224 .270 .279
Robust standard errors (clustered at subject level) in parentheses:
∗ p < 0.1; ∗∗ p < 0.05; ∗∗∗ p < 0.01.
Controls in columns (2) and (4) are: female (1/0), age (continuous),
student (1/0), and Western (1/0).
Table 3: Marginal effects of elected rules (Rule:Give and Rule:Don’t) on mean social approval of actions
Give and Don’t Give across different election procedures: OLS Regressions. Mean ratings in the absence of
an election (T NoRule; Give: .72, Don’t Give: -.48) serve as the benchmark.
approval of action Give (Don’t Give) slightly upward (slightly downward) relative no NoRule, while
the election of Rule:Don’t shifts ratings strongly into the opposite direction.11 Qualitatively, this
is true for all four treatments, i.e, regardless of whether voting is costly (T Pay4Vote), voters are
bribed (T MoneyOffer), or parts of the electorate are excluded from the ballot (T ExcludePoor).
As Table 3 shows, the effect of Rule:Don’t on mean approval ratings is always highly significant,
while the effect of Rule:Give is only sometimes weakly so. On average, the election of Rule:Give
shifts the mean approval rating of action Give upward by .05 points and the mean approval rating of
action Don’t Give downward by −.12 points, which is about one-tenth and one-third, respectively,
of a discrete step in the approval rating (where a discrete step means, e.g., going from “weakly
11
Note from Figure 2 that the median is typically (but not always) shifted by a larger amount than the mean.
14socially appropriate” to “socially appropriate”). In comparison, the election of Rule:Don’t leads to
average shifts of −.49 points and .55 points, respectively, which converts to between one and two
discrete steps on the rating scale.
A second observation we make is that not all of the elections shift norms to the same extent
as the inclusive and unbiased majority election T StdMajority. While T Pay4Vote has virtually
the same power as T StdMajority, T MoneyOffer and T ExludePoor perform significantly worse in
shifting social norms. Throughout Table 3, T MoneyOffer and T ExludePoor show systematically
smaller coefficients than T Majority. In Figure 2, stars denote statistically significant differences to
T StdMajority according to non-parametric Rank-sum tests (for detailed test results, see Table A.1
in the Appendix). We see that shifts of social approval ratings are significantly smaller following
the election of Rule:Don’t when this rule comes into force with an election in which voters received
bribes (T MoneyOffer) or in which voters with a low household income were excluded from the
ballot (T ExludePoor). The results are particularly pronounced and meaningful for the social
approval ratings of action Don’t Give (right panel in Figure 2): While in T StdMajority and in
T Pay4Vote, the election of Rule:Don’t pushes the mean and median social approval rating of
action Don’t Give into the positive, both mean and median rating remain negative following the
election of Rule:Don’t in T MoneyOffer and T ExcludePoor. Through these two treatments, then,
one distinct aspect of the power of a free and fair election is unveiled: Elections that are perceived
to be manipulated, while still powerful, can no longer cause an action previously judged socially
inappropriate to become socially appropriate. We conclude:
Result 2. Elected rules can shift social norms, but bribing voters (T MoneyOffer) or excluding parts
of the electorate (T ExcludePoor) weaken this ability. While T Pay4Vote has virtually the same
power as T StdMajority, elected rules shift social approval ratings significantly less in T MoneyOffer
and T ExludePoor.
3.3 Do election-induced norm shifts predict behavior change?
Literature on social norms typically argues that people have an intrinsic preference to conform to
what is collectively perceived as socially appropriate and, in a variety of social contexts, refrain
from maximizing material profits in order to comply with social norms (Elster, 1989; Bicchieri,
2006; López-Pérez, 2008; Kimbrough and Vostroknutov, 2016; Krupka et al., 2017; Gaechter et al.,
2017). If elections can change norms, can these changes predict how people adapt their behavior to
the election outcome? To answer this question, we draw on data from another experiment in which
we elicited actual choices (Give or Don’t Give) following the election instead of social approval
ratings. The experiment, which was conducted in spring 2017 with a separate group of subjects on
the same online platform as our rating experiment, forms the core of another paper (Apffelstaedt
and Freundt, 2020). In that paper, we analyze the effects of different voting procedures on people’s
willingness to comply with elected rules. For a detailed description of the experiment and its results,
see Apffelstaedt and Freundt (2020). In the following, we refer to this experiment as the “behavior
15experiment”.12
Figure 3 presents data from the actions taken in the behavior experiment: Black bars denote the
share of subjects choosing action Give across treatments and in different choice situations (NoRule,
Rule:Give, Rule:Don’t). In the absence of an election (NoRule), 61.25% of subjects (n=400) choose
to Give. The election of Rule:Give increases the share of Givers on average by 15.5 percentage points
(t = 25.11, p < 0.001) to 76.75%, while the election of Rule:Don’t lowers that share on average by
30 percentage points (t = 36.29, p < 0.001) to 31.25%. Thus, behavior responds significantly to
rules that have been elected in a (more or less) democratic manner.
Share of subjects choosing Give: data vs. predicted
Choice Experiment Predicted (Table 3, column 1)
100%
75%
50%
25%
0%
StdMajority
StdMajority
No Rule
MoneyOffer
ExcludePoor
MoneyOffer
ExcludePoor
Pay4Vote
Pay4Vote
Rule:Give Rule:Don't
Figure 3: Share of subjects choosing action Give: data vs. predicted. Data from behavior experiment
(Apffelstaedt and Freundt, 2020). Predictions using norms elicited through rating experiment (this paper),
utility parameters according to specification Table 4, column (1).
How much of the change in behavior can be directly predicted by changes in social norms? Note
that we use a setup without strategic incentives to follow a social norm. Rather, we assume that
behavioral changes are driven by changes in the moral appeal associated with each action. Let us
denote by N (Give) ∈ [−1, 1] the elicited mean social approval of action Give in a given situation
and by N (Don’t Give) ∈ [−1, 1] the elicited mean social approval of action Don’t Give in the same
12
The design of the behavior experiment is very close the rating experiment conducted for this paper. In fact,
the decision situation subjects phase in the behavior experiment corresponds exactly to the hypothetical situation
described to subjects in the rating experiment. Subjects first go through a choice phase (the same as task 1 in
the rating experiment), in which they are asked to Give or Don’t Give in the absence of a rule. Then, in part 2,
subjects are first asked to vote for Rule:Give or Rule:Don’t. After voting, each subject is then asked to decide between
action Give or Don’t Give conditional on Rule:Give or Rule:Don’t being elected. Subjects know that their decision
whether or not to give determines the number of lottery tickets they hold at the end of the experiment and thus their
chances to win £100. Treatments are exactly the same as in our rating experiment (T StdMajority, T Pay4Vote,
T MoneyOffer, T ExcludePoor).
16Predicted probability of choosing action Give
Predicted (Logit: Table 3, column 1) Data
1.0
0.8
0.6
P(Give)
0.4
0.2
0.0
-2 -1 0 1 2
N(Give) – N(Don't Give)
Figure 4: Predicted probability of choosing action Give as a function of N (Give) − N (Don’t Give). Pre-
dictions using norms elicited through rating experiment (this paper) and actions from behavior experiment
(Apffelstaedt and Freundt, 2020). Conditional Logit prediction with utility parameters according to specifi-
cation Table 4, column (1).
situation. We seek to understand how much the propensity to choose action Give over Don’t Give
in the behavior experiment depends on the difference in social approval, N (Give) − N (Don’t Give),
elicited in the rating experiment. For this, assume that the utility from taking action Give takes
the form
UGive = const + γ · [N (Give) − N (Don’t Give)], (1)
and normalize the utility from taking action Don’t Give to zero (i.e., UDon’t Give = 0).13 In this
simple utility framework, γ measures the weight that individuals attach to norms: A positive
weight γ implies a utility gain from following that action (Give or Don’t Give) which yields a
higher social approval. The constant (const) captures the average utility individuals derive from
choosing action Give over Don’t Give that is independent of norms. Following the procedure in
Krupka and Weber (2013), we combine the data from the behavior experiment with the data from
the rating experiment to estimate the parameters of the utility function using conditional Logit.
The results of this estimation are found in Table 4: In column (1), we estimate γ by fitting the
utility function to the share of Givers in the behavior experiment using as only explanatory variable
the elicited difference in social approval, N (Give) − N (Don’t Give). We find a large, positive and
highly significant estimate, γ = 1.347 (p < .001). This estimate tells us that, on average, the
13
Because subjects can only choose between two actions, Give and Don’t Give, only differences in utility matter
for decisions. The normalization of UDon’t Give = 0 is thus without loss of generality.
17relative utility from taking action Give strongly increases with the difference in social approval
between actions Give and Don’t Give. Vice versa, if that difference in ratings becomes smaller or
even turns negative as, for instance, when Rule:Don’t is elected, the propensity to choose action
Don’t Give will become larger. Columns (2)-(4) show that the estimate of γ is robust to including
demographic controls and does not vary significantly if we estimate it separately by treatment
(column 3).
Dep. Var. Utility according to Eq. (1)
(1) (2) (3) (4)
Appropriateness rating (γ) 1.347 ∗∗∗
1.371∗∗∗
1.403∗∗∗
1.444∗∗∗
(.103) (.106) (.143) (.148)
Appropriateness rating X
Pay4Vote -.194 -.233
(.192) (.198)
MoneyOffer .248 .203
(.216) (.221)
ExcludePoor -.154 -.140
(.199) (.199)
Constant (const) -.944 -1.656 -.970 -1.671
(.125) (.393) (.130) (.393)
Controls No Yes No Yes
Observations 1200 1182 1200 1182
(Subjects) (400) (394) (400) (394)
Log-likelihood -746.8 -725.9 -742.7 -722.4
Robust standard errors (clustered at subject level) in parentheses.
∗ p < 0.1; ∗∗ p < 0.05; ∗∗∗ p < 0.01.
Controls in columns (2) and (4) are: female (1/0), age (continuous), student (1/0),
and Western (1/0).
Table 4: Conditional logit estimation of choice determinants (utility according to Eq. (1)). Choice data
from behavior experiment (Apffelstaedt and Freundt, 2020). Includes mean appropriateness ratings N (Give)
and N (Don’t Give) from rating experiment (this paper) as explanatory variable.
To get a better sense of the estimated relationship between norms and behavior, Figure 4 plots
the predicted probability of choosing action Give according to the model specification in Table 4,
column (1): When there is no difference between the social approval of actions Give and Don’t
Give, N (Give) − N (Don’t Give) = 0, P (Give) is predicted at 28%. That is, in the absence of clear
guidance by a social norm, our model predicts that the majority of subjects will choose selfishly.
From this position, increasing the social approval of action Give (or, equivalently, decreasing the
social approval of action Don’t Give) will lead on average to a 10 percentage point increase in the
probability of taking action Give for every step on the rating scale (e.g., going from “weakly socially
appropriate” to “socially appropriate”). This is a strong relationship: In the case of a standard
majority election of Rule:Give, for instance, for which we elicit a difference in social approval of
N (Give) − N (Don’t Give) = 1.37, the probability of action Give is predicted at 71%—an increase
of more than 40 percentage points relative to the case without normative guidance.
Finally, in Figure 3, we plot—next to the original data from the choice experiment—the share
18You can also read