St Mary's Presentation to Parents - 6th February 2020 - St Mary's Primary ...
←
→
Page content transcription
If your browser does not render page correctly, please read the page content below
St Mary’s Presentation to
         Parents
     6 th   February 2020
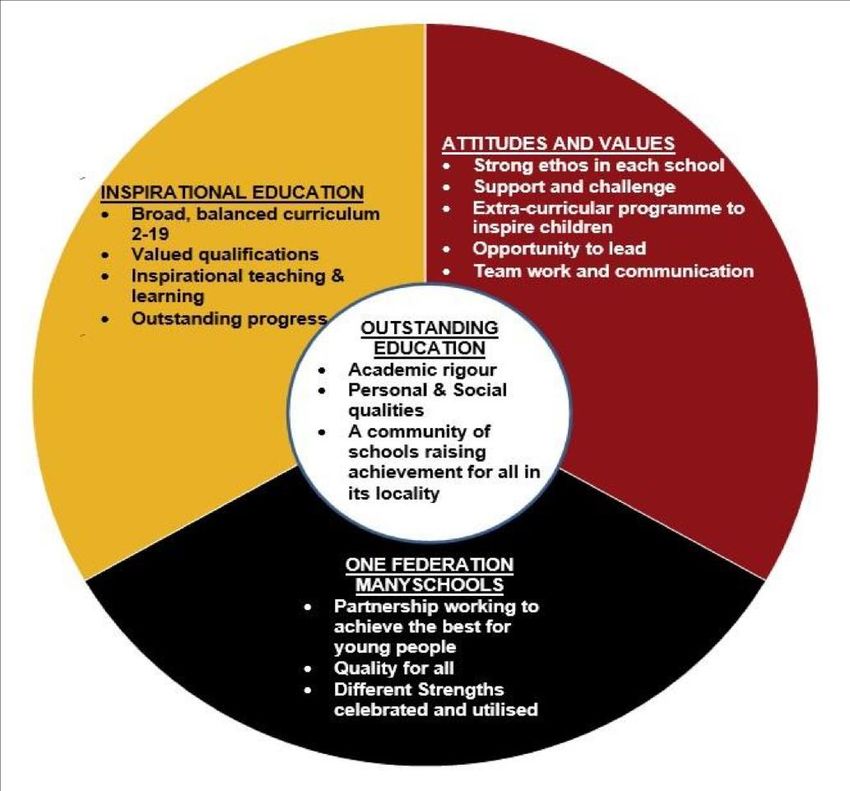
1) Vision and values
2) Current Trust Schools – who are we?
3) Finance and governance
4) Standards
5) Impact of the Trust so far – standards and provision

                                                          2
Vision for the Trust Schools
• An underlying entitlement that all children should be able to attend a
  ‘good’ or better school, with school improvement as its principal focus.
                                 No one school the same, but all with the dual aims of improving
                                 academic outcomes and supporting the development of
                                 personal and social qualities.

                                 A curriculum in our schools that challenges children and one that
                                 emphasises extra-curricular involvement to broaden horizons.

                                 Learning that is of the highest quality, stimulating and prepares
                                 children for life in modern Britain and builds resilience.

                                 Where the Christian vision is important to all our schools

                                 Where strong and structured collaboration is the driving force
                                 behind all that we do and keeps us all safe and secure .            3
Current Trust Schools:
Current Ofsted rating 1-4
School Name Location Sector N.o.R. %PP Date of joining MAT
(with date)
Norton Hill Secondary School MSN Sec 11-18 1734 15% 2009 2 (1 for behaviour/safety (Jul 17)
Somervale Secondary School MSN Sec 11-18 559 28% 2009 2
St Dunstan’s Secondary School Glastonbury Sec 11-16 330 28% 2016 2
Beechen Cliff Secondary School Bath Sec 11-18 1350 10% 2019 4 (SW)
Writhlington Secondary School Radstock Sec 11-18 1220 21% 2019 3
Mendip Studio School Radstock 14-19 165 18% 2019 2
Critchill Special School Frome 2-19 64 15% 2019 2
High Littleton (C of E) HL Pri 175 12% 2014 1
Clutton (C of E) Clutton Pri 135 13% 2014 2
Trinity Church School (C of E) Radstock Pri /Nur 200 30% 2015 2
Dundry Primary (C of E) Dundry Pri 90 10% 2015 3
Longvernal Primary MSN Pri/nur 155 29% 2016 2 (1 for l and M)
Welton Primary MSN Pri 200 26% 2016 2
Farrington Gurney Primary (C of E) FG Pri 90 5% 2017 2
Midsomer Norton Primary MSN Pri/nur 360 22% 2017 2
Norton Hill Primary Free School (2019) MSN Pri 630 N/A 2015 N/A
Hemington Primary Hemington Pri 34 35% 2018 2
Westfield Primary MSN Pri 480 20% 2018 2
St John’s Primary MSN Pri 480 15% 2018 2
Shoscombe Primary (C of E) Shoscombe Pri 90 20% 2018 2
St Julian’s Primary (C of E) Wellow Pri 102 15% 2018 2
Leigh-on-Mendip First School Leigh On Mendip Infant 55 12% 2018 1
Peasedown Primary Peasedown pri 575 20% 2019 4Governance and Leadership
• 5 Members (Diocesan representation)
• 11 Trustees – with defined roles and certain schools they specialise in (Diocesan representation)
• LGB’s with 9-12 governors – with defined role
• No committees
• Chairs group
• Head’s group
• Senior Central Leadership Team
• Joint leadership teams
• Joint middle leader teams
• DHT group
• Subject groups in place to share best practice
• A number of MAT roles across subjects Maths, English, etc.
• School improvement team that is deployed across schools in the Trust
• 3 key external experts that validate information flows between leaders, governors and trustees
7St Mark’s 2019 8
Performance of schools – secondary schools
(Green is significant plus/above average)
                                   2014            2015              2016              2017              2018          2019
 Overall Progress all          1007.5        1009             0.55             0.3               0.25           0.33
 secondary schs
 DA                            983.3         963              0.31             0.2               0.1            0.1

 PA VA                        LPA 1002.2     LPA 981.8        LPA 1.12/ 0.86   LPA 0.9           LPA 0.9        LPA 0.8
                              MPA 1011.7     MPA 1012.5       MPA 0.55/0.11    MPA 0.4           MPA 0.6        MPA 0.3
                              HPA 1003.0     HPA 1010.3       HPA 0.31/-0.47   HPA 0.15          HPA 0.1        HPA 0.2

 SEN                          EHC 1049.3     EHC - - -        EHC - - -        ENC 0             EHC 0.1        EHC 0.1
                              SUP 943.1      SUP 954.7        SUP 0.78         SUP 0.35          SUP 0.3        SUP 0.2

 Boys/girls                   991/1008.9     1004.8/1013.8    0.47/0.66                          0.2/0.4        0.1/0.4

 En                           1000/100.2     1000.5/997.1     0.14 -0.12       0.2 (NHS +0.3)    +0.27          0.1

 Ma                           1000.2/998.6   1001.1/997.7     0.37 /0.25       +0.2 (NHS +0.4)   +0.21          0.1

 Sc                           1001.4/999.5   1002.1/ 1001.2   0.30/ 0.15       +0.25             +0.28          +0.4

                                                                                                                              9
Performance of schools – primary schools:
(Green on attainment side represents better than national or strong improvement. Green on progress represents significantly above national or
significant improvement. Yellow is close to national, red is significantly below, white is ‘in-line’ with national.)
School GLD% Y1 Y2 Ks1 R KS 1 W KS1 M KS 2 R KS 2 W KS 2 M KS 2 SP School Nat R, W, M, Current Pr R W M
Nat 71% Phonics Phonics 76% 68% 75% Nat 75% Nat 78% Nat 76% Nat 78% KS2 average 64% OFSTED
Nat 81% Catch-up (91) RWM
HL 76% 87% 50% 78% 73% 82% 95% 52% 91%, 30% 95%, 45% 86 up from 80 64 1 3.7 2.4 5.6
(76%) (81%) (92%, 23) (70% (81% 12)
12) (100%, 50) (80%, 20%) (95%,40%)
CL 77% 88% 100% 84%, 32 84% 75% 67%, 38% 90% 19 67% 19% 71% 24 52% down from 64 2 0 1.5 -0.9
(61%) (78%) (46%) 16 26 93% 60% (-2.6) (-1.8) (-2.2)
(54%) (62%) (66%,27%) (79%,33%) (40)
(71%, 20%)
Tr 65% 87% 83% 81% 74% 78% 77% 44% 82% 23% 73%, 27% 73% up from 64% 64 2 0.3 0.8 0.3
(68%) (81%) (33%) (50%) (50%) (50%) (-5.3) (-2.1) (-4.1)
(68%,14%) (82%,18) (68%, 25)
Du 64% 73% 0% 62% 62% 62% 57%, 29% 71%, 14% 57% 0% 50% down from 64 3** -4.5 -1.3 -4.2
(73%) 73% (67%) (67%) (67%) (67%) 82% (1.1) (-1.5) (-0.8)
(82%) (82%) 82%
Lo 76% 80% 100% 76% 76% 88 83% 83% 89% 83% up from 64 2 -0.3 0.5 2.4
(72%) (94%) (76%,26) (76%, 26) (79%, 16) 70%
(81%) (80%) (81%)
We 68% 93% 0% 72% 68% 72% 67% 68% 54% 50% down from 64 2 -1.3 -1.1 -1.3
(74%) (90%) (69%) (54%) (73%) 64% (-1.1) (-2.4) (-1.7)
(75%,18%) (75%, 7%) (71%,25%)
FG 75% 92% 66% 86% 64% 86% 100% 16% 100% 33% 100% 66% 100% up from 64 2 0.7 2.3 2.9
(77%) (81%) 14% 7% 7% 64% (-0.6) (-0.8) (-0.3)
(80%) (80%) (80%) (64%,43) (86%,14%) (79% 21%)
MSP 76% 89% 95% 64% 32% 64%, 19% 70% 27% 76%, 22% 78% 85% 66% up from 64 2 1.5 1.9 (1.3) 1.9
(75%) (70%) (100%) (72%) 64% (81%) 50% (0.5) (0.7)
(65%) (72%) (74%)
St John 78% 84% 84%, 37% 85%, 20% 83% 31% 92% 79% 75% 69% 64 2
L-on-M 73% 100% 83% 75% 83% N/A N/A N/A N/A 64 1
WF 71.6% 75% 73% 69% 75% 84% 81% 90% 74% 64 2 +0.8 +1.5 +1.5
Hem 0 100% 100% 67% 67% 67% 60%* 0%* 40%* 20%* 0% 64 2
St Jul 80% 88% 100% 88% 81% 81% 81% 88% 87% 81% 64 1
Shos 79% 85% 40% 49% 42% 63% 60% 87% 40% 33% 64 2
Peas 74% 86% 74% 72% 61% 71% 68% 78% 57% 49% 64% 2
10Successes and impact of the Trust:
These are wide-ranging and a full overview is available in the attached documents;
• Outcomes at secondary are high over 3 year trend for all groups and at GCSE and KS5. St Dunstan’s has
improved significantly (now a ‘good’) and SVS remains good since joining the Trust.
• Outcomes in primary schools have improved over time. Trinity, Welton, Clutton, Longvernal have all
improved significantly.
• Provision for children has improved including a better curriculum, improved facilities, improved support
for children, e.g those with SEN.
• School improvement is shared across the Trust schools, is more efficient and impact driven.
• Staff training is done across the Trust and addresses common issues. Teachmeets, moderation,
governor, TAs, clerking, finance, etc.
• Governance is improved at individual school level which is supporting leaders in schools.
• Budgets will be balanced in 90% of the schools this year with £2 million in reserve.
• OFSTED speak highly of the work done by the Trust – see recent inspections visits from Norton Hill,
Somervale, Clutton, Trinity, St Dunstan’s, Longvernal, Dundry.
11What OFSTED says: • ‘The Headteacher, trust and senior leaders have transformed the school. It now provides a good quality of education and pupils are safe.’ – St Dunstan's OFSTED July 2018 • ‘Parents and carers who responded to the online survey and discussions are happy with the school. They typically comment, ‘the academy trust has made many improvements,’ and, ‘staff are dedicated, hardworking and incredibly supportive’ – Dundry OFSTED January 2019 • 'The trust has provided high-quality support for teaching staff to improve their practice. They have added leadership capacity and supported school leaders to improve the quality of education. Together, these have been principle factors in transforming the school.’ – St Dunstan's OFSTED July 2018 • ‘The support provided by the multi-academy trust, The Midsomer Norton Schools Partnership, has been crucial to the rapid improvement at Trinity. Initially, this involved the recruitment of staff and governors. Subsequently, the trust has supplied a wealth of training and coaching opportunities to develop staff and governors.’ – Trinity OFSTED May 2018 • ‘The Midsomer Norton Schools Partnership Trust is highly effective at supporting leaders at every level to bring about improvements. The impact is evident in rising standards and rapidly improving teaching.’ – Clutton OFSTED November 2018 • ‘Leaders in school and from the multi-academy trust, governors and trustees are highly ambitious for the school, each pupil and the community. They have not shied away from making tough decisions to ensure that pupils benefit from a good quality of education.’ – St Dunstan’s OFSTED July 2018 • ‘The school’s local governing board know their school well. There are clear lines of accountability between them and the directors of the multi-academy trust. Governors and trust officials provide effective challenge to school leaders about the standards pupils reach. Joining the trust has successfully enabled leaders and governors to widen the provision they offer to pupils’ – Longvernal OFSTED May 2019 12
Easy to forget what we have achieved?
• Improved outcomes across all schools. Trinity 34% increase in RWM at KS2, Welton 30% increase in RWM at KS2, Longvernal 13% increase in
  RWM at KS2, Norton Hill top 5% nationally 2 years running, Somervale top 10% nationally, St Dunstan’s at national average for attainment and
  progress with good Ofsted judgement.
• High Littleton and Dundry remain at 80% + for RWM at KS 2, Farrington Gurney results in top 10% at KS1.
• Strong progress from Pupil Premium children – value-added across the primary schools. Significant value-added at Norton Hill and Somervale
  over last 3 year trend. SEN outcomes strong at Norton Hill.
• Budgets balanced across all schools.
• Sharing of teacher expertise – helping to spread best practice and solve tricky staffing issues.
• Curriculum sharing – including maths, literacy, science expertise across primaries.
• Cluster groups established and focused on school improvement across schools in maths, literacy, for the Deputy Headteachers, the Heads, etc.
• Training across all schools – in EYFS, maths, literacy, phonics, safeguarding, safety, science, data tracking.
• Regular Joint moderation to raise standards and share best practice.
• New Norton Hill Free School - £10 million build for the community.
• New nursery for Longvernal School and Midsomer Norton Primary.
• Decorating and £40,000 of refurbishment at Clutton.
• New classroom and art area at High Littleton.
• Standardisation of procedures – school improvement planning, school self-evaluation procedures, headteacher reports to governors, data
  tracking, expectations around progress of children, etc.                                                                   Continued…………
                                                                                                                                                 13
• Decoration and office built at Farrington Gurney.
• £850,000 spent at St Dunstan’s to improve all areas of the school.
• £600,000 spent at Somervale for new Astroturf.
• £2.3 million block at Norton Hill School.
• New outdoor areas for EYFS at Trinity, Dundry and Clutton.
• New kitchen at Dundry.
• New security fencing in all schools.
• Bespoke governor training.
• Art, PE, Languages, Technology, PE and Music specialist teaching in primary schools.
• New minibus for primaries.
• Shared back-office functions – personnel, finance, CP training, etc.
• Mobile site team solving small and larger problems in schools with minimal caretaking support.
• Trust policies in place for all schools to use.
• Strong governance model.
• Trust accredited Leadership course for staff run through the National College.
• Shared expenditure and bidding for refurbishment.
• Shared support with difficult issues – behaviour support, help with improving outcomes of challenging children, personnel issues, etc.
• Opportunity for staff – including promotion, new experiences in differ school settings.
St Mark’s 2020 14MAT school improvement strategy:
(Please see attached document)
Essentially this improvement strategy is based on the following:
1) Thorough and rapid assessment of school need.
2) A core programme of support for all schools.
3) A further programme of support which can draw on the school or
Trust-wide resources depending on need.
4) Thorough monitoring of impact during the improvement process.
5) Evaluation of the improvement work undertaken based on pupil
outcomes/standards.
St Mark’s 2020 15School improvement team 2019 onwards
St Mark’s 2020 16Back office function new structure from 2019
St Mark’s 2020 17How will St Mary’s benefit from joining the MNSP?
• High quality and successful school improvement to raise standards.
• The opportunity to collaborate properly with other schools and have impact as a result
of partnership.
• Opportunity for staff – promotion, experience, recognised training.
• Challenge from other successful schools which raises your expectations and outcomes.
• Opportunity for children – working cross-school, SEN projects, able pupils, joint trips,
etc.
• The Trust as an insurance policy – keeping the school consistently ‘good’ or better even
if you have disruption.
• The Trust supports colleagues with problem solving – staff changes
• Access to MAT capital funding – currently 1 million per year and rising.
• Safety backstop if things go wrong – CEO, heads group, chairs group, trustees.
18Other information – Staff and the Central Team
• 1500 staff in total, 650 teachers.
• Central team covers:
1) Site team – led by the Estates Manager (21 staff).
2) Catering – co-ordinating school meals with a Catering Manager (110 staff).
3) Finance – CFO and 8 other finance personnel across schools (3 qualified
accountants).
4) Personnel/HR – lead on contracts, safeguarding, HR etc (7 staff).
5) Compliance lead and Trust PA – oversees policy, academy articles,
governance etc.
6) School improvement team x5 staff at secondary x2 at primary (plus others
as needed).
7) IT team – 15 staff led by a strategic ICT Trust lead.
19Further financial detail
• Income: approx. £54 million.
• Capital grant 750K approx. Rising to 1 million annually.
• Reserves 3.7 million.
• ESFA tells us what to give each school – budget is defined by
the school.
• You keep your reserves for you school.
21QUESTIONS?
23You can also read