STATUS OF ARIZONA'S YOUNG CHILDREN: A DATA SUMMARY - First ...

Page created by Ken Davidson
 
CONTINUE READING
STATUS OF ARIZONA'S YOUNG CHILDREN: A DATA SUMMARY - First ...
STATUS OF ARIZONA'S YOUNG CHILDREN:
A DATA SUMMARY
STATUS OF ARIZONA'S YOUNG CHILDREN: A DATA SUMMARY - First ...
STATUS OF ARIZONA'S YOUNG CHILDREN:
A DATA SUMMARY

CONTENTS
DEMOGRAPHICS AND FAMILY CHARACTERISTICS..................................................................................... 4

EDUCATED YOUNG STUDENTS ................................................................................................................ 12

HEALTHY KIDS........................................................................................................................................ 20
STATUS OF ARIZONA'S YOUNG CHILDREN: A DATA SUMMARY - First ...
DEMOGRAPHICS AND FAMILY CHARACTERISTICS

Family stability can affect the resources a child has that either support or restrict their optimal development.
Poverty and its effects – including unreliable access to food, housing and child care – can impact a child’s
physical and emotional development.

The number of young children in Arizona                    The percentage of households with young
grew much faster between 2000 and 2010                     children in Arizona is about the same as
than in the nation as a whole.                             in the U.S.
                                      1                                      2

     +19%            +5%                                        16%                  15%

                                          Arizona’s young children are more likely than their peers nationally
                                          to be born into challenging situations like poverty and being raised
                                          by single parents, teenage parents or grandparents. They also are
                                          less likely to receive the supports that can help mitigate the effects of
                                          poverty on their overall well-being. Compared to the U.S. as a whole:

                                          MORE YOUNG CHILDREN IN AZ LIVE
                                             in poverty                                    28%           24%
                                                          3

                                             w/grandparents                                14%           12%
                                                                   4

                                             w/a single parent                             37%           35%
                                                                         5

                                             w/a teen parent
                                                                   6,7

                                                                                           9%             7%

                                          Fewer Arizona children
                                                                                           1.3%          3.6%
                                          (ages 0-17) receive TANF.
                                                                                 8

First Things First helps strengthen families by giving parents options when it comes to fulfilling their role
as their child’s first teachers, including kits for families of newborns with resources to support their child’s
health and learning, community-based parenting education, voluntary home-based coaching for families
with multiple challenges, support for families of children with special needs, and referrals to existing
programs that meet the family’s specific challenges.

                                                                                                                   4
STATUS OF ARIZONA'S YOUNG CHILDREN: A DATA SUMMARY - First ...
THE POPULATION OF ARIZONA’S YOUNG CHILDREN

                                                                      Between 2010 and 2020 the population of children
                                                                      ages 0-5 is projected to grow.

                                                                      Young children ages 0-5 represent 30% of
                                                                      Arizona’s total population, similar to the
                                                                      proportion of young children ages 0-5 within the
                                                                      population of the United States (29%).

  Proportion of children ages 0-5 years living across Arizona

      Maricopa County                                                                                62.1%
           Pima County                        13.7%
           Pinal County               6.6%
 AZ Tribal Reservations          3.8%
           Yuma County          3.3%
        Mohave County           2.4%
        Yavapai County         2.3%
       Coconino County         2.0%
         Navajo County         1.9%
        Cochise County         1.9%
         Apache County         1.3%
     Santa Cruz County       0.8%
        Graham County        0.7%
            Gila County      0.7%
          La Paz County      0.2%
       Greenlee County       0.1%

                        0.0%          10.0%    20.0%      30.0%         40.0%      50.0%     60.0%      70.0%

Source: U.S. Census Bureau (2010). 2010 Decennial Census, Table P14
Retrieved from: http://factfinder.census.gov                                                                             5
STATUS OF ARIZONA'S YOUNG CHILDREN: A DATA SUMMARY - First ...
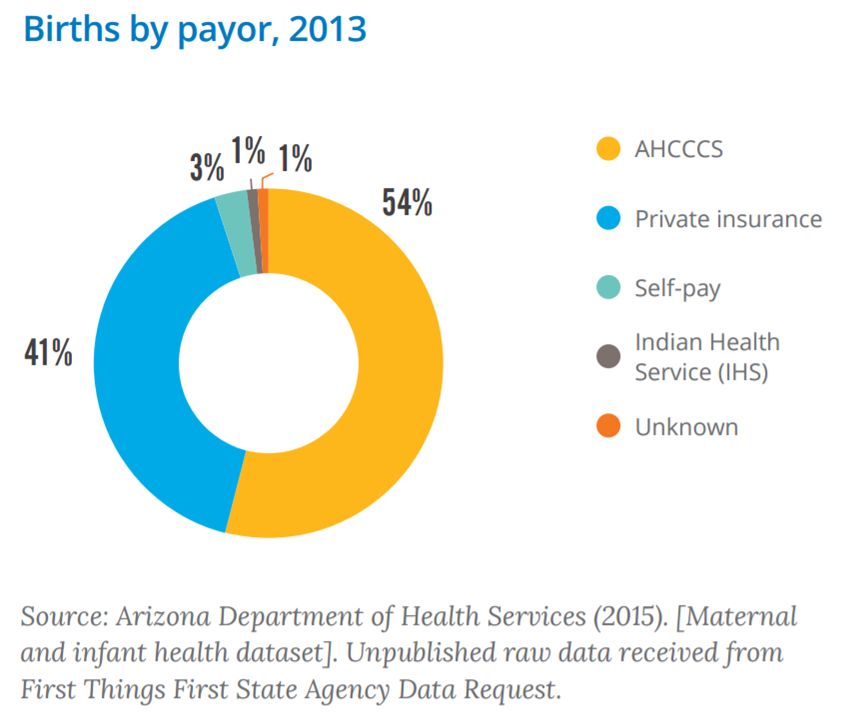
RACE AND ETHNIC COMPOSITION

The ethnic makeup of Arizona’s youngest children differs from that of the nation as a whole. Almost half of
children between birth and 5 years old in Arizona are Hispanic or Latino, compared to only a quarter across
the country. Young American Indian children make up 5% of young children in the state, which is
substantially greater than the 1% across the U.S. Within Arizona counties, there also exists a large variation
of race and ethnic compositions, for example a very high population of Hispanic or Latino children living in
the border counties of Santa Cruz (94%) and Yuma (76%) and a very high population of American Indian
children living within the Navajo (77%) and Apache (52%) counties.

 Population of children birth to age 4 by ethnicity

        Santa Cruz County
             Yuma County
         Greenlee County
            Pima County
            La Paz County
           Cochise County
                                                                                                  Hispanic or Latino
         Maricopa County
             Pinal County
                                                                                                  White (not-
          Graham County
                                                                                                  Hispanic)
           Yavapai County
                                                                                                  American Indian
             Gila County
          Mohave County
                                                                                                  Other
         Coconino County
            Navajo County
    AZ Tribal Reservations
           Apache County
                             0%          20%           40%          60%          80%       100%

Source: U.S. Census Bureau (2010). 2010 Decennial Census, Summary File 1, Tables P12A-I.
Retrieved from: http://factfinder.census.gov
Note: The Other category includes African American and Asian American/Pacific Islander                                 6
STATUS OF ARIZONA'S YOUNG CHILDREN: A DATA SUMMARY - First ...
YOUNG CHILDREN LIVING IN POVERTY

Proportionally, more Arizona residents struggle with poverty than the nation as a whole. Whereas 18% of
Arizona residents live below the federal poverty level (FPL), 16% fall beneath the threshold nationally.
Distressingly, childhood poverty rates are higher than overall population poverty rates in both the state and
the nation. Though rates of poverty for young children have begun to drop from the levels seen at the
height of the Great Recession, a greater proportion of young children in Arizona live in poverty than their
peers across the country.

Percentage of children birth through age 5 living in poverty

          United States                                    25%
                Arizona                                          29%
 AZ Tribal Reservations                                                                                55%
        Apache County                                                                            51%
         Navajo County                                                                46%
            Gila County                                                              45%
       Mohave County                                                           40%
         La Paz County                                                 36%
      Coconino County                                                34%
     Santa Cruz County                                              33%
        Yavapai County                                            31%
        Graham County                                           29%
           Pima County                                          29%
        Cochise County                                         28%
      Maricopa County                                         27%
          Yuma County                                       26%
           Pinal County                                     26%
      Greenlee County                             18%
                          0%       10%          20%           30%          40%           50%            60%
Source: U.S. Census Bureau (2014). 2009-2014 American Community Survey 5 Year Estimates, Table
B17001                                                                                                        7
LIVING ARRANGEMENTS

 Percentage of children (0-5) living with grandparents

                                               12%
             Arizona                              14%
                                                                                                       40%
  Apache County                                                                          32%
                                                                               28%
   Navajo County                                                             27%
                                                                  22%
  Graham County                                                  22%
                                                               21%
  Greenlee County                                            19%
                                                             19%
   La Paz County                                     16%
                                                   15%
 Mohave County                                    14%
                                                 14%
    Pinal County                               13%
                                               13%
 Maricopa County                              12%
                          0%    5%     10%       15%       20%        25%         30%     35%    40%         45%

Source: U.S. Census Bureau (2010). 2010 Decennial Census, Summary File 1, Table P41
Retrieved from: http://factfinder.census.gov

Percentage of children living with one, unmarried parent

     United States                                          35%
          Arizona                                             38%
         AZ Tribal…                                                                              68%
    Apache County                                                                       57%
     La Paz County                                                             52%
    Navajo County                                                             52%
       Gila County                                                          49%
 Santa Cruz County                                                         48%
  Coconino County                                                        46%
  Greenlee County                                                      44%
      Pima County                                               40%
   Mohave County                                                 40%
   Graham County                                              37%
      Pinal County                                           36%
  Maricopa County                                            36%
     Yuma County                                            36%
   Cochise County                                          34%
   Yavapai County                                         34%
                     0%        10%     20%         30%         40%          50%         60%      70%         80%

Source: American Community Survey, 5-year estimates (2009-2013), Tables B05009, B09001, B17006
Retrieved from: http://factfinder.census.gov
                                                                                                                   8
LIVING ARRANGEMENTS

Percentage of children born to a teen mother, 2013

Source: American Community Survey, 5-year estimates (2009-2013), Tables B05009, B09001, B17006
Retrieved from: http://factfinder.census.gov

                                                                                                 9
FAMILY SUPPORT

SNAP is the Supplemental Nutrition Assistance Program.
TANF is the Temporary Assistance for Needy Families Program.

                                                               10
FAMILY SUPPORT

Non-fatal Emergency Department Visit Injuries: County Summary by Year

                                                  2012                      2013                       2014
 Apache County                                      373                       330                        320
 Cochise County                                   1,140                     1,083                      1,010
 Coconino County                                    842                       805                        790
 Gila County                                        456                       404                        430
 Graham County                                      492                       414                        498
 Greenlee County                                     44                        36                         32
 La Paz County                                       96                        84                         85
 Maricopa County                                 31,903                    29,448                     29,427
 Mohave County                                    1,439                     1,351                      1,338
 Navajo County                                      561                       539                        605
 Pima County                                      6,543                     6,325                      6,191
 Pinal County                                     2,795                     2,699                      2,624
 Santa Cruz County                                  470                       461                        460
 Yavapai County                                   1,275                     1,239                      1,188
 Arizona                                        49,453                    46,407                     46,033

Source: Unintentional injuries for children ages 0-5, 2012-2014. Arizona Department of Health Services
(2015). [Unintentional Injury Report]. Unpublished raw data received from First Things First State Agency
Data Request.

                                                                    Source: Department of Child Safety Reports. This
                                                                    figure represents the number of young children in out
                                                                    of home care on the last day of the reporting period
                                                                    (September 30 of each year represented).

                                                                                                                            11
EDUCATED YOUNG STUDENTS
Quality early learning promotes success in school and in life. The quality of a child’s early experiences
impacts whether their brain will develop in ways that promote optimal learning. Research has demonstrated
that children with access to quality early learning environments are more prepared for kindergarten: they
have increased vocabulary, better language, math and social skills, have more positive relationships with
classmates, and score higher on school-readiness assessments. They are less likely to need special education
services or be held back a grade, and are more likely to graduate and go on to college.

                                       Compared to the U.S. as a whole:

                                       Far fewer of Arizona’s 3- and 4-year-olds
                                       attend preschool
                                             35%            48%

                                       Healthy development is important for school readiness. Early
                                       identification of developmental delays – through regular screenings
                                       starting at birth – is a critical first step to ensuring that children receive
                                       the intervention and support that can mitigate the impact of the delays
                                       on their future learning. Left unaddressed, many developmental issues
                                       can become learning problems later in a child’s life.

                                       Fewer of Arizona’s young children received
                                       developmental or sensory screenings
                                             22%            31%

First Things First promotes early learning by: completing more than 31,000 screenings to detect
developmental or sensory issues that can become learning problems later on; working with almost
1,000 child care and preschool providers statewide to enhance the quality of early learning programs
for more than 50,000 young children statewide; funding scholarships helped more than 16,600
children access early learning in the past year alone; working with relatives and friends who provide
child care to increase their knowledge of brain development and young children’s learning; and
helping early educators expand their skills working with infants, toddlers and preschoolers.

                                                                                                                12
4   |
EARLY CARE AND EDUCATION: DEMAND

 Research has overwhelmingly shown that young children exposed to quality early education have a better
 chance at succeeding academically in their early years and later in life. Unfortunately, far fewer 3- and 4-year
 olds in Arizona are enrolled in early education (36%) than same-aged children across the country (48%).

   Percentage of 3 and 4 year-olds attending preschool

             United States                                                                  48%
                   Arizona                                              36%
         Greenlee County                                                                              56%
         Coconino County                                                                     50%
           Navajo County                                                              44%
             Yuma County                                                        41%
          Apache County                                                         41%
   AZ Tribal Reservations                                                      40%
          Yavapai County                                                       40%
              Pima County                                                     39%
          Cochise County                                                     38%
          Mohave County                                                35%
         Maricopa County                                               35%
            La Paz County                                       30%
              Pinal County                                     29%
          Graham County                                      28%
               Gila County                                 26%
       Santa Cruz County                         19%
                             0%        10%     20%          30%           40%           50%                60%

 Source: U.S. Census Bureau (2014). 2009-2014 American Community Survey 5 Year Estimates, Table
 B14003. Retrieved from: http://factfinder.census.gov

 Considering approximately 60% of children in Arizona have parents who are employed, the demand for
 early care in Arizona greatly exceeds the number of children currently enrolled.

  Percentage of children with employed parents

                                                                                                                       65%
                     Arizona                                                                                     60%
                                                                                                                       66%
         Coconino County                                                                                              65%
                                                                                                                    64%
           Mohave County                                                                                           63%
                                                                                                                  62%
        Santa Cruz County                                                                                       60%
                                                                                                               60%
         Maricopa County                                                                                       59%
                                                                                                             59%
           Cochise County                                                                                    58%
                                                                                                           56%
            Navajo County                                                                                  56%
                                                                                                     53%
   AZ Tribal Reservations                                                                            53%
                                                                                                  49%
           Graham County                                                                    46%
                                  0%     10%      20%           30%           40%            50%            60%          70%
Source: U.S. Census Bureau (2016). 2010-2014 American Community Survey 5 Year Estimates, Table B14003.
Retrieved from: http://factfinder.census.gov                                                                                   13
EARLY CARE AND EDUCATION: COST OF CARE

                                         The cost of child care may very well be a factor in this
                                         low enrollment, with center-based early care and
                                         education for a single infant, a toddler, or a 3- to 5-
                                         year-old costing an Arizona family an estimated 17, 15
                                         and 11 percent of their income respectively. The U.S.
                                         Department of Health and Human Services
                                         recommends that parents spend no more than 10
                                         percent of their family income on early care and
                                         education. The cost for early care and education at a
                                         licensed child care center is considerably higher than
                                         in a family care setting, particularly for children under
                                         3 years old. This may leave families who want an early
                                         learning program for their child with few affordable
                                         options.

                                         Estimated median annual charges by
                                         licensed child care providers

                                                                         Certified       Approved
                                                        Child Care
                                                                          Group           Family
                                                         Centers
                                                                          Homes           Homes
                                         Infants
                                         under 1           $10,080           $6,480          $5,280
                                         year old
                                         Children
                                                             $9,120          $6,000          $4,800
                                         ages 1 or 2
                                         Children
                                                             $6,480          $6,000          $4,800
                                         ages 3 to 5

                                    Source (left): US Census Bureau (2014). 2009-2013 American
                                    Community Survey 5 Year Estimates, Table B19126.

                                    Source (above): Arizona Department of Economic Security (2015).
                                    [Child care market rate survey data]. Unpublished raw data received
                                    from First Things First State Agency Data Request.

                                                                                                      14
EARLY CARE AND EDUCATION: ARIZONA SUPPORTS

With half of young children in Arizona living below the Federal Poverty Level, the number in need of child
care subsidies is likely much higher than those receiving them. The State of Arizona currently receives more
than $118 million per year in federal Child Care and Development Fund (CCDF) grant funds. The CCDF grant
requires that the State provide both Maintenance of Effort (MOE) and matching funds. Since the grant’s
inception, the Department of Economic Security (DES) has been designated by the governor as the lead
agency for the CCDF. FTF collaborated with the Governor’s Office and DES in establishing a Memorandum of
Understanding (MOU) to leverage FTF investments as the MOE and State match. Over the six years this MOU
has been in place, Arizona has been able to leverage almost $228 million in federal child care funds that
otherwise would have been lost.

Federal child care matching funds and draw down

                         45
                         40
                         35
   Millions of Dollars

                         30
                                                                                Federal Child Care Subsidy
                         25                                                     Dollars Drawn Down as a
                         20                                                     Result of FTF-DES MOU
                         15
                                                                                FTF Match Provided
                         10
                          5
                          0
                              2011   2012     2013     2014       2015   2016
                                            Federal Fiscal Year

 Source: First Things First (2016). 2016 Annual Report.
 Retrieved from: http://azftf.gov/WhoWeAre/Board/Documents/FY2016_Annual_Report.pdf

                                                                                                             15
EARLY CARE AND EDUCATION: QUALITY MATTERS

Number of regulated child care providers

*Child Care Centers: inclusive of Head Start, DHS Licensed Centers, Military and Tribally Regulated Centers
**Regulated Homes: inclusive of DHS Child Care Group Homes, DES Certified Homes

                                                                                                              16
EARLY CARE AND EDUCATION: QUALITY FIRST

The child care options currently available in Arizona’s communities can contain vast differences as to the
quality of care and education provided. That is why First Things First created Quality First - Arizona’s Quality
Improvement and Rating System – to create a unified, measurable standard of care, inform parents on their
local providers’ proximity to that standard, improve quality and promote school readiness. The latest data
indicate that Quality First has significantly improved the quality of early learning options available to
Arizona’s families. In fiscal year 2013, 25% of 857 participating providers met quality standards. Over the
past three years, both enrollment and quality improvement have improved. In fiscal year 2016, 65% percent
of 918 participating providers met or exceeded quality standards. When combined with providers who
continue to work diligently on enhancing the quality of their child care and preschool programs, Quality First
has ensured that more than 51,069 children throughout the state have access to a higher standard of early
education.

An increasing number of child care providers are achieving a quality-level rating.
Figure1. Quality Improvement andRatingSystemProgress andOutcomes
                          JUNE 2013    JUNE 2014    JUNE 2015     JUNE 2016      Part icipant s wit h a Qualit y Level (3-5 st ars) Rat ing

  Participants with
                            857           912          933           918
  a Star Rating                                                                 70%

  Highest Quality                                                               60%
  (5 stars)                  16           23            36           47
                                                                                50%
  Quality Plus
  (4 stars)                  55           95           136           183        40%

                                                                                30%
  Quality
  (3 stars)                 144           235          302           371
                                                                                20%

  Progressing Star          602           547          442           311
                                                                                10%
  (2 stars)
                                                                                 0%

  Rising Star
                                                                                          25%           39%           51%           65%

  (1 star)                   40           12            17            6                JUNE 2013     JUNE 2014     JUNE 2015     JUNE 2016

  Source: First Things First (2016). Annual Report.
  Retrieved from http://azftf.gov/WhoWeAre/Board/Documents/FY2016_Annual_Report.pdf

MOREINFANTS, TODDLERSANDPRESCHOOLERSACCESSEDQUALITY
EARLYLEARNINGTHROUGHFIRSTTHINGSFIRST
First Thing s First also prioritize s acce ss to quality e arly learning prog ram s by fund ing Quality First scholarships..
The inte nt of this evid e nce -base d strateg y is to a
                                                       provide fin nci al assi stanc e in the form of scholarships for child re n
from low -incom e fam ilie s (20 0 % of Fe d e ralPove rty Leveland be low) to attend quality e arly care and e ducation
programs. The intended outcome for children and families is increased access for families to quality early care and
                                                                                                                                              17
education settings that promote readiness for kindergarten.

Acce ss to quality e arly care and e ducation prog ram s can re sult in social, de ve lopm entaland he alth be nefits to
THIRD GRADE READING AND MATH ACHIEVEMENT

              Third Grade AzMERIT Performance in 2015 and 2016

                                N= 85,462   N=86,733                     N= 85,860       N= 87,161
                         100%
                                   11         12                          13               17
                         90%
                         80%
Percentage of Students

                                   30         29                          29                         Highly Proficient
                         70%                                                               29
                         60%                                                                         Proficient
                         50%       16         14
                                                                                                     Partially Proficient
                         40%                                              31               30
                                                                                                     Minimally Proficient
                         30%
                         20%       43         45
                                                                          27               25
                         10%
                          0%
                                  2015      2016                         2015             2016
                                  Language Arts                                  Math

      Source: The Arizona Department of Education. Retrieved from http://www.azed.gov/research-
      evaluation/aims-assessment-results/ Note: Column totals may not sum to 100% due to rounding.

                                                                                                                         18
THIRD GRADE READING AND MATH ACHIEVEMENT

 Percentage of 3rd grade children passing AzMERIT in 2016, by risk factors

 Economically Disadvantaged
                                                         31%
                                                       28%

                   Disabilities
                                                 20%
                                               17%

   Limited English Proficiency
                                          8%
                                   3%                                                                    Math
                    Homeless
                                                  22%                                                    English
                                                 20%

                      Migrant
                                                     23%
                                               15%

                 All Students
                                                                    42%
                                                                   40%

                                  0%      5%     10%       15%     20%    25%   30%   35%   40%   45%     50%

Source: The Arizona Department of Education. Retrieved from http://www.azed.gov/research-
evaluation/aims-assessment-results/

Percentage of 3rd grade children passing AzMERIT in 2016, by ethnicity

               Two or More Races                             48%
                                                              50%
                 African American                    28%
                                                     27%
                                  Asian                               72%
                                                                    65%
 American Indian/Alaskan Native                   23%
                                                18%                                                      Math

                   Hispanic/Latino                   32%                                                 English
                                                    28%
             White (Not-Hispanic)                                 55%
                                                                  56%
                        All Students                        42%
                                                           40%
                                          0%    10%        20%     30%    40%   50%   60%   70%    80%

Source: The Arizona Department of Education. Retrieved from http://www.azed.gov/research-
evaluation/aims-assessment-results/

                                                                                                                   19
HEALTHY KIDS
Children’s health encompasses not only their physical health, but also their mental, intellectual, social and
emotional well-being. Factors such as a mother’s prenatal care, access to health care and health insurance,
and receipt of preventive care such as immunizations and oral health care all influence a child’s current
health and also their long-term development and success.

                                        Arizona’s babies are born healthier than their peers nationally,
                                        which is encouraging.

                                        FEWER AZ BABIES ARE BORN
                                           w/low birth weight
                                                                   9,10

                                                                                            7%             8%

                                           premature
                                                        9,10

                                                                                            9%             11%

                                        Yet, too many children lack the necessary immunizations before
                                        they enter school, and many lack access to care to prevent dental
                                        problems – a key cause of school absenteeism later on.

                                        MORE YOUNG CHILDREN IN AZ
                                           lack health insurance                            9%             5%
                                                                          11

                                           have untreated tooth decay
                                                                                    12,13

                                                                                            27%            21%

                                           lack needed vaccinations                         33.9%        28.4%
                                                                               14

First Things First supports healthier kids by supporting pregnant mothers; giving parents tools to promote
good nutrition and healthy weight; expanding access to oral health screenings and preventive fluoride
varnishes; building awareness of health insurance options available for families with children; helping early
educators meet the social-emotional needs of kids in their care; and, improving health practices in home-
and center-based child care settings.

                                                                                                            20
CHILD HEALTH AND WELL-BEING: BIRTHS

                                      The decline in the birth rate appears to have
                                      stabilized, with a slight (2%) increase in births
                                      between 2013 and 2014.

                                      The majority of births (54%) in 2013 were publicly
                                      funded births, followed by births paid for through
                                      private insurance.

                                                                                          21
CHILD HEALTH AND WELL-BEING: BIRTH CHARACTERISTICS

                                        In addition, in 2013, fewer Arizona’s babies were
                                        born at low birth weight (7% AZ vs. 8% U.S.), or
                                        prematurely (9% AZ vs. 11% U.S.) than those
                        AZ     US       across the nation. These indicators also
Low birthweight         7%     8%       represent success relative to the Healthy People
(5.5 pounds or less)                    2020 target of less than 7.8 percent for low birth
                                        weight and less than 11.4 percent for premature
High birthweight        8%     8%       births. The percentage of babies born in Arizona
(8.8 pounds or more)
                                        with high birth weight is similar to the nation (8%
                                        for both). While the concerns related to low birth
Fewer than 9 prenatal   19%    NA
visits                                  rate are widely known, fetuses who are
                                        significantly larger than average, a condition
Mother was 17 or        2.4%   2%       known as macrosomia, are associated with
younger                                 health risks for both the mother and infant
                                        during birth. These children are also at increased
Mother was 19 or        9%     7%
                                        risk for obesity and metabolic syndrome (which
younger
                                        is linked to an increase risk of heart disease,
                                        stroke, and diabetes).

                                        The number of teens becoming parents in
                                        Arizona remains a concern. The percentage of
                                        births to teen others is higher in Arizona than
                                        across the nation for both mothers under the
                                        age 17 and under the age of 19. In 2013, there
                                        were 2,056 births to mothers 17 or younger in
                                        AZ, and 7,222 births to mothers 19 or younger.

                                                                                          22
CHILD HEALTH AND WELL-BEING: BIRTH CHARACTERISTICS

Percentage of babies born with low birthweight in 2013

9%                                                     8% 8%           8%
8%                                          8% 8% 8%
                                       7%
                           7% 7% 7% 7%                            7%
7%                 6% 7%
6%         6% 6%
      5%
5%
                                                                             Healthy People
4%
                                                                             2020 Goal
3%
2%
1%
0%

Percent of babies born premature (
CHILD HEALTH AND WELL-BEING: PREVENTIVE HEALTH

Children with health insurance are more likely than those without to have a regular and accessible source of
health care. The American Community Survey five-year estimates cover the years 2010-2014. In that time
period, approximately 10 percent of children ages birth to 5 were estimated to be uninsured. The
percentage of uninsured children in Arizona remains greater than that of the nation, while the county
disparities within show a large variation within the state.

   Percentage of children ages 0-5 without health insurance

     United States                       6%
            Arizona                                   10%
  Greenlee County                                                                                   25%
        Gila County                                                            18%
    Apache County                                                        16%
   Mohave County                                                   15%
  Coconino County                                                 14%
   Graham County                                                 14%
 Santa Cruz County                                            13%
      Yuma County                                            12%
   Yavapai County                                      10%
       Pinal County                                   9%
       Pima County                                   9%
  Maricopa County                                    9%
    Navajo County                                    9%
   Cochise County                                  8%
     La Paz County                            7%
                      0%            5%              10%          15%             20%            25%       30%

Source: U.S. Census Bureau (2016). 2010-2014 American Community Survey 5 Year Estimates, Table B27001.
Retrieved from: http://factfinder.census.gov

A recent survey shows that the prevalence of decay in Arizona kindergarteners has decreased in the past
several years, going from 35 percent to 27 percent. Similar to health insurance, county data shows how
within the state, decay experience can widely vary.

                                                                                                                24
CHILD HEALTH AND WELL-BEING: PREVENTIVE HEALTH

  Prevalence of decay experience in kindergarten children by county

Source: First Things First (2016). Taking a bite out of school absences: Children's oral health report 2016.
Retrieved from http://azftf.gov/WhoWeAre/Board/Documents/FTF_Oral_Health_Report_2016.pdf

AzEIP Referrals and Children (0-5) Served in 2014

                                Total Referrals             Total Served              Intervening early is critical to
                                                                                      ensuring Arizona’s children are
Apache County                                66                       40
                                                                                      prepared for and ready to succeed in
Cochise County                              227                       52
Coconino County                             252                       92
                                                                                      school. Within Arizona, AzEIP is

Gila County                                  80                       37              currently serving just over 5,000
Graham County                                81                       40              children meeting eligibility
Greenlee County                            N/A                      N/A               requirements for early intervention
La Paz County                                12                     N/A               services. ("Children served" only
Maricopa County                           7,499                   3,474               includes those with a family service
Mohave County                               235                     102               plan.)
Navajo County                                83                       39
Pima County                               1,749                     668
Pinal County                                733                     407
Santa Cruz County                           101                       37
Yavapai County                              268                     116
Yuma County                                 331                       95
Arizona                                11,741                     5,248

Source: Arizona Department of Economic Security (July 2015). [Special needs dataset]. Unpublished data.
Note: Entries of “N/A” indicate percentages which cannot be reported because of data suppression, or are
otherwise not available.

                                                                                                                            25
You can also read