Study on the Perception of High Visibility Level Values
←
→
Page content transcription
If your browser does not render page correctly, please read the page content below
15. Internationales Forum für den lichttechnischen Nachwuchs
 Ilmenau, 04. – 06. Juni 2021
 DOI (proceedings): 10.22032/dbt.48427
DOI: 10.22032/dbt.49335

Study on the Perception of High Visibility Level Values

Simon Vogel M.Sc.1,*, Saba Nouzari1, Dr.-Ing. Mathias Niedling1, Prof. Dr.-Ing. habil. Stephan
Völker2
1
 Research Institute of Automotive Lighting and Mechatronics (L-LAB), HELLA GmbH & Co.
KGaA, Rixbecker Straße 75, 59552 Lippstadt
2
 Technical University of Berlin, Chair of Lighting Technology, Faculty of Electrical Engineering
and Computer Science, Einsteinufer 19, 10587 Berlin
*Corresponding author: simon.vogel@l-lab.de

Abstract
For the development of new lighting functions of modern automotive headlamp
systems suitable quality factors are needed to evaluate the driver’s visual performance.
The Visibility Level (VL), which compares the contrast of an object with its threshold
contrast, has proven to be one of these quality factors. While the perception of small
VL values have been extensively investigated, high VL values have not been
assessed. Results can help to determine how much light is actually needed to
illuminate a situation sufficiently so that vehicles can drive without a loss of safety but
at a reduced energy consumption.
Here the results of a study in the light tunnel facility of the HELLA GmbH & Co. KGaA
in Lippstadt are presented. After the generation of different light distributions, the object
luminance is measured and the different VL values of the viewing target are estimated.
In the first part of the study a praxis factor for this scenario is determined, which is used
for the calculation of the actual VL. The praxis factor equals 10.27.
In the second part of the study different light distributions, which create different VL
values from 4 to 120, are then shown to and assessed by the study participants. The
evaluation shows a saturating assessment of VLs higher than 90. Viewing targets with
a VL above this value are all equally described as perfectly visible. A VL above 65
leads to a well visible target.
These results are a starting point for upcoming work regarding the generation of new
light distribution, such that light will be brought to the streets more adequately.
Index Terms: Visibility Level, visual performance, empirical study, light distributions,
 headlamp, automotive lighting

© 2021 by the authors. – Licensee Technische Universität llmenau, Deutschland.
 This is an Open Access article distributed under the terms of the
 Creative Commons Attribution ShareAlike-4.0 International License,
 (https://creativecommons.org/licenses/by-sa/4.0/). - 285 -

15. Forum für den lichttechnischen Nachwuchs
 Ilmenau, 04 – 06 Juni 2021

1 Introduction

1.1 Motivation
Future automotive headlamp systems will be more intelligent and more connected than
their present predecessors. Precise adaptation to different scenarios and conditions
based on the drivers needs will be provided by changing their light distribution
accordingly [1].
To generate and evaluate these new light distributions a suitable visual performance
model is required [2]. In this context visual performance describes the performance of
a human regarding a visual task like detection or identification of a target. Ideally, the
visual performance, which leads to an action in the driving task, can be predicted by
controllable parameters. The illuminance caused by the headlamp creates contrasts of
objects within the light distribution in a specific environment, which then can be
assessed with a visual performance model.
The visual performance model examined is the Visibility Level (VL) as proposed in the
CIE report 19/2 [3]. The VL model compares the contrast C of a target with the
threshold contrast Cth based on Blackwell’s psychophysical data [4]:
 C
 VL = (1)
 Cth
Thus, a VL of 1 means that the target is just visible under laboratory conditions.
While the determination of the VL is more complex than of usual performance indices
of headlamps like their illuminance distributions on the street [5], the VL instead is
directly connected with the detection task. Since according to the CIE [6] the detection
of an object is the key step in the attention-detection-recognition pipeline, the VL is
much more suitable to evaluate the illumination of a scene regarding the resulting traffic
safety.

1.2 Research question
In this study VL values up to 120 are examined with focus on their perception and
evaluation by test persons. The main research questions are:
 1. Does the perception of differences between VL values decrease for
 increasing VL values?
 2. Is there a threshold VL value that indicates an indistinguishability for
 exceeding VL values?
Both questions are expected to be answered positively.
Comparable observations were presented in [7]. However, those results were not
presented under real situations but instead on a computer screen. It has also been
shown in the past, that a reduction of light is still assessed as sufficiently enough [8][9].

©2021 by the authors. – Licensee Technische Universität llmenau, Deutschland. - 286 -
15. Forum für den lichttechnischen Nachwuchs
 Ilmenau, 04 – 06 Juni 2021

While these examinations did not focus on the visibility of a specific viewing target
similar result are expected for the VL.

2 Design of the study
The study was realized in the light tunnel of the HELLA company in Lippstadt,
Germany. The light tunnel is a 140 m long dark hall with two asphalted lanes and
exemplary lane markings, such that realistic night driving conditions can be realized
even during the day. The light tunnel is equipped with modern video projectors capable
of a luminous flux output of 60 000 lm as well as different headlamp systems to realize
different light conditions.
20 test persons (15 male, 5 female) with an average age of 31.3 ± 8.9 years took part
in the study. All of them were employees or students of HELLA, therefore their
knowledge about automotive lighting is above the average driver. 15 of them used
either glasses or contact lenses during the study. The 20 test persons were split into 5
groups of 4 people.

2.1 Study setup

 Figure 1: Study setup in the light tunnel, 4 test persons were positioned
 next to each other behind the video projectors looking along the road at
 the viewing target.

The setup for the study is shown in Figure 1. The test persons are seated with a
distance of 1.5 m between each other behind the light sources. To guarantee perfect
viewing positions the back-row seating level is slightly elevated.
Two Barco HDF-W30 Flex projectors are used as the light sources as shown in Figure
2. The projectors have a resolution of 1920 x 1200 pixels and 8 Bit output levels. They
are positioned in height (0.65 m) and width (1.30 m) as well as orientation to the lane

©2021 by the authors. – Licensee Technische Universität llmenau, Deutschland. - 287 -
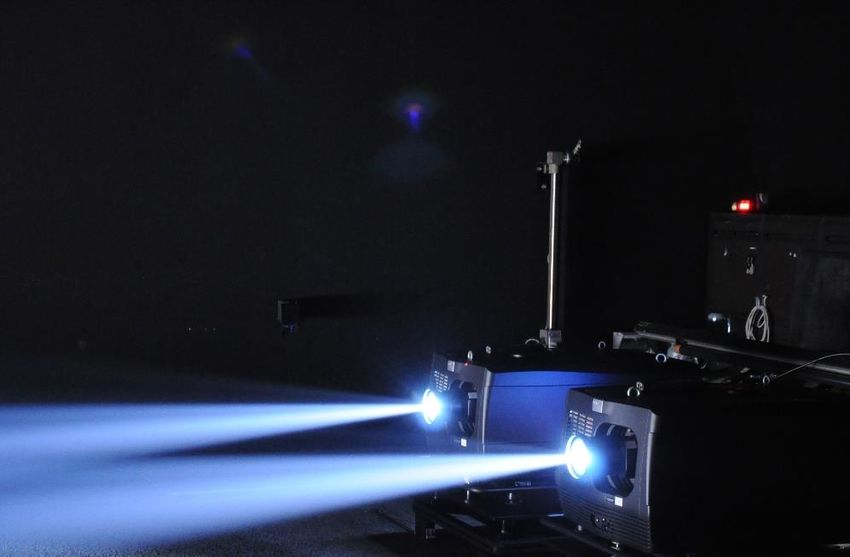
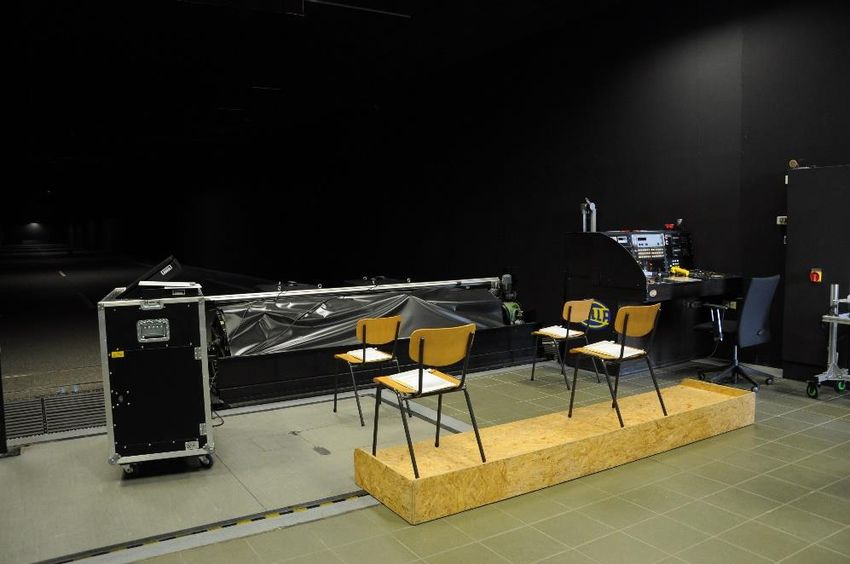
15. Forum für den lichttechnischen Nachwuchs
 Ilmenau, 04 – 06 Juni 2021

markings according to ECE R48. The console on the left in Figure 1 controls the light
output.
The viewing target is shown in Figure 3. It is a 30 cm x 30 cm sized cardboard square
painted in dark grey with a reflectivity ρ of 5,2 %. It is positioned 50 m ahead of the test
persons in the middle of the driving lane, perpendicular to the road surface.
A precise draft with all the different distances is shown in Figure 4.

 Figure 2: Two Barco HDF-W30 Flex projectors serve as the light
 sources; they have sufficient luminous flux output of 30 000 lm each
 and can precisely imitate light distributions of headlamp systems.

2.2 Study execution
The study consisted of two different tasks.
 1. The test persons were asked for their ability to detect the viewing target for
 decreasing and increasing VLs.
 2. The test persons were asked to rate the visibility of the viewing target with 6
 different grades for a variety of different VLs.
The test persons were explained each task individually so that they had time to ask
questions. The adaptation time was limited to 1 minute as a trade-off between
economical study execution and decreasing dark adaptation slopes [10].
First, the visibility threshold was determined to calculate the relevant praxis factor of
the viewing scenery, which is required for the computation of the VLs. For this the first
task was split into two parts with incrementally decreasing and increasing light output.
The test persons were asked to check a box when the viewing target, which was
presented to them beforehand, was detectable. For the decreasing light output the test

©2021 by the authors. – Licensee Technische Universität llmenau, Deutschland. - 288 -
15. Forum für den lichttechnischen Nachwuchs
 Ilmenau, 04 – 06 Juni 2021

persons could all recognize the viewing target in the beginning. They stopped checking
the box once crossing a threshold. For the increasing light output the viewing target
started undetectable and then became visible after crossing the threshold. Using the
method of limits [11] the actual threshold of perception is calculated by the average of
both approaches.

 Figure 3: Grey square board with a size of 30 cm and a reflectivity ρ of
 5.2 %, positioned 50 m ahead of the test persons in the middle of the
 driving lane served as the viewing target.

 Figure 4: Draft of the study setup in the light tunnel, test persons
 located on the left, behind the video projectors, viewing target 50 m
 ahead of the projectors in the middle of the lane.

©2021 by the authors. – Licensee Technische Universität llmenau, Deutschland. - 289 -
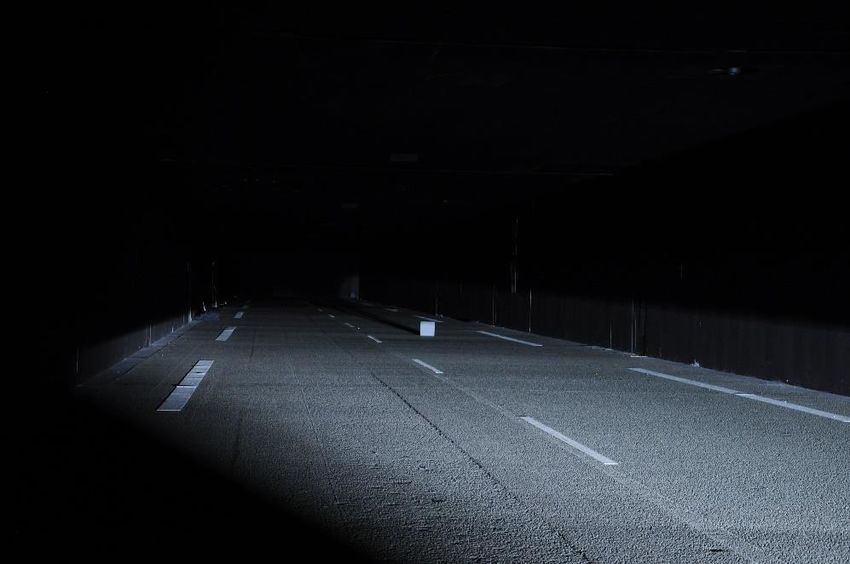
15. Forum für den lichttechnischen Nachwuchs
 Ilmenau, 04 – 06 Juni 2021

In the second task the test persons reviewed 80 different light distributions with varying
VLs. These light distributions were created by scaling the standard asymmetrical low
beam distribution. The test persons used grades from 1 (very poorly visible) to 6
(perfectly visible). The contrast of the viewing target was always above the threshold
contrast; thus, the target was never undetectable for the test persons in this part of the
study. The 80 light distributions were shown in a random order to prevent any order
effects. To give the test persons the opportunity to create their own evaluation
framework, the first 10 distributions were not evaluated. They also contained the
maximum as well as the minimum VL of the study. Each light distribution was shown
for 5 seconds followed by 5 seconds of no light.

3 Results
The analysis of the results combine the VL, which is extracted from luminance
measurements and enhanced by the precise praxis factor results of the first part of the
study, with the actual evaluation of the visibility of the viewing target, which was the
second part of the study.

3.1 Luminance measurement and theoretical Visibility Level
Each light distribution was measured prior to its presentation to the test persons with
a TechnoTeam LMK 5 Color luminance measuring video photometer. An exemplary
picture is shown in Figure 5.

 Figure 5: Luminance measurement of the scene with TechnoTeam
 LMK 5 Color, viewing target located 50 m ahead of the camera in the
 middle of the lane, areas for the calculation of the contrast are shown
 in red (object luminance) and orange (background luminance), the size
 of the viewing target is 29.4’.

©2021 by the authors. – Licensee Technische Universität llmenau, Deutschland. - 290 -
15. Forum für den lichttechnischen Nachwuchs
 Ilmenau, 04 – 06 Juni 2021

The viewing target’s VL is then calculated from the luminance measurement using the
model of Kokoschka und Gall [12] as explained in the following section.
The VL is the ratio of contrast and threshold contrast (see Equation (1)). According to
Weber the contrast equals
 LO -LB
 C= | |, (2)
 LB
with the luminance of the object LO and the background luminance LB . The object
luminance is the mean of the luminance of the object area (red area), while the
background luminance is averaged over two rectangulars with half the square’s width
left and right of the object (orange areas) as shown in Figure 5.
The actual threshold contrast consists of three components
 Cthr,actual =Cthr,theoretical ∙PF∙TSF. (3)
Cthr,theoretical is the theoretical threshold contrast based on the Blackwell data, PF is the
praxis factor, which describes the complexity of the viewing situation (in this case
estimated to be around 10 according to Kokoschka [13]). The TSF is the transient
threshold increment factor (German: Transienter Schwellenerhöhungsfaktor), which
considers the influences of a very inhomogeneous luminance distribution in the
scenery.
The theoretical threshold contrast is calculated according to
 La c2 α0 2
 Cthr,theoretical =Cmin ∙ (1+ ( ) ) ∙ (1+ ( ) ) (4)
 c1 α

 1
 α0 = 3 + 4 (1 − ) (5)
 La 6
 1+( )
 5
 = 0.00275, 1 = 0.185, 2 = −0.484, 3 = 7.5, 4 = 133, 5 = 0.00075, 6 = −0.383
with La being the adaptation luminance and α the size of the viewing target in angular minutes.
The adaptation luminance La is calculated as the mean luminance of an ellipsis with a width of
10° and 2° height focused on the middle of the street as proposed in [14].
The transient threshold increment factor is calculated with
 1 (1+LB /La )2
 TSF= (6)
 4 LB /La
using LB – the background luminance – and La – the adaptation luminance.
All these input parameters but the praxis factor can be deduced from the luminance
measurement. The praxis factor itself must be determined during the first part of the study. The
veil luminance is ignored in this examination.

©2021 by the authors. – Licensee Technische Universität llmenau, Deutschland. - 291 -
15. Forum für den lichttechnischen Nachwuchs
 Ilmenau, 04 – 06 Juni 2021

3.2 Determination of the praxis factor
In the first part of the study 20 different light distributions with incrementally decreasing
and increasing light output were shown to the test persons. These light distributions
were measured beforehand and a theoretical VL was calculated using an estimated
praxis factor of 10. The actual praxis factor is to be calculated from the results.
The test persons checked the visibility of the viewing target for each light distribution.
The results are shown in Figure 6 and Figure 7.
The detection ratio is the ratio of people detecting the viewing target and the total
amount of test persons (17 persons in this case, 3 test persons did not follow the
instructions properly).

 Figure 6: Detection ratio of the viewing target of 17 test persons for 20
 different light distributions, the light distributions were assigned different
 VL values according to the luminance measurements using a fixed
 praxis factor, the distributions were shown in order of decreasing VLs,
 a theoretical sigmoid function was fitted to the data to determine the
 praxis factor.

A psychometric function (VL) presented as a sigmoidal distribution in the form
 1
 (VL) = (6)
 1+ ∙(VL− )
was fitted to the data using the method of least squares. According to theory fit
parameter b should be 1, which means that at a VL of 1 the detection ratio is equal to
0.5. A deviation means that the VL has to be calculated using a different praxis factor.
The calculated values are for decreasing VLs
 = −5.46 ± 0.37,

©2021 by the authors. – Licensee Technische Universität llmenau, Deutschland. - 292 -
15. Forum für den lichttechnischen Nachwuchs
 Ilmenau, 04 – 06 Juni 2021

 = 1.038 ± 0.012,
and for increasing VLs
 = −8.14 ± 0.38,
 = 1.017 ± 0.006.

 Figure 7: Detection ratio of the viewing target of 17 test persons for 20
 different light distributions, the light distributions were assigned different
 VL values according to the luminance measurements using a fixed
 praxis factor, the distributions were shown in order of increasing VLs,
 a theoretical sigmoid function was fitted to the data to determine the
 praxis factor.

This means that the calculated VL values calculated using a praxis factor of 10 are not
perfectly scaled. The detection ratio equals 0.5 for a VL of 1.027 ± 0.007 (mean of
and ) instead of 1. Therefore, the actual VL values have to be scaled with a praxis
factor, which takes these results into account.
Thus, the new praxis factor equals
 PF = 10.27 ± 0.07.
These results underline the theoretical expectations. The calculated praxis factor is
only slightly higher than 10. This is in line with previous observations.
The data fits to the sigmoid function with errors below 7%. All this could be achieved
with less than 20 test persons. Additional study participants most likely would have
resulted in even better agreement with the theory.

©2021 by the authors. – Licensee Technische Universität llmenau, Deutschland. - 293 -
15. Forum für den lichttechnischen Nachwuchs
 Ilmenau, 04 – 06 Juni 2021

3.3 Evaluation of different Visibility Levels
Using the actual praxis factor the VL values of the 70 different light distributions were
calculated. Their assessment by the test persons is shown in Figure 8.
The VL values varied from approximately 4 to 120. The evaluation by the test persons
is averaged over all 20 persons and the standard deviation is shown in the error bars.
For easier allocation the different grades are separated by thin grey lines.
The data shows clearly that there are two different behaviors within the assessment of
the VL. For values up to roughly 90 there is a clearly linear performance (slope =
0.047, 2 = 0.953). After that the improvement of the target’s visibility is heavily
decreasing, which results in a nearly saturated behavior (slope = 0.0096, 2 =
0.746). The mean assessment for this segment is above 5.5.
The grade 5 (well visible) is on average reached for a VL of 65. For VLs above 40 the
visibility is evaluated rather good than bad.
All these results underline the expected answers to the research question. The
perception of the differences between different VLs decreases for very high VLs. And
there seems to be a threshold VL (in this case 90) that indicates an indistinguishability
of exceeding VL values.

 Figure 8: Evaluation of the visibility of a viewing target by 20 test
 persons with grades from 1 (very poorly visible) to 6 (perfectly visible)
 in relation to the measured and calculated VL values varying from
 approx. 4 to 120; two different trendlines are fitted to the data showing
 first a linear increase, which then evolves into a saturating behavior
 above a VL of 90.

©2021 by the authors. – Licensee Technische Universität llmenau, Deutschland. - 294 -
15. Forum für den lichttechnischen Nachwuchs
 Ilmenau, 04 – 06 Juni 2021

4 Summary & Outlook

4.1 Summary
In this study 20 test persons evaluated 70 different VL values ranging from
approximately 4 to 120. The research hypothesis that the improvement in visibility
saturates for high VL values is confirmed by the results. VL values above 90 are
reviewed as equal. VL values above 65 are assessed as resulting in a good visibility
for the driver, however this good visibility can still be improved by further increasing
the VL.

4.2 Outlook
These results give a first impression of the perception of high VL values. While their
suitability for real-life situations still has to be proven and further studies – for example
with test persons with more average automotive lighting experience as well as with a
higher average age – are needed, the VL will potentially establish as a quality factor
for the development of light functions for automotive headlamp systems as well as
modern street lighting installations. Such that in the future instead of illuminance values
VL reference values will be used to determine the traffic safety of new systems.

5 References
[1] J. Damasky, W. Huhn, “Variable Headlamp Beam Pattern – Lighting Requirements
for Different Driving Situation”, SAE Technical Paper 970647, 1997.
[2] R. Brémond, “Visual Performance Models in Road Lighting: A Historical
Perspective”, LEUKOS, 2020.
[3] Commission Internationale de l’Eclairage, “An Analytic Model for Describing the
Influence of Lighting Parameters upon Visual Performance”, CIE publication 19/2,
Vienna, 1981.
[4] H.R. Blackwell, “Contrast thresholds of the humane eye”, Journal of the Optical
Society of America, 1946.
[5] S. Völker, “Vergleich unterschiedlicher Kriterien für die Bestimmung der Sichtweite
von Kfz-Scheinwerfern”, Lux junior 2001: 5. Forum für den lichttechnischen
Nachwuchs, Dörnfeld/Ilm, 2001.
[6] Commission Internationale de l’Eclairage, “Fundamentals of the visual task of night
driving”, CIE Technical Report 100, Vienna, 1992.
[7] G. Paulmier, C. Brusque et al., “The influence of visual complexity on the detection
of targets investigated by computer generated images”, Lighting Research &
Technology 33(3), 2001.

©2021 by the authors. – Licensee Technische Universität llmenau, Deutschland. - 295 -
15. Forum für den lichttechnischen Nachwuchs
 Ilmenau, 04 – 06 Juni 2021

[8] P. Janke, A. Thoma et al., „Dimmung des Scheinwerferlichts für zukünftige
Elektrofahrzeuge“, Lux junior 2019: 14. Internationales Forum für den lichttechnischen
Nachwuchs, Dörnfeld/Ilm, 2019.
[9] M. Wagner, A. Erkan et al., “Reducing Head Lighting Level on Urban Roads for
Different Street Lighting Situations”, 13th International Symposium on Automotive
Lighting, Darmstadt, 2019.
[10] R. Greule, “Kontrastschwellen bei transienter Adaptation”, Dissertation,
Lichttechnisches Institut, Universität Karlsruhe, 1993.
[11] E.B. Goldstein, “Wahrnehmungspsychologie: eine Einführung”, Spektrum Akad.
Verlag, Heidelberg, 1997.
[12] S. Kokoschka, D. Gall, “FASIVAL – Entwicklung und Validierung eines
Sichtweitenmodells zur Bestimmung der Fahrersichtweite: Abschlussbericht“, 2000.
[13] S. Kokoschka, “Zur Berechnung von Schwellenkontrasten für die Detektion
einfacher Sehobjekte“, Licht 4, 1988.
[14] J. Winter, “Typical eye fixation areas of car drivers in inner-city environments at
night”, Lux Europa 2013, Krakau, 2013.

©2021 by the authors. – Licensee Technische Universität llmenau, Deutschland. - 296 -
You can also read