Sun Country Airlines May 2021 - Investor Relations | Sun Country Airlines
←
→
Page content transcription
If your browser does not render page correctly, please read the page content below

Sun Country Airlines
May 2021
Disclaimer
Confidentiality and Market Data
This presentation constitutes confidential information and is provided to you on the condition that you will hold it in strict confidence and not
reproduce, disclose, forward or distribute it in whole or in part without the prior written consent of the Company. This presentation has been
prepared by the Company for informational purposes only and not for any other purpose. Nothing contained in this presentation is, or should be
construed as, a recommendation, promise or representation by the presenter or the Company or any director, employee, agent, or adviser of or
the Company. This presentation does not purport to be all-inclusive or to contain all of the information you may desire.
We include statements and information in this presentation concerning our industry ranking and the markets in which we operate, including our
general expectations and market opportunity, which are based on information from independent industry organizations and other third-party
sources (including a third-party market study, industry publications, surveys and forecasts). While we believe these third-party sources to be
reliable as of the date of this presentation, we have not independently verified any third-party information and such information is inherently
imprecise. In addition, projections, assumptions and estimates of the future performance of the industry in which we operate and our future
performance are necessarily subject to a high degree of uncertainty and risk due to a variety of risks. These and other factors could cause
results to differ materially from those expressed in the estimates made by the independent parties and by us.
Cautionary Note Regarding Forward-Looking Statements
This presentation contains forward-looking statements, which involve risks and uncertainties. These forward-looking statements are generally
identified by the use of forward-looking terminology, including the terms “anticipate,” “believe,” “continue,” “could,” “estimate,” “expect,”
“intend,” “likely,” “may,” “plan,” “possible,” “potential,” “predict,” “project,” “should,” “target,” “will,” “would” and, in each case, their
negative or other various or comparable terminology. All statements other than statements of historical facts contained in this presentation,
including statements regarding our strategy, future operations, future financial position, future revenue, projected costs, prospects, plans,
objectives of management and general economic trends and trends in the industry and markets are forward-looking statements. These
statements involve known and unknown risks, uncertainties and other important factors that may cause our actual results, performance or
achievements to be materially different from any future results, performance or achievements expressed or implied by the forward-looking
statements. Certain of these risks are identified and discussed in our filings with the Securities and Exchange Commission. These forward-
looking statements reflect our views with respect to future events as of the date of this presentation and are based on assumptions and subject
to risks and uncertainties. Given these uncertainties, you should not place undue reliance on these forward-looking statements. We undertake
no obligation to update any forward-looking statements, whether as a result of new information, future events or otherwise after the date of
this presentation.

                                                                                                                                                2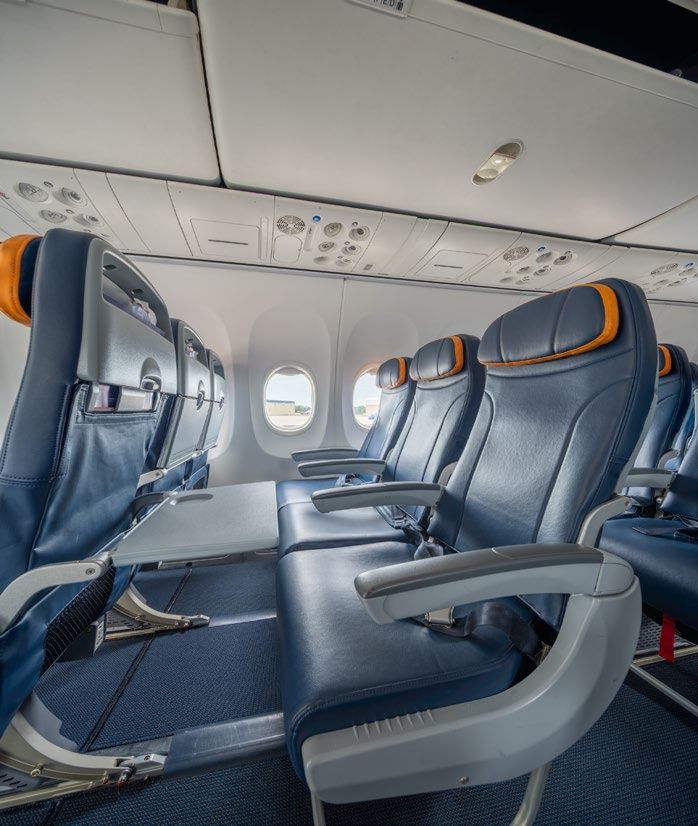
Business
Overview

           3
A New Breed of Hybrid LCC
Sun Country Overview Adjusted EBITDAR (1)
Millions - USD
High growth low cost airline with a
unique and resilient business model
Normalized
Serves the VFR and leisure passenger, $171.1
charter and cargo sectors
Differentiated low fixed cost, asset light $107.0
business model designed to granularly
flex capacity to meet market demand Full Pandemic
$38.9 $37.1
$21.3 $19.4
Best performing airline in the U.S. in
2020 and Q1 21 based on Adjusted
2018 2019 2020 Q1 LTM Q1 2020 Q1 2021
EBITDAR margins 2021
Adjusted EBITDAR margin
18.4% 24.4% 9.7% 6.1% 20.6% 15.2%
Ability to quickly adapt to any demand environment
1 - See Appendix for more information on how we define Adjusted EBITDAR and reconciliations of Adjusted EBITDAR to the most comparable GAAP metric.
4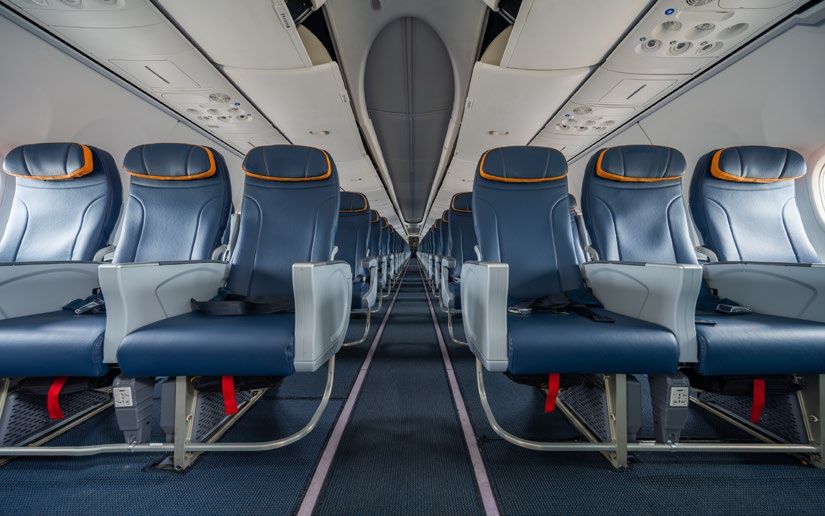
Unique, Diversified Business Model
Sun Country’s symbiotic business lines share assets to maximize operating leverage.
                                                                      Sun Country Business Line Synergies

                                                                                                                                                             2
                          1       Passenger Leisure                                                                                                                   Charter
                                    (~65% of Revenue(1))                                                                                                       (~22% of Revenue(1))
                                  (~60% of Block Hours(1))                                                                                                   (~15% of Block Hours(1))
                        Unique low cost airline with focus on                                                                                    Leading provider of narrowbody charter;
                                   leisure travel                                                                                               providing turnkey charter service to stable
                                                                                                                                                              customer base

                                                                                         3              Cargo
                                                                                                (~11% of Revenue(1))
                                                                                              (~25% of Block Hours(1))
                                                                          Long-term asset-light contract with high margins and
                                                                                cash flows, leveraging shared pilot pool

                                                                               Shared Foundational Assets
                           Aircraft                                                                     Pilots                                                              Shared Services
                                    Standard fleet of 31                                              454 pilots that serve                                                       An already lean operation
                                    Boeing 737s that are                                              across the entire set                                                              supporting
                                   used across scheduled                                                    of assets                                                              the entire set of assets
                                     service and charter

1.   Percentage of revenue and block hours are based on 2019 data and annualized Q1 2021 cargo data. Q1 2021 cargo revenue was $21.6m annualized to $86.3m. Q1 2021 cargo block hours were 8,242 annualized to 32,968   5
Agile Passenger Capacity Built to Capture
Peak Demand
Unlike other passenger airlines, we can quickly shift our capacity to fly only when demand is high
which results in higher yields
Seasonal Demand Dictates Monthly Schedule(1) Day-of-Week Capacity Determined by Demand Patterns(1)
(% of Block Hours) (% of Peak Day ASMs) (TRASM)
15.0% 100% 10.50¢
Charter and Cargo operations
peak in the Fall when Passenger
Leisure is the weakest
10.0% 75% 9.50¢
5.0% 50% 8.50¢
0.0% 25% 7.50¢
Jan Feb Mar Apr May Jun Jul Aug Sep Oct Nov Dec Mon Tue Wed Thu Fri Sat Sun
Winter Summer Fall Capacity Index (% of peak day) TRASM
MSP to warm leisure MSP to VFR(2) MSP to VFR(2)
Midwest origination MSP to leisure Big cities to LAS
Hawaii Holiday scheduling
Southern big city to
Mexico/Caribbean
• Based on FY2019 data.
• Visiting Friends and Relatives.
6
Sun Country Route Network
                       Current Passenger Leisure Operations

 97% of our markets are seasonal which reflects demand trends of our customer
                                                                                7
Superior Passenger Product Offering
                                                                                                                                       Average Revenue per Passenger(1)
                                                                                                                                            $155.49
                                                                                                                            $144.22
                                                                                                                                                             $134.12                        2019

                                                                                                                                                                             $118.26
                                                                                                                                                                                                 $110.91       $109.91

     Weighted Average Seat
                                                                             Seat Recline
           Pitch: 31"

     In-Flight Entertainment                                               In-Seat Power
                                                                                                                              2019            2020           Q1 LTM         Allegiant - Spirit - 2019 Frontier -
                                                                                                                                                              2021             2019                     2019

 1 - Sun Country revenue/passenger = average base fare + ancillary revenue per passenger, Allegiant is average fare – total, Spirit is total revenue per passenger flight segment, Frontier is
 total revenue per passenger

                                                                                                                                                                                                           8
Leading Charter Business
                            Overview                                                        Charter Revenue
                                                                                                 Millions - USD
•   Contract based business – provides recurring revenues
                                                                                   $174.6
•   Pass-through economics – fuel and other costs paid                   $152.0

    by customer (i.e., no fuel risk)
                                                                                              $98.1        $94.7
•   High growth and high margin
                                                                                                                    $29.2     $25.8
•   Largely insulated from economic cycles

        •   Casino, VIP and Tour flying under multi-year contracts        2018      2019      2020         Q1 LTM   Q1 2020   Q1 2021
                                                                                                            2021
        •   Other large customer groups are U.S. military and NCAA
            sports teams that typically fly during all economic cycles            Charter Revenue per Block Hour
                                                                         $8,767    $8,793
•   Market leader in narrow body charter market
                                                                                             $8,101        $8,004   $8,092
                                                                                                                              $7,747
•   Only U.S. passenger airline with a meaningful charter
    business

•   Complements passenger leisure and cargo operations

•   Scheduled seamlessly with passenger business
                                                                          2018      2019      2020         Q1 LTM   Q1 2020   Q1 2021
                                                                                                            2021

                                                                                                                                        9
Stable Cargo Business
                   Long-term contract is a source of significant, stable cash flow

• 12 Boeing 737-800 converted freighter aircraft operated on behalf of Amazon

     • Increased from original plan of 10 aircraft

• 10 year contract, initial term six years and two additional, two-year extension options

• Partnership with one of the fastest growing companies globally

• Only ULCC with a meaningful cargo business

• Complements passenger leisure and charter operations

                                                                                            10
Positioned
to Grow
through the
Recovery
11Leisure Typically Rebounds First After Economic
Declines
Leisure travel is more resilient than business travel; low cost carriers outperform network carriers
during economic recessions
Our Focus Positions Us Well for Recovery Leisure vs. Business Travel in the U.S.
• Sun Country’s low costs and leisure focus position us 6%
well to recover earlier than most carriers
(0%)
• Virtually All Leisure / VFR
• Historically, lower-fare leisure / VFR travel is (6%)
the first to come back after an economic
downturn (12%)
• Domestic Focus (18%)
Q1 Q2 Q3 Q4 Q1 Q2 Q3 Q4 Q1 Q2 Q3 Q4 Q1 Q2 Q3 Q4 Q1 Q2 Q3 Q4
• With zero exposure to transatlantic and 08 08 08 08 09 09 09 09 10 10 10 10 11 11 11 11 12 12 12 12
transpacific flights, Sun Country is sheltered Leisure Trips Business Trips
from many travel restrictions in Passenger
Leisure
2007 – 2009 Financial Performance | EBITDAR Margin(1)(2)(3)
• Flexible Operations
30% 29%
• Sun Country’s nimble operations should allow
us to adapt to the quickly changing
environment throughout the recovery 20%
19%
18% 18%
17%
12% 12%
10% 7%
3%
0%
ULCCs LCC / Hybrids Legacy
2007 2008 2009
Source: Oxford Economics & IHS Global Insight, Company filings.
1. ULCCs consists of Allegiant and Spirit.
2. LCC / Hybrids consists of Southwest, JetBlue, Alaska Airlines and Hawaiian Airlines.
3. Legacy consists of Delta, American Airlines and United Airlines. 12Poised for Rebound After COVID and Beyond
Near Term Revenue Growth Potential Growth Beyond the Rebound
($mm)
$788
Virtually all leisure / VFR
$701 86 86
Charter 2019 vs 18:
$582 175
15%
175 Growth at MSP and beyond
152
Passenger Leisure Revenue Initiatives
527 Passenger 2019 vs 18: 527
22%
430
Secular e-commerce trends in cargo
U.S. Passenger
Industry YoY: 6%
2018 2019 2019 +
Amazon Q1 21
Annualized Charter growth
Passenger Leisure Charter Cargo Q1 21 Annualized(1)
Our leisure / VFR focus coupled with our charter and cargo businesses
positions us to best capture rebound growth potential after COVID and beyond
Note: Other revenue included in Passenger Leisure. 13
1. Sun Country’s 2019 revenue ($701mm) plus Cargo Q1 21 Revenue Annualized ($21.6mm * 4, or $86mm).Fleet Plan: Responsible Growth
With no aircraft order book and experience purchasing mid-life aircraft, Sun Country can
opportunistically acquire aircraft that make economic sense
• 3 incremental aircraft commitments in Q1 21 with on going discussions for more
Aircraft in Service Strategy in Place to Support Fleet Growth
(# of aircraft)
50 aircraft target by YE 2023
65
• Restructured fleet with a focus on ownership
62
No MAX Exposure of Boeing 737-800s and no planned lease
60 redeliveries prior to 2024
55 • Allows focus on growth with low capital
50 commitments
50
• Focus on the 737-800 – the LCC stalwart for
45 43
airlines such as Southwest and Ryanair
40
Expect to acquire 19 • COVID creates unique opportunities to
35 aircraft by end of acquire mid-life aircraft at even cheaper rates
31
2023
30 • Sun Country maintains no order book and
acquires aircraft based on demand needs
25
Dec-19
Dec-20
Dec-21
Dec-22
Dec-23
Jun-20
Jun-21
Jun-22
Jun-23
Passenger Passenger + Cargo
No order book is a huge advantage vs. our competitors that are
locked into expensive pre-COVID aircraft prices
14Finding the Sweet Spot
Revenue per Aircraft Versus Utilization
$30 ULCC-2019
$28 SNCY-2019
SAVE-2019
Revenue per aircraft – millions USD
Margin* 24.4%
$26
$24
$22 ALGT-2019
$20
$18
$16
$14 SNCY-2020
$12 Margin* 9.7%
$10
4.0 5.0 6.0 7.0 8.0 9.0 10.0 11.0 12.0 13.0
Daily utilization – hours per day
• Lower fixed costs allow for lower utilization
• Takes advantage of seasonal nature of leisure passenger
• Do not need to fly a lot to have low costs and higher margins
• Revenue shown above does not include cargo revenue
• LTM cargo revenue was $58.4m. Business started in May 2020
Revenue per aircraft comparable to higher utilization ULCC peers
Note: SNCY – 2019 & SNCY – 2020 are Sun Country results for 2019 and 2020. ALGT – Allegiant results for 2019, ULCC – Frontier results for 2019, SAVE – Spirit results for 2019
15
* - Margin represents Adjusted EBITAR margin. See reconciliation tables in appendix for more detailsFinancial Results
Sun Country achieved a record year in 2019 as a result of the holistic business transformation
Total Revenue Adjusted EBITDAR
($mm) ($mm)
$701.4
$171.1
$559.7 $582.4
$107.0
$401.5
$38.9
2017 2018 2019 2020 2018 2019 2020
Adjusted Pre-tax Adjusted Net Income
($mm) ($mm) $53.7
$70.1
$20.3
$18.8
($61.8)
($47.9)
2018 2019 2020 2018 2019 2020
Our record financial results in 2019 do not reflect the contribution from our cargo business,
which provides additional growth with high margins and cash flows to Sun Country
Note: See Appendix for more information on how we define Adjusted EBITDAR, Pre-tax income and Net Income and for reconciliations of Adjusted EBITDAR, Pre-tax Income and Net Income to the most comparable GAAP metric. 16Strongest Q1 2021 Results in
Industry
Q1 2021 Commentary Q1 Financial Results
$ in millions Q1 2021 Q1 2020 Var %
• Only carrier with positive Adjusted EBITDAR
Passenger $104.2 $178.5 (41.6)
and Adjusted Operating Income
Cargo 21.6 - NM
• 29.2% decline in operating revenue due to Other 1.8 1.8 0
COVID-19 demand reduction for scheduled Operating Revenue 127.6 180.3 (29.2)
service
Aircraft Fuel 24.3 55.6 (56.3)
• Cargo services launched in May 2020 with 12
aircraft flying in Q1 2021 Salaries, Wages, and Benefits 44.1 38.1 15.7
Remaining 34.3 71.4 (51.8)
• Decreasing aircraft ownership with shift in Total Operating Expenses 102.7 165.1 (37.8)
aircraft fleet composition from operating
leases to owned aircraft Operating Income 24.9 15.2 63.8
• Since the beginning of March 2021, demand Adjusted Operating Income 1.2 15.6 (92.3)
trends have been improving Adj. Op Income Margin 0.9% 8.7% (7.7) pts
Adjusted EBITDAR 19.4 37.1 (47.7)
Adj. EBITDAR Margin 15.2% 20.6% (5.4) pts
Net Income (Loss) 12.4 7.3 69.9
Adjusted Net Income (Loss) ($4.9) $7.6 (164.5)
Adjusted Net Income Margin (3.8%) 4.2% (8.1) pts
Adjusted Earnings Per Share ($0.09) $0.16 (159.2)
Note: See Appendix for more information on how we define Adjusted EBITDAR, Operating Income and Net Income and for reconciliations of Adjusted EBITDAR, Operating Income and Net Income to the most comparable GAAP metric
Other airlines may calculate Adjusted EBITDAR and Adjusted Operating Income differently than Sun Country
17In Summary…
Resilient and Diverse Business Model
Low Cost Capital Light Operations
Outperformance in Difficult Environments
Well Positioned for High Growth in Rebound
Poised for Long-Term Growth Beyond the Rebound
18Appendix
19Seasoned Management Team with Decades of
Experience
Sun Country has a seasoned management team with decades of experience at some of the world’s largest and most
successful airlines; virtually the entire management team is new since 2017
Jude Bricker Dave Davis Greg Mays Grant Whitney
CEO, Board Member President & CFO, Board Member COO Chief Revenue Officer
Aviation Experience: 16 years Aviation Experience: 22 years Aviation Experience: 29 years Aviation Experience: 20 years
Joined Sun Country: 2017 Joined Sun Country: 2018 Joined Sun Country: 2019 Joined Sun Country: 2019
Eric Levenhagen Jeff Mader Brian Davis Dee Powers
Chief Administrative Officer,
Chief Information Officer Chief Marketing Officer VP Human Resources
General Counsel
Aviation Experience: 11 years Aviation Experience: 2 years Aviation Experience: 16 years Aviation Experience: 43 years
Joined Sun Country: 2016 Joined Sun Country: 2018 Joined Sun Country: 2018 Joined Sun Country: 2017Description of Special Items
Special Items, Net – in millions USD
Q1 LTM
FY 2018 FY 2019 FY 2020 2020 Q1 2020 Q1 2021
CARES Act grant recognition $0.0 $0.0 ($62.3) ($94.5) $0.0 ($32.2)
CARES Act employee retention credit - - (2.3) (2.7) - (0.3)
Contractual obligations for retired technology - 7.6 - - - -
Sale of airport slot rights - (1.2) - - - -
Sun Country Rewards program modifications (8.5) - - - - -
Early-out payments and other outsourcing expenses 2.0 - - - - -
Aircraft purchases impacts - - - 5.7 - 5.7
Other - 0.7 0.1 0.1 - -
Total Special Items, net ($6.4) $7.1 ($64.6) ($91.4) $0.0 (26.9)Non-GAAP Reconciliation – Adjusted EBITDAR
Adjusted Earnings Before Interest, Taxes, Depreciation & Amortization and Aircraft Rent (“EBITDAR”) is included as a supplemental
disclosure because we believe it is a useful indicator of our operating performance. Adjusted EBITDAR is a well recognized performance
measurement in the airline industry that is frequently used by our management, as well as by investors, securities analysts and other
interested parties in comparing the operating performance of companies in our industry.
Adjusted EBITDAR Reconciliation – in millions USD
FY 2018 FY 2019 FY 2020 Q1 LTM 2020 Q1 2020 Q1 2021
Net income (loss) $25.5 $46.1 ($3.9) $1.3 $7.3 $12.4
Special items, net (1) (6.4) 7.1 (64.6) (91.4) - (26.9)
Interest expense 6.4 17.2 22.1 23.6 5.6 7.1
Stock compensation expense 0.4 1.9 2.1 4.6 0.4 2.9
Loss (gain) on asset transactions, net (0.8) 0.7 0.4 0.3 0.1 -
Other adjustments (2) - 0.2 4.9 5.1 - 0.3
Interest income (0.4) (0.9) (0.4) (0.1) (0.3) -
Provision for income taxes 0.2 14.1 (0.8) 2.2 2.4 5.4
Depreciation and amortization 16.9 34.9 48.1 50.2 10.5 12.6
Aircraft rent 65.2 49.9 31.0 25.6 11.0 5.6
Adjusted EBITDAR 107.0 171.1 38.9 21.3 37.1 19.4
Adjusted EBITDAR margin 18.4% 24.4% 9.7% 6.1% 20.6% 15.2%
Adjusted EBITDA 41.8 121.2 7.9 (4.3) 26.0 13.8
Adjusted EBITDA margin 7.2% 17.3% 2.0% (1.2%) 14.4% 10.8%
Total revenue $582.4 $701.4 $401.5 $348.8 $180.3 $127.6
1. See Description of Special Items table in this Appendix.
2. Other adjustments for FY 2020 include expenses related to a voluntary employee leave program in response to the COVID-19 pandemic, a portion of which is offset by the CARES Act Payroll Support
Program as the benefit of this program is also adjusted as a component of special items. Other adjustments for FY 2019 include expenses incurred in terminating work on a planned new crew base. Other
adjustment for Q1 2021 and Q1 LTM 2020 represents the one-time costs to establish the Tax Receivable Agreement with our pre-IPO stockholdersNon-GAAP Reconciliation – Adjusted Operating
Income
Adjusted Operating Income is included as a supplemental disclosure because we believe it is a useful indicator of our operating
performance. Adjusted Operating Income is a well recognized performance measurement in the airline industry that is frequently used by
our management, as well as by investors, securities analysts and other interested parties in comparing the operating performance of
companies in our industry.
Adjusted Operating Income Reconciliation – in millions USD
FY 2019 FY 2020 Q1 2020 Q1 2021
Operating Income $78.1 $17.4 $15.2 $24.9
Special items, net(1) - - - (26.9)
Stock compensation expense 1.9 2.1 0.4 2.9
Employee relocation and costs to exit Sun Country’s prior headquarters building and 0.7 0.1 - -
base closures
Contractual obligations for retired technology 7.6 - - -
Sale of airport slot rights (1.2) - - -
Other adjustments 0.2 - - 0.3
Adjusted operating income 87.3 19.6 15.6 1.2
Total revenue $701.4 $401.5 $180.3 $127.6
Adjusted operating income margin 12.5% 4.9% 8.7% 0.9%
1 - See Description of Special Items table in this Appendix.Non-GAAP Reconciliation – Adjusted Pre-tax Income
Adjusted Pre-tax Income is included as a supplemental disclosure because we believe it is a useful indicator of our operating
performance. Adjusted Pre-tax Income is a well recognized performance measurement in the airline industry that is frequently used by
our management, as well as by investors, securities analysts and other interested parties in comparing the operating performance of
companies in our industry.
Adjusted Pre-tax Income Reconciliation – in millions USD
FY 2018 FY 2019 FY 2020 Q1 2020 Q1 2021
Pre-tax income (loss) $25.7 $60.2 ($4.7) $9.7 $17.8
Special items, net (6.4) 7.1 (64.6) - (26.9)
Stock compensation expense 0.4 1.9 2.1 0.4 2.9
Loss (gain) on asset transactions, net (0.8) 0.7 0.4 0.1 -
Early pay-off of US Treasury loan - - - - 0.8
Loss on refinancing credit facility - - - - 0.4
Other adjustments - 0.2 4.9 - 0.3
Adjusted Pre-tax income (loss) $18.9 $70.1 ($61.9) $10.2 ($4.7)
1 - See Description of Special Items table in this Appendix.Non-GAAP Reconciliation – Adjusted Net Income
Adjusted Net Income is included as a supplemental disclosure because we believe it is a useful indicator of our operating performance.
Adjusted Net Income is a well recognized performance measurement in the airline industry that is frequently used by our management,
as well as by investors, securities analysts and other interested parties in comparing the operating performance of companies in our
industry.
Adjusted Net Income Reconciliation – in millions USD
FY 2018 FY 2019 FY 2020 Q1 2020 Q1 2021
Net income (loss) $25.5 $46.1 ($3.9) $7.3 $12.4
Special items, net (6.4) 7.1 (64.6) - (26.9)
Stock compensation expense 0.4 1.9 2.1 0.4 2.9
Loss (gain) on asset transactions, net (0.8) 0.7 0.4 0.1 -
Early pay-off of US Treasury loan - - - - 0.8
Loss on refinancing credit facility - - - - 0.4
Other adjustments - 0.2 4.9 - 0.3
Income tax effect of adjusting items, net 1.6 (2.3) 13.1 (0.1) 5.2
Adjusted net income (loss) $20.3 $53.7 ($47.9) $7.6 ($4.9)
1 - See Description of Special Items table in this Appendix.Non-GAAP Reconciliation – Adjusted CASM
Adjusted CASM, which is a non-GAAP financial measure, is also a key airline cost metric and excludes fuel costs, costs related to our
freighter operations (starting in 2020 when we launched our freighter operation), certain commissions and other costs of selling our
vacations product from this measure as these costs are unrelated to our airline operations and improve comparability to our peers.
Adjusted CASM is one of the most important measures used by management and by our board of directors in assessing quarterly and
annual cost performance. Adjusted CASM is also a measure commonly used by industry analysts and we believe it is an important metric
by which they compare our airline to others in the industry, although other airlines may exclude certain other costs in their calculation of
Adjusted CASM.
Adjusted CASM Reconciliation – in millions USD, except for ASMs and Adjusted CASM
FY 2017 FY 2018 FY 2019 FY 2020 Q1 2020 Q1 2021
Operating expense – as reported $530.0 $549.0 $623.3 $384.1 $165.1 102.7
Aircraft fuel (118.4) (165.3) (165.7) (83.4) (55.6) (24.3)
Cargo expenses, not already adjusted - - - (31.4) - (17.2)
Sun Country Vacations (2.1) (4.5) (2.4) (0.6) (0.2) (0.2)
Special items, net - 6.4 (7.1) 64.6 - 26.9
Stock compensation expense - (0.4) (1.9) (2.1) (0.4) (2.9)
Other adjustments - - (0.2) (4.9) - (0.3)
Adjusted operating expense $409.5 $385.2 $445.9 $326.3 $109.0 $84.7
Available seat miles (ASMs) – millions 5,250.5 5,463.2 7,064.6 4,311.1 1,757.1 1,376.8
Adjusted CASM - cents 7.80 7.05 6.31 7.57 6.20 6.15
1 - See Description of Special Items table in this Appendix.You can also read