Supplementary Online Content
←
→
Page content transcription
If your browser does not render page correctly, please read the page content below
Supplementary Online Content

 The J-David Investigators. Prospective, randomized, open-label, blinded-endpoint trial to examine
 the effect of active vitamin D on cardiovascular events in hemodialysis patients: Japan Dialysis
 Active Vitamin D trial (J-DAVID). JAMA. doi:10.1001/jama.2018.17749

 Supplement 3. eTable 1. Eligibility criteria
 eTable 2. Definitions of cardiovascular events
 eTable 3. Sample size calculation
 eTable 4. Predefined laboratory abnormalities
 eTable 5. Blood pressure measurements during follow-up
 eTable 6. List of the J-DAVID Investigators
 eFigure 1. Definitions of three populations for analysis
 eFigure 2. Changes in laboratory data and medications
 eFigure 3. Adherence to the assigned treatments
 eFigure 4. Study organization of J-DAVID trial

 This supplementary material has been provided by the authors to give readers additional
 information about their work.

 © 2018 American Medical Association. All rights reserved.

Downloaded From: https://jamanetwork.com/ on 09/27/2020
Effect of oral alfacalcidol on clinical outcomes in patients without secondary
 hyperparathyroidism receiving maintenance hemodialysis: the J-DAVID randomized
 clinical trial

 Online-only material

 Table of Contents
 Page 2 eTable 1 Eligibility criteria
 Page 3 eTable 2 Definitions of cardiovascular events
 Page 4 eTable 3 Sample size calculation
 Page 5 eTable 4 Predefined laboratory abnormalities
 Page 6 eTable 5 Blood pressure measurements during follow-up
 Page 7-9 eTable 6 List of the J-DAVID Investigators
 Page 10 eFigure 1 Definitions of three populations for analysis
 Page 11 eFigure 2 Changes in laboratory data and medications
 Page 12 eFigure 3 Adherence to the assigned treatments
 Page 13 eFigure 2 Study organization of J-DAVID trial

 © 2018 American Medical Association. All rights reserved.

Downloaded From: https://jamanetwork.com/ on 09/27/2020
eTable 1. Eligibility criteria
 Inclusion criteria
 1. Signed informed consent
 2. Patients on maintenance hemodialysis for 90 days or longer
 3. Men or women aged >20 and
eTable 2. Definitions of cardiovascular events
 Acute myocardial infarction:
 Clinical signs and symptoms such as chest pain or cardiogenic shock, associated with
 abnormalities in biomarkers (creatine kinase, troponin, etc.) and/or electric cardiogram
 (new abnormal Q-wave, ST elevation, etc.) for myocardial infarction.
 Congestive heart failure:
 Congestive heart failure (NYHA grade III or IV) requiring hospitalization, excluding
 dyspnea due to non-cardiac causes (bronchial asthma, etc.)
 Stroke:
 Rapidly developing clinical signs of neurological deficit attributable to a focal and/or total
 brain functions, without clear causes than vascular origin, lasting for more than 24 hours or
 leading to death (if not interrupted by surgical operations or death). Stroke includes
 subarachnoidal hemorrhage, intracranial hemorrhage, and cerebral infarction, but excludes
 transient ischemic attack, cerebrovascular disease due to hematological disorders
 (leukemia, polycytemia vera, etc.), primary brain tumors, and metastatic brain tumors.
 Stroke secondary to trauma is also excluded.
 Aortic dissection/rupture:
 Clinical symptom of chest pain and/or abdominal pain, and diagnosed with imaging test
 such as contrast enhanced computed tomography.
 Amputation of ischemic limb:
 Major amputations at ankle joint or proximal as treatment for patients with symptom and/or
 signs of lower extremity ischemia.
 Cardiac sudden death:
 Unexpected death from a cardiac cause that occurs within one hour of symptom onset
 (witnessed) or within 24 hours of last being observed in normal health (unwitnessed).

 © 2018 American Medical Association. All rights reserved.

Downloaded From: https://jamanetwork.com/ on 09/27/2020
eTable 3. Sample size calculation
 The equation we used 2
 /2 �2 + � 1 1 + 2 2
 n ≒� �
 2 − 1
 where
 - P1 and P2 are proportion of patients with outcome in group 1 and group 2,
 respectively.
 - P = (P1 +P2)/2
 - Q1 = 1 – P1, Q2 =1–P2, Q=1–P
 - Zα/2 and Zß are percent points of normal distribution
 - Zα/2=Z0.05/25=1.9600, Zß=Z0.20=0.8416
 Initial calculation Assumptions:
 - P1 = 0.32 for 4-year follow-up
 - P2 = 0.32 x 0.8 (20% reduction by treatment)
 - α = 0.05, ß = 0.20
 Then, n = 785 in one group, 1570 in two groups.
 30 of loss to follow up were considered.
 Finally, the target sample size of 1600 in total was determined.
 Second calculation Assumptions;
 - P1 = 0.28 for 4-year follow-up
 - P2 = 0.28 x 0.7 (30% reduction by treatment)
 - α = 0.05, ß = 0.20
 Then, n = 461 in one group, 922 in two groups.
 Loss to follow-up was assumed to be 5%.
 Then, 971 participants in total will be needed.
 Finally, the target sample size of 972 in total (486 for each group) was
 determined.
 Estimation of CVD Estimation based on statistics of mortality;
 risk in the control - The proportion of patients who die in one year is approximately 9% in
 group Japan (Ref #1).
 - The number of composite cardiovascular events is larger than the number
 of all-cause mortality in cohorts of Japanese hemodialysis patients (Ref
 #2).
 - Then, the number of patients who experience cardiovascular events can be
 estimated approximately 9% per year or 36% in 4 years.
 Estimation based on statistics of incident cardiovascular disease;
 - Incidence of a composite of acute myocardial infarction and stroke was
 approximately 4.2% per year in Japan in patients undergoing hemodialysis
 without prior cardiovascular disease (Ref #3). This number does not
 include the numbers of coronary interventions before myocardial
 infarction, amputation of lower limbs, aortic dissection, or congestive
 heart failure requiring hospitalization.
 - The risk should be higher in those with prior cardiovascular disease.
 - We estimated the proportion of patients who experience a composite of
 cardiovascular disease to be in the range of 7 – 9% in a year, or 28 – 36%
 in 4 years.
 Estimation of treatment In cohort studies of patients undergoing hemodialysis, use of VDRA was
 effect associated with; lower risk of all-cause mortality with hazard ratios in the
 range of 0.55–0.75 (References #4, 5); CVD death with hazard ratio in the range
 of 0.38–0.58 (References #6); and incident CVD with odds ratio in the range of
 0.74–0.87 (References #7).
 References 1. Shinzato T, et al. Nephrol Dial Transplant. 1997; 12(5): 889-898.
 2. Shoji T, et al. Am J Kidney Dis 2013; 62(3): 568-576.
 3. Shoji T, et al. Clin J Am Soc Nephrol 2011; 6(5): 1112-1120.
 4. Teng M, et al. J Am Soc Nephrol. 2005;16(4): 1115-1125
 5. Naves-Diaz M, et al. Kidney Int. 2008;74(8): 1070-1078
 6. Shoji T, et al. Nephrol Dial Transplant. 2004;19(1): 179-184

 © 2018 American Medical Association. All rights reserved.

Downloaded From: https://jamanetwork.com/ on 09/27/2020
7. Shoji T, et al. Ther Apher Dial. 2015 Jun; 19(3): 235-244

 © 2018 American Medical Association. All rights reserved.

Downloaded From: https://jamanetwork.com/ on 09/27/2020
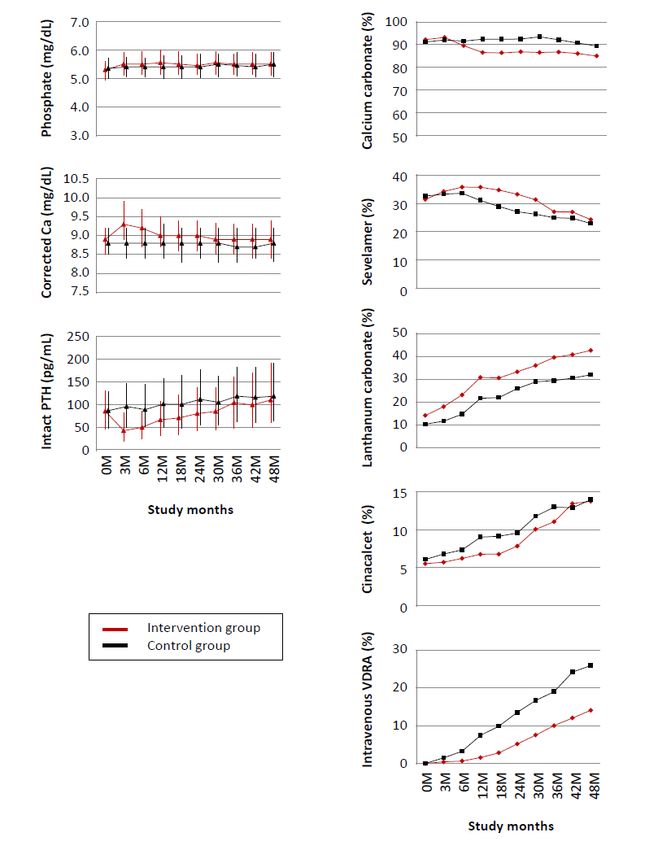
eTable 4. Predefined laboratory abnormalities
 Measurement Group Abnormalities 0M 3M 6M 12M 18M 24M 30M 36M 42M 48M
 Number of Intervention 472 466 444 428 408 387 370 349 334
 participants

 Control 476 469 462 442 426 407 390 369 356 336
 Corrected Intervention Number of reported values 488 471 464 443 422 407 386 369 349 334
 Calcium > 10.0 mg/dL 17 136 105 72 52 45 46 37 39 33
 (3.5%) (28.9%) (22.6%) (16.3%) (12.3%) (11.1%) (11.9%) (10.0%) (11.2%) (9.9%)
 > 11.0 mg/dL 0 25 17 9 8 3 2 6 5 2
 (0.0%) (5.3%) (3.7%) (2.0%) (1.9%) (0.7%) (0.5%) (1.6%) (1.4%) (0.6%)
 Control Number of reported values 476 467 459 439 422 403 389 367 356 332
 > 10.0 mg/dL 21 30 25 36 41 29 40 29 34 22
 (4.4%) (6.4%) (5.4%) (8.2%) (9.7%) (7.2%) (10.3%) (7.9%) (9.6%) (6.6%)
 > 11.0 mg/dL 0 4 4 2 3 4 2 2 3 2
 (0.0%) (0.9%) (0.9%) (0.5%) (0.7%) (1.0%) (0.5%) (0.5%) (0.8%) (0.6%)
 Phosphate Intervention Number of reported values 488 471 464 443 422 407 386 369 349 334
 > 6 mg/dL 0 88 91 101 84 73 85 65 62 64
 (0.0%) (18.7%) (19.6%) (22.8%) (19.9%) (17.9%) (22.0%) (17.6%) (17.8%) (19.2%)
 > 7 mg/dL 0 32 28 25 28 20 22 20 15 22
 (0.0%) (6.8%) (6.0%) (5.6%) (6.6%) (4.9%) (5.7%) (5.4%) (4.3%) (6.6%)
 Control Number of reported values 476 467 459 439 422 403 389 367 356 332
 > 6 mg/dL 0 67 57 69 5 70 64 74 63 68
 (0.0%) (14.3%) (12.4%) (15.7%) (14.0%) (17.4%) (16.5%) (20.2%) (17.7%) (20.5%)
 > 7 mg/dL 0 14 11 27 20 20 19 20 15 19
 (0.0%) (3.0%) (2.4%) (6.2%) (4.7%) (5.0%) (4.9%) (5.4%) (4.2%) (5.7%)
 Intact PTH Intervention Number of reported values 488 427 421 402 386 377 356 337 323 314
 > 240 pg/mL 0 3 7 8 17 16 23 34 35 45
 (0.0%) (0.7%) (1.7%) (2.0%) (4.4%) (4.2%) (6.5%) (10.1%) (10.8%) (14.3%)
 > 500 pg/mL 0 0 0 0 1 1 2 1 1 3
 (0.0%) (0.0%) (0.0%) (0.0%) (0.3%) (0.3%) (0.6%) (0.3%) (0.3%) (1.0%)
 Control Number of reported values 476 432 422 404 391 381 366 344 336 313
 > 240 pg/mL 0 19 19 33 37 46 46 4 41 43
 (0.0%) (4.4%) (4.5%) (8.2%) (9.5%) (12.1%) (12.6%) (12.5%) (12.2%) (13.7%)
 > 500 pg/mL 0 0 0 0 0 3 0 1 1 0
 (0.0%) (0.0%) (0.0%) (0.0%) (0.0%) (0.8%) (0.0%) (0.3%) (0.3%) (0.0%)
 Because of lacking data, the table gives the total number of participants, the number of reported values, the number of abnormal values, and the percentage of abnormal values
 out of the reported values across the visits by the treatment group.

 © 2018 American Medical Association. All rights reserved.

Downloaded From: https://jamanetwork.com/ on 09/27/2020
eTable 5. Blood pressure measurements during follow-up
 Visit 0M 3M 6M 12M 18M 24M 30M 36M 42M 48M
 Intervention Number of participants 495 488 471 465 443 427 407 387 370 349
 group SBP N of measured values 488 469 462 440 422 403 384 365 347 332
 25th percentile (mmHg) 130 134 131 134 132 133 131 132 130 133
 Median (mmHg) 145 149 146 148 147 146 147 148 146 147
 75th percentile (mmHg) 160 164 160 162 160 160 161 164 163 160
 DBP N of measured 486 467 460 437 421 402 383 364 347 332
 25th percentile (mmHg) 67 70 67 70 67 68 66 67 66 67
 Median (mmHg) 74 76 75 78 74 76 76 77 75 76
 75th percentile (mmHg) 82 84 84 84 83 86 85 85 85 84
 Control Number of participants 481 476 469 462 442 426 407 390 369 356
 group SBP N of measured values 476 467 459 435 415 397 384 363 349 326
 25th percentile (mmHg) 134 132 131 132 130 132 130 132 132 132
 Median (mmHg) 148 147 144 148 144 147 146 147 145 148
 75th percentile (mmHg) 160 162 159 164 159 160 160 161 160 165
 DBP N of measured values 475 466 458 433 415 397 383 363 349 325
 25th percentile (mmHg) 68 68 66 68 66 66 66 67 66 68
 Median (mmHg) 74 75 74 76 73 74 73 75 75 75
 75th percentile (mmHg) 83 84 81 84 82 84 83 84 83 85
 This table gives the numbers of participants, the number of participants with measured values, and the median, 25th and 75th percentiles levels of SBP and DBP at
 each visit for each group.
 Abbreviations: N, number; SBP, systolic blood pressure; DBP, diastolic blood pressure.

 © 2018 American Medical Association. All rights reserved.

Downloaded From: https://jamanetwork.com/ on 09/27/2020
eTable 6. List of the J-DAVID Investigators
 Steering Committee:
 Tetsuo Shoji* (Osaka City University, Osaka), Masaaki Inaba (Osaka City University, Osaka), and
 Yoshiki Nishizawa (Osaka City University, Osaka)
 *Principal investigator

 Executive Committee:
 Tadao Akizawa (Showa University School of Medicine, Tokyo), Ryoichi Ando (Japanese Red Cross
 Musashino Hospital, Tokyo), Masanori Emoto (Osaka City University, Osaka), Rieko Eriguchi
 (Fukuoka Renal Clinic, Fukuoka), Akira Fujimori (Konan Hospital, Hyogo), Masafumi Fukagawa
 (Tokai University, Kanagawa), Tetsuya Hashimoto (Tojinkai Hospital, Kyoto), Hideki Hirakata
 (Japanese Red Cross Fukuoka Hospital, Fukuoka), Hirokazu Honda (Showa University, Tokyo),
 Tatsuo Hosoya (Jikeikai University School of Medicine, Tokyo), Daijo Inaguma (Japanese Red
 Cross Nagoya Daini Hospital, Aichi), Toru Inoue (Higasikouri Hospital, Osaka), Yoshitaka Isaka
 (Osaka University Graduate School of Medicine, Osaka), Kunitoshi Iseki (University Hospital of
 the Ryukyus, Okinawa), Mari Ishida (Tokai University Hachioji Hospital, Tokyo), Eiji Ishimura
 (Osaka City University, Osaka), Noritomo Itami (Nikko Kinen Hospital, Hokkaido), Chiharu Ito
 (Haga Red Cross Hospital, Tochigi), Minoru Ito (Yabuki Clinic, Yamagata), Noriyuki Iwamoto
 (Tojinkai Hospital, Kyoto), Ryusuke Kakiya (Meijibashi Hospital, Osaka), Toshitaka Kakuta (Tokai
 University Hachioji Hospital, Tokyo), Toru Kawai (Chuou Naika Clinic, Hiroshima), Hideki
 Kawanishi (Tsuchiya General Hospital, Hiroshima), Shuzo Kobayashi (Shonan Kamakura General
 Hospital, Kanagawa), Kazutaka Kukita (Sapporo Hokuyu Hospital, Hokkaido), Junko Kumagai
 (Omachi Tsuchiya Clinic, Hiroshima), Eiji Kusano (JCHO Utsunomiya Hospital, Tochigi), Kiyoshi
 Maekawa (Fujiidera Shirasagi Clinic, Osaka), Ikuto Masakane (Yabuki Hospital, Yamagata), Hiroya
 Masaki (Kansai Medical University Takii Hospital, Osaka), Mikio Okamura (Kayashima Ikuno
 Hospital, Osaka), Jun Minakuchi (Kawashima Hospital, Tokushima), Koji Mitsuiki (Japanese Red
 Cross Fukuoka Hospital, Fukuoka), Takashi Mizukuchi (Kochi Takasu Hospital, Kochi), Satoshi
 Morimoto (Tokyo Women's Medical University, Tokyo), Yoshihiro Motomiya (Suiyukai Clinic,
 Nara), Takeshi Nakanishi (Hyogo College of Medicine, Hyogo), Tatsuya Nakatani (Osaka City
 University, Osaka), Tomohiko Naruse (Kasugai Municipal Hospital, Aichi), Shigeo Negi
 (Wakayama Medical University, Wakayama), Mitsushige Nishikawa (Kansai Medical University,
 Osaka), Kosaku Nitta (Tokyo Women's Medical University, Tokyo), Tetsuya Ogawa (Tokyo
 Women's Medical University Medical Center East, Tokyo), Seiji Ohira (Sapporo Kita Clinic,
 Hokkaido), Takayasu Ohtake (Shonan Kamakura General Hospital, Kanagawa), Senji Okuno
 (Shirasagi Hospital, Osaka), Toshihiko Ono (Tojinkai Hospital, Kyoto), Kazumichi Ota (Kochi
 Takasu Hospital, Kochi), Shigeru Otsubo (Sangenjaya Hospital, Tokyo), Toshinobu Sato (JCHO
 Sendai Hospital, Miyagi), Yuzuru Sato (Sato Junkankika Naika, Ehime), Takashi Shigematsu
 (Wakayama Medical University, Wakayama), Toshitsugu Sugimoto (Shimane University Faculty of
 Medicine, Shimane), Masashi Suzuki (Shinrakuen Hospital, Niigata), Tsutomu Tabata (Inoue
 Hospital, Osaka), Yoshio Taguma (JCHO Sendai Hospital, Miyagi), Hideki Tahara (Osaka City
 University, Osaka), Yoshiaki Takemoto (Osaka City University, Osaka), Kenji Tanaka (Suiyukai
 Clinic, Nara), Masaru Tanaka (Tanaka Kitanoda Hosipital, Osaka), Hideki Tanida (Yabuki Hospital,
 Yamagata), Masatomo Taniguchi (Kyushu University, Fukuoka), Yoshihiro Tominaga (Japanese
 Red Cross Nagoya Daini Hospital, Aichi), Yoshiharu Tsubakihara (Graduate School of Health Care
 Sciences, Jikei Insutitute, Osaka), Yoshihiro Tsujimoto (Inoue Hospital, Osaka), Kazuhiko Tsuruya
 (Graduate School of Medical Sciences, Kyushu University, Fukuoka), Yuzo Watanabe (Kasugai
 Municipal Hospital, Aichi), Kunihiro Yamagata (Faculty of Medicine, University of Tsukuba,
 Ibaraki), Tomoyuki Yamakawa (Shirasagi Hospital, Osaka), Shozo Yano (Shimane University,
 Shimane), Keigyou Yoh (University of Tsukuba, Ibaraki), Keitaro Yokoyama (Jikeikai University
 School of Medicine, Tokyo), Noriaki Yorioka (Hiroshima Kidney Organization, Hiroshima),
 Mitsuru Yoshimoto (Ohno Memorial Hospital, Osaka), and Kenji Yuasa (Kochi Takasu Hospital,
 Kochi).

 © 2018 American Medical Association. All rights reserved.

Downloaded From: https://jamanetwork.com/ on 09/27/2020
© 2018 American Medical Association. All rights reserved.

Downloaded From: https://jamanetwork.com/ on 09/27/2020
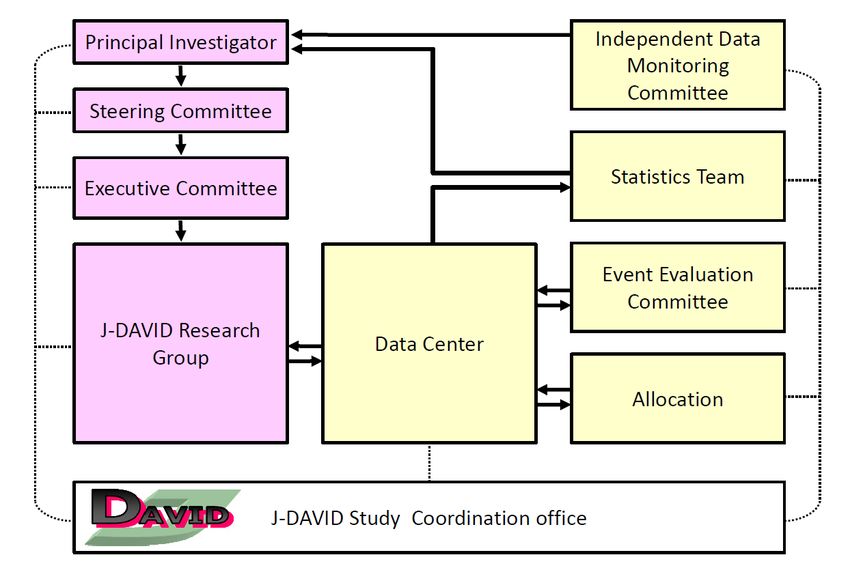
eTable 6. List of the J-DAVID Investigators (continued)
 Data Center:
 Yoshinobu Hirayama1) (Osaka City University, Osaka), Taisuke Hojo2) (Osaka City University,
 Osaka), Toshiyoshi Tominaga3) (Osaka City University, Osaka), Yuichi Kato 4) (Osaka City
 University, Osaka), Hisako Fujii5) (Osaka City University, Osaka)
 1) 2008-2010, 2) 2010-2012, 3) 2012-2014, 4) 2014-2017, 5) 2008-2017
 Statistical Team and Allocation:
 Mitsuru Fukui* (Osaka City University, Osaka)
 *Chief
 Event Evaluation Committee:
 Hiroki Hase* (Toho University, Tokyo), Minoru Yoshiyama (Osaka City University, Osaka), and
 Yuji Ikari (Tokai University School of Medicine, Kanagawa)
 *Chief
 Independent Data Monitoring Committee:
 Shinichiro Ueda* (University of the Rryukus, Okinawa), Toyoaki Murohara (Nagoya University,
 Aichi), Shinichi Nishi (Kobe University, Hyogo)
 *Chief
 Audit:
 Shinichiro Ueda* (University of the Rryukus, Okinawa), Toyoaki Murohara (Nagoya University,
 Aichi), Shinichi Nishi (Kobe University, Hyogo)
 *Chief
 J-DAVID Research Group:
 The following list indicates J-DAVID study sites by prefecture from which 1 or more participants
 were enrolled, excluding the institutions of the Executive Committee members.
 Aichi prefecture – Kazuhiro Fujisawa (Kasugai Central Clinic), Sumie Tawada (Kojukai Kasugai
 Hospital), Satoshi Yamaguchi (Seto Kyoritsu Clinic);
 Chiba prefecture – Yasuho Kimura (Shin Kashiwa Clinic);
 Fukushima prefecture – Hirofumi Nakano (Kashima Hospital);
 Fukuoka prefecture – Itsuko Ishida (Harasanshin Hospital Gofukumachi Jin Clinic), Tetsuo
 Komota (Komota Clinic), Dai Matsuo (Hirao Clinic), Hiroaki Takamura (Hara Hospital);
 Gunma prefecture – Kyoko Ito (Heisei Hidaka Clinic);
 Hokkaid prefecture – Nobuo Hashimoto (H・N・Medic), Hironori Ishida (Kitasaito Hospital),
 Yoshitomo Itami (Higashi Muroran Satellite Clinic), Hirofumi Kon (KKR Sapporo Medical Center),
 Fumiaki Kumagai (Tomakomai Nissho Hospital);
 Hyogo prefecture – Takuma Mabuchi (Tanaka Wadayama Clinic), Furuta Minoru (Aoi Hospital),
 Shiro Okajima (Tanaka Iin), Noriko Tanaka (Hojo Tanaka Hospital);
 Ibaraki prefecture – Takashi Ishizu (Tsukuba Central Hospital), Takashi Ishizu (Central Jin Clinic
 Ryugasaki), Hiroshi Kikuchi (Kikuchi Medical Clinic), Masakazu Otsuka (Tokiwa Clinic), Atsushi
 Ueda (Namegata District General Hospital);
 Kanagawa prefecture – Naoto Ishida (Seichi Clinic), Mikako Nagaoka (Honatsugi Medical
 Clinic), Ayaka Tanaka (Bousei Oone Clinic);
 Kochi prefecture – Yasukazu Sen (Kochi Takasu Hospital Aki Clinic);
 Kyoto prefecture – Naoto Adachi (Mabuchi Clinic), Masaki Koyama (Nishijin Hospital);
 Miyagi prefecture – Kosei Kurosawa (Izumi Kurosawa Clinic), Akira Yuza (Dainohara Internal
 Medicine Clinic);
 Oita prefecture – Kazuhiro Matsuyama (Matsuyama Iin Oita Nephrology Clinic), Makoto
 Matsuyama (Oita Nakamura Hospital);
 Okayama prefecture – Masaki Fukushima (Shigei Medical Research Hospital);
 Okinawa prefecture – Akira Higa (Shuri Jokamachi Clinic Daini), Kentaro Kohagura (University
 Hospital of the Ryukyus);

 © 2018 American Medical Association. All rights reserved.

Downloaded From: https://jamanetwork.com/ on 09/27/2020
eTable 6. List of the J-DAVID Investigators (continued)
 Osaka prefecture – Kaori Adachi (Kitatatsumi Shirasagi Clinic – Shirasagi Minami Clinic),
 Kiyoshi Goto (Ono Naika), Yuka Hosomi (Inoue Hospital), Noriko Kambara (Kanbara Hospital),
 Hironori Kawamura (Kawamura Clinic), Eiji Kimoto (Meijibashi Hospital), Satoshi Mikami
 (Higashikouri Hospital), Michiko Miura (Nagai Clinic), Harumi Nagayama (Nagayama Clinic),
 Koji Nakanishi (Nakanishi Clinic), Sei Nakatani (Ikuno Aiwa Hospital), Yasue Obi (Obi Clinic),
 Shigeki Okada (Okada Clinic), Mikio Okamura (Ohno Memorial Hospital), Nobuaki Okuda (Okuda
 Clinic), Senji Okuno (Shirasagi Clinic), Mayumi Sakurai (Jurakukai Clinic), Hidekazu Shimizu
 (Onoyama Clinic), Shigeichi Shoji (Shirasagi Hosipital), Kenzo Suzuki (Kadoma Clinic Aiwa
 Clinic), Akiko Tanaka (Tanaka Habikino Clinic), Keiko Tanaka (Kitahanada Clinic), Hitoshi
 Tanishita (Hanwa Memorial Hospital), Takeshi Wakikawa (Sakai Onshinkai Hospital), Ibuki Yajima
 (Ibuki Clinic), Yoshiaki Yamada (Arisawa General Hospital), Yasuo Yamakoshi (Ishikiriseiki
 Hospital), Shozo Yodoi (Yodoi Hospital), ;
 Shimane prefecture – Yasutoshi Himeno (Himeno Clinic), Kazushi Shigeno (Ohda Himeno
 Clinic), Keiko Suzuki (Otsuka Clinic);
 Tochigi prefecture – Ryuta Sato (Haga Red Cross Hospital);
 Tokushima prefecture – Kazuhiko Kawahara (Kamojima Kawashima Hospital);
 Tokyo prefecture – Hirokazu Honda (Ebara Clinic), Noritsugu Imamura (Minami-Tamachi Clinic),
 Naohiko Kato (Shinagawa Jin Clinic), Taku Morito (Towa Hospital), Seizo Murai (Iidabashi-Murai
 Iin), Shiori Osada (Tokyo Ayase Kidney Center), Jun Shiota (Kichijoji Asahi Hospital), Shinya
 Suganuma (Kidney Clinic Setagaya), Daijiro Uetake (Toyosu Kidney Dialysis Clinic), Ryo
 Yamamoto (Tateishi Jin Clinic);
 Wakayama prefecture – Akio Kaketaka (Kihoku Clinic), Toshihiro Kodama (Kinokawa Clinic),
 Naoya Kodama (Kisen KD Clinic), Kunio Koshimura (Kumanoji Clinic), Akefumi Maeda (Kodama
 Hospital), Sadako Tamai (Taniguchi Hospital), Takuji Ujita (Ujita Circulation Disease Clinic);
 Yamagata prefecture – Minoru Ito (Yabuki Hospital), Hideki Tanida (Tendo Onsen Yabuki Clinic).
 The members of Steering Committee, Executive Committee, Data Center, Statistical Team, Event
 Evaluation Committee, Independent Data Monitoring Committee, and Audit were collectively called
 “J-DAVID Investigators”. J-DAVID Research Group played roles in the recruitment and follow-up of
 participants. This trial was supported by many clinical research coordinators from the following site
 management organizations; Clinical Support Corporation (Tokyo), EP-Mint Co., Ltd. (Aichi), I’ROM
 Co., Ltd. (Tokyo), Medical Toyou Co., Ltd. (Kanagawa), Site Support Institute Co., Ltd. (Tokyo),
 Souken Co., Ltd. (Tokyo).

 © 2018 American Medical Association. All rights reserved.

Downloaded From: https://jamanetwork.com/ on 09/27/2020
eFigure 1. Definitions of three populations for analysis
 1) The full analysis set (FAS) consists of all participants who were randomized, and
 participants who ‘dropped-out’ from the assigned treatment are not censored at the time of
 ‘drop-out’.
 2) The per-protocol set (PPS) consists of all participants who were randomized, but
 participants (B and C in both arms) are censored at the time of ‘drop-out’ from the assigned
 treatment.
 3) The modified PPS consists of all participants who were randomized. In the control arm,
 participants (B and C)are censored at the time of ‘drop-out’ from the assigned treatment. In
 the intervention arm, participants who are censored at the time of ‘drop-out’ from the assigned
 treatment with oral alfacalcidol, if no VDRA was given in place of alfacalcidol (B).
 Participants in the intervention arm are not censored at the time of ‘drop-out’ from the
 assigned treatment with oral alfacalcidol, if the participants were kept treated with an oral or
 intravenous VDRA other than alfacalcidol (C); Such patients are censored at the time when
 any VDRA was not given continuously for more than 12 weeks.

 © 2018 American Medical Association. All rights reserved.

Downloaded From: https://jamanetwork.com/ on 09/27/2020
eFigure 2. Changes in laboratory data and medications
 Graphs indicate medians (interquartile ranges) for laboratory data and percentages for medication uses in each
 group. Please see eTable 4 for the number of participants and the number of reported laboratory values at each
 visit by treatment group. Data on use of the five medications was obtained for all participants. The numbers of
 participants at 0M, 3M, 6M, 12M, 18M, 24M, 30M, 36M, 42M, and 48M were 488, 471, 465, 443, 427, 407,
 387, 370, 349, and 334 for the intervention group; and 476, 469, 462, 442, 426, 407, 390, 369, 356, and 336 for
 the control group, respectively. These numbers are based on the visits, and different from number at risk after
 randomization.

 © 2018 American Medical Association. All rights reserved.

Downloaded From: https://jamanetwork.com/ on 09/27/2020
eFigure 3. Adherence to the assigned treatments
 The proportions of participants who kept receiving the assigned treatment in the two arms
 were plotted as a function of time after randomization by the Kaplan-Meier method. Drop-out
 from the assigned treatment was defined in the text.

 © 2018 American Medical Association. All rights reserved.

Downloaded From: https://jamanetwork.com/ on 09/27/2020
eFigure 4. Study organization of this trial

 © 2018 American Medical Association. All rights reserved.

Downloaded From: https://jamanetwork.com/ on 09/27/2020
You can also read