Tata Power Delhi Distribution Transforming Power Distribution in Delhi - DELHI POWER SECTOR REFORM - A POSITION PAPER
←
→
Page content transcription
If your browser does not render page correctly, please read the page content below

DELHI POWER SECTOR REFORM - A POSITION PAPER

   Tata Power Delhi Distribution
           Transforming Power
           Distribution in Delhi

                                               Page 1 of 12
DELHI POWER SECTOR REFORM - A POSITION PAPER

Tata Power Delhi Distribution is a joint venture between Tata Power and the
Government of NCT of Delhi with the majority stake and management control being
held by Tata Power (51%). The management control also lies with Tata Power.We
started operations on July 1, 2002 post the unbundling of the erstwhile Delhi Vidyut
Board (DVB).

We distribute electricity in North & North-West parts of Delhi and serve a populace of
over 60 lakhs. With a registered consumer base of approx. 14 lakhs and a peak load of
around 1573 MW, our operations span across an area of 510 sq kms.

Tata Power Delhi Distribution has been the frontrunner in implementing power
distribution reforms in the capital city and is acknowledged for its consumer friendly
practices. Since privatization, the Aggregate Technical & Commercial (AT&C) losses, a
measure of an overall efficiency of the distribution business which is the difference
between units input into the system and the units for which the payment is collected, in
our areas have shown a record decline. Today, in our area of operations AT&C losses
stand at 11% which is an unprecedented reduction of around 79% from an opening loss
level of 53% in July 2002.

Tata Power Delhi Distribution has won several accolades for its pioneering efforts in
transforming the power distribution scene in its licensed area both at the national and
international levels. It has been conferred with the ‘National Award for Meritorious
Performance’ four times by the Ministry of Power, Government of India for
outstanding performance in power distribution. It has also won six Asian Power Awards
in a row and holds a rare distinction of becoming the first power distribution utility from
India to have received the prestigious Edison Award twice, in the international
category in 2008 Edison Award and again in 2009 for Policy Advocacy. Tata Power
Delhi Distribution has been ranked 46th in the ‘India's Best Companies to Work for
2013 Survey’ and recognized as 2nd best in the “Best in Class – Energy, Oil and
Gas Industry by the Great Places to Work Institute, India.

                                                                               Page 2 of 12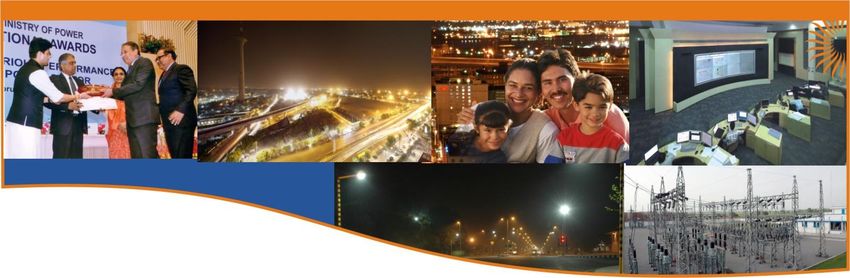
DELHI POWER SECTOR REFORM - A POSITION PAPER

                   Delhi’s Power Distribution Scenario - A Glance

The population of Delhi is approx. 1.70 crore spanned in the area of 1483 Sq kms. The
total electricity consumed in the national capital during the year 2012-13 was 33442 MU
comprising 4970 MU generated locally and 28472 MU purchased from other States.
Importantly, the total consumption of Delhi has grown by 85% in last 10 years.

Total numbers of electricity consumers in Delhi are nearly 46 lakhs, approx. the same
as that of Australia and double of Bihar (23 lakhs consumers).

Daily power demand of Delhi is 90 MU which is the average quantity supplied in UP (UP
has population of approx. 20 crores compared to Delhi’s population of 1.70 crore.).

Delhi’s Peak Demand approx. 5600 MW, which is also the peak demand met of UP as it
resorts to approx. 6-8 hours of load shedding on a day to day basis. It is noteworthy
here that, the peak demand of Delhi is sum total of demands of other these metro cities
namely Mumbai, Chennai and Kolkata.

                                                                             Page 3 of 12
DELHI POWER SECTOR REFORM - A POSITION PAPER
Tata Power Delhi Distribution’s Salient Achievements
In last 11 years the Peak Load met by Tata Power Delhi Distribution has gone
up from 930 MW to 1573 MW i.e by 70%.
60% of network length has been added in 11 years in our licensed area
Street light functionality in our area has gone up to 99.60% vis-a-vis 40% in
2002 (at the time of privatization)
Average System Availability for TPDDL has gone up to 99.95% and 99.99% in
case of industrial areas
New connections are energized within 3-6 days as against 50 days prior to 2002
Consumers’ meters are now replaced within 3 days vis- a- vis 25 days in 2002
The transformer failure rate has improved from 11% in 2002 to less than 1% in
our area
We have provided a state-of-the-art Integrated 24x7 Call Center with SAP
Business Communications Management (SAP BCM) support. It enables efficient
handling of customer communications in inbound and outbound contact centers
and also leverages the expertise of office and mobile workers. SAP BCM contact
center suite can be operated as a stand-alone solution or integrated with SAP
Customer Relationship Management (SAP CRM). The deep integration allows us
to build streamlined end-to-end processes for customer service. The software
also integrates with other SAP applications and services and numerous third
party software solutions.
There are 5377 payment avenues in our licensed area as against merely 20 in
2002. Besides this, there are 12 consumer care centers and 58 Any Time
Payment Machines.
Page 4 of 12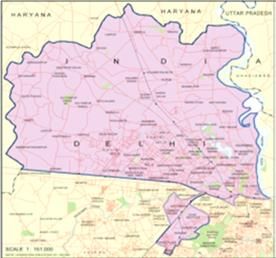
DELHI POWER SECTOR REFORM - A POSITION PAPER
Successfully deployed latest distribution technologies like Automated Meter
Reading (AMR), Grid Substation Automation System (GSAS), Supervisory
Control and Data Acquisition System (SCADA), Distribution Management System
(DMS), Systems Applications and Products (SAP), Geographical Information
System (GIS), Distribution Automation (DA), Outage Management System
(OMS) etc.
The technologies implemented form a large part of the Smart Grid Technologies
and are predominately operative at developed economies like USA, Europe, and
Singapore etc. Through these Smart Technologies we are moving forward
speedily towards “SMART GRID”. These include projects like Smart Feeder,
Advanced Meter Infrastructure (AMI), Advanced Communication Infrastructure,
Mobile Workforce Management (MWM), DR(Demand Response) Management,
Enterprise Application Integration (EAI), etc. The technologies are also lined up
for future execution in a phase wise manner in the coming five years.
Initiated a ‘Smart Grid and Automated Demand Response pilot’ in association
with IBM, which is probably one of its kinds in the country. The objective of the
pilot is to evaluate integration of infirm renewable power with the grid, reduction
in losses through automatic disconnection, enhanced reliability through self-
healing systems and empowerment of consumers in managing their demand
based on real time information of load and prevailing tariffs.
Our dedicated Demand Side Management Cell drives various initiatives within
licensed area. Its initiatives include Replacement of conventional lighting system
with energy efficient lighting system (LED), energy consumption study of high
end consumers and proposing energy efficiency solutions, Solar Roof tops on
Govt. Buildings and consumer premises, Awareness sessions, promotion of
energy efficient solution & technologies, Energy Clubs to sensitize community by
engaging students etc.
Page 5 of 12DELHI POWER SECTOR REFORM - A POSITION PAPER
Satisfied Consumers
Tata Power Delhi Distribution annually conducts a third party Consumer Satisfaction
Survey through reputed marketing research company IMRB. In 2013 results show that
88% of consumers are satisfied with our services. Wherein, Government, Industrial and
Commercial consumers are having 99% satisfaction level.
The findings of the Delhi’s Human Development Report 2013 reveals that almost 80%
of the respondents rated power supply in city as better. As per the report, reforms in the
power sector have yielded positive results with the supply of power greatly improving
post 2002. The power supply in the slums is found to be at par with the rest of Delhi. In
the report the Distribution Companies were rated next to DMRC services in terms of
consumer satisfaction.
Page 6 of 12DELHI POWER SECTOR REFORM - A POSITION PAPER
Corporate Social Responsibility - A Way of life at Tata Power Delhi Distribution
Going by the Tata Group’s ethos, Tata Power Delhi Distribution is proactively working
for the inclusive growth of the community residing in 223 Jhuggi Jhopri clusters in its
licensed area.
The company is imparting Women Adult Literacy classes to 140 Jhuggi Jhopri clusters
where illiterate women are provided training through Functional Literacy Program in
Hindi and Mathematics. Till date we have imparted this training to over 9000 women.
We are running Vocational Training Centers for imparting training, like Stitching &
Tailoring, Beautician, Computer literacy, Typing, Electrician, Mobile Repairing etc., to
the youths residing in Jhuggi Jhopri cluster and resettlement colonies and around 1400
people have benefitted through these 6 centres. Passed out beneficiaries are 100%
placed and are employed with Westside, Big Bazar, Dee Mark Health Care, More Mega
Mart, Chai Point, Pizza Hut, Fun Cinema, Café Coffee Day etc.
We have created Tutorial Programs to ensure children of Jhuggi Jhopari can have
better and improved access to education and better grooming. Program caters to 670
underprivileged kids and has succeeded to achieve zero dropout status of students.
Page 7 of 12DELHI POWER SECTOR REFORM - A POSITION PAPER
Our Mobile dispensary ‘Sanjeevani’ addresses medical needs of Jhuggi Jhopari cluster
and resettlement communities at their door-steps and has benefited more than 45000
people till date.
National Scenario – A Comparison:
Delhi has the highest per capita power consumption of electricity among the States and
Union Territories of India. The per capita consumption of electricity in Delhi has
increased to 1400 units against the National average of 800 units. Peak Demand of
Delhi in 2002 was 3097 MW which has gone upto 5727 MW in 2013 i.e. increase of
85%, while the load shedding has reduced significantly to around 0.2% as against 15%
to 20 % prior to 2002.
Against a back drop of nearly 6-8 hours of load shedding and power cuts prior to 2002,
Delhi Discoms are now providing round the clock quality power supply to all its
consumers. System availability has improved to a level of 99.94%. Delhi distribution
utilities have been able to significantly bring down AT&C Losses to less than 15% from
50-53% in 2002. The National average of AT&C Losses is 26% whereas most of the
Indian States are hovering at more than 40%.
Average monthly consumer expenditure per family residing in Delhi is estimated
as Rs. 8554. Major heads of expenditure included: miscellaneous consumer
services accounted for 20.87%, milk and milk products 10.67%, conveyance
9.41%, cereals 6.66%, rent 5.35%, clothing 5.27%, fuels & lighting 8.97%,
education 6.71%, beverages 6.02% of the Monthly per capita expenditure.
Electricity tariff in Delhi is the lowest as compared to all Metros and NCR. Current Tariff
is Rs. 3.90 (w/o subsidy) for monthly consumption less than 200 Units as compared to
Rs 4.20 in Mumbai (BEST) , Rs. 5.86 in Kolkata, Rs. 5.64 in Haryana , Rs. 5.08 in UP,
Rs. 5.94 in Punjab, Rs. 5.71 in Madhya Pradesh and Rs. 5.16 in Rajasthan. Detailed
Page 8 of 12DELHI POWER SECTOR REFORM - A POSITION PAPER
tariff comparative chart is attached as Annexure1 which indicates Delhi’s retail tariff vis-
a-vis metros, NCR and some of metropolitan cities across the globe.
The power purchase price has increased by 300% since 2002 due to increase in price
of coal, gas, freight etc. However there is a disconnect between consumer prices and
electricity supply price. The actual tariff being paid by consumers consuming up to 200
units has increased by 122% and 66% for consumers consuming 200-400 units.
However, the non- proportional hike in Tariff with respect to increase in power purchase
cost was bridged by the sharply decrease in the AT&C Losses and funding through the
borrowing. The benefits of sharp reduction in AT&C losses have gone directly to the
consumers. More importantly, if we go by the AT&C losses of over 50% at the time of
privatization in 2002 the present day Tariff should be around Rs. 10 but the actual tariff
today is around Rs. 6.5 only.
The power purchase cost in 2002 was Rs. 1.52 paisa unit which has gone up to
Rs. 5.45 unit in last 10 years, an increase by around 300%, however, in
comparison to that tariff hike has only been 75%, which clearly indicates that non
proportional increase in tariff, partly met by passing on the benefit of AT&C loss
reduction to consumers and partly by borrowings.
Since 2002, Tata Power Delhi Distribution has incurred capital expenditure of over Rs.
3000 crores towards strengthening and augmenting the network, reduction of losses,
improving consumer care centers, etc.
As mentioned earlier in the report, Tata Power Delhi Distribution has reduced the
Aggregate Technical & Commercial (AT&C) Losses in its Area of Supply in North, North
West Delhi from an opening AT&C loss level of 53% in July 2002 to 10.78% by end of
FY 2012-13, thereby generating additional revenues to the tune of approx. Rs. 10,300
Cr. for the benefit of the consumers; this amount has been utilized for meeting
increasing input costs (mainly power purchase) which would otherwise have been
Page 9 of 12DELHI POWER SECTOR REFORM - A POSITION PAPER
required to be funded either by the Government of Delhi (by way of subsidy) or through
revision of Tariffs. We have also paid dividends to the Govt. of Delhi to the tune of Rs.
17 crores for the period 2005-09
In addition to the estimated accumulated benefit which has accrued to the Government
over last eleven years due to loss reduction, the Delhi Government’s annual financial
support/subsidy of around Rs. 1,500 Crore p.a. to the Sector prior to privatization, (in
today’s terms, this support would be around Rs. 3,000 Crore. p.a.), which has virtually
been reduced to Rs. 200-500 crores. The accumulated benefit of nearly Rs. 30,000
Crore (for all Discoms) to the State since privatization, which has been deployed by the
Delhi Government in financing other infrastructure projects including roads, flyovers,
Delhi Metro, Stadiums and for development of the social sector.
Page 10 of 12DELHI POWER SECTOR REFORM - A POSITION PAPER
Annexure -1
Delhi Vis a Vis Metro cities of India
Delhi Mumbai Kolkata Chennai Bangalore
TPDDL R-infra CESC TNEB BESCOM
Units Rs. / Unit Rs. / Unit Rs. / Unit Rs. / Unit Rs. / Unit
Domestic - 2 Kw 200 4.10 5.10 5.69 2.90 4.40
Domestic - 2 Kw 400 4.95 6.05 6.44 3.58 5.12
Non Domestic -10
1500 8.57 8.51 7.80 7.80 5.77
kW
LT Industrial - 10
1500 8.13 9.12 6.20 5.90 5.95
kW
HT Industrial -
15000 7.50 10.32 7.96 5.90 6.65
100kW/108 KVA
Delhi Vis a vis NCR
Gurgaon DHBVNL Noida NPCL
Units Rs. / Unit Rs. / Unit
Domestic
200 5.40 4.38
- 2 Kw
Domestic
400 5.41 4.44
- 2 Kw
Non Domestic
1500 6.22 7.50
- 10 kW
LT Industrial
1500 7.08 7.57
- 10 kW
HT Industrial -
15000 6.38 7.70
100kW/108 KVA
Page 11 of 12DELHI POWER SECTOR REFORM - A POSITION PAPER
Delhi Vis a Vis International Cities
Washingt Houston Sydney Karachi
Delhi Texas Frankfurt Singapore Tokyo Seoul
on Center Click Electric
TPDDL Oncor Vattenfall SP Power TEPCO KEPCO
PEPCO Point Energy Co.
Rs. / Rs. / Rs. / Rs. / Rs. / Rs. / Rs. / Rs. / Rs. / Rs. /
Units
Unit Unit Unit Unit Unit Unit Unit Unit Unit Unit
Domestic
200
4.10 4.85 5.56 5.55 11.87 10.62 4.67 13.44 5.46 3.20
- 2 Kw
Domestic
400
4.95 5.79 4.56 4.08 10.55 10.62 4.67 13.44 9.75 2.39
- 2 Kw
Non
Not Not Not
1500
Domestic - 8.57 5.53 5.87 5.23 16.94 3.20 9.60
Avl. Avl. Avl.
10 kW
LT Industrial Not Not
1500
8.13 9.44 8.23 6.21 11.82 17.45 6.04 9.23
- 10 kW Avl. Avl.
HT Industrial
15000
Not Not
- 100kW/108 7.50 7.54 6.59 7.26 11.50 12.17 6.51 8.45
Avl. Avl.
KVA
***
Page 12 of 12You can also read