Team ArthNITI - | NITI Aayog
←
→
Page content transcription
If your browser does not render page correctly, please read the page content below
VOLUME SIX | 10 MARCH 2021
                                 SPECIAL FEATURE | ASPIRATIONAL DISTRICTS PROGRAMME

Team ArthNITI
Ajit Pai, Amit Kumar, Devashish Dhar, Himani Sachdeva, Indrani Dasgupta, Janak Priyani, Pankhuri Dutt, Rajeshwari
Sahay, Ranbir Singh, Raag Haria, Ranveer Nagaich, Urvashi1 Prasad, and Vishal Tripathi
FROM THE VICE CHAIRMAN’S DESK
Global economy has regained strength after the                  India as reflected by the FDI inflows of more than USD
contraction in first half of 2020. The loss in global GDP       58.4 billion during April 2020 and November 2020,
is estimated to be -3.5% in 2020 or close to USD 3              almost 23% higher than the total FDI inflows to India
trillion. The International Labour Organization (ILO)           during same period in 2019.
expects employment to decline sharply in 2020, with
an estimated drop of 12.1% and 17.3% in working                 In India, we have seen strong recovery post the April
hours in 2QCY20 and 3QCY20, respectively, relative to           2020 and June 2020 quarters and performance on all
2019. This has impacted the lower rung of the society           the high-frequency indicators beat prior expectations.
disproportionately more. The World Bank estimates               Gradually, the divergence between WPI and CPI inflation
that by 2021 there could be 150 million more people             has also eased, due to lower mobility restrictions and
below the poverty line due to Covid-19 relative to the          reduced supply bottlenecks. Wholesale prices have
pre-pandemic estimates.                                         now shown consistent growth for the past 6 months
                                                                (2.3% y/y growth in January 2021), though consumer
The global economy has started to recover the lost
                                                                prices inflation has moderated in January 2021 at
momentum. Major economies had a sharp recovery in
                                                                4.1% from its recent peak in October 2020 of 7.6%.
economic activity in the second half of 2020. China’s
                                                                Industrial activity in India has seen tepid growth after a
economy is even expected to post a positive GDP
                                                                sharp recovery from lows of April 2020, signalling the
growth in 2020, with the December 2020 quarter
                                                                need for more demand push measures. These can be
already registering GDP growth of 6.5%. Prices of
                                                                best achieved by pushing short gestation infrastructure
industrially relevant commodities like aluminium,
                                                                projects.
copper and crude oil have also risen substantially
since April 2020 due to better demand conditions.               This edition of ArthNITI focuses on NITI Aayog’s
Gold prices, however, have moderated reflecting                 flagship Aspirational District Programme (ADP)
reduced risk aversion. In particular, crude oil prices          and the performance of these districts. NITI Aayog
have more than doubled since April 2020 due to both             has anchored this Programme in 112 most under-
better demand and OPEC-induced supply constraints.              developed districts of the country. The overall thrust
This presents new risks for global and Indian economic          of the Programme is on convergence, peer-learning,
recovery.                                                       course correction and equipping these districts with
                                                                the capacity to deal with their challenges. With this
The PMI for the global economy and for many large
                                                                programme, we have attempted to inculcate a spirit of
economies, reflects conflicting signs for the growth
                                                                healthy competition, guided by ground-level real-time
trajectory. Global PMI has remained flat since its peak
                                                                data and developed a new standard of inclusive and
in October 2020, indicating that the fiscal stimulus
                                                                sustainable development.
given by the governments across the globe might have
already run out of steam. For large economies such              The FY22 budget comes as a culmination of a series
as Japan, France, Italy, Russia and South Africa, PMI           of bold structural reforms announced over the past ten
is yet to reflect a strong recovery going forward. PMI          months. The Government has once again reiterated
for India, however, reflects strengthening economic             its commitment to giving greater space to private
recovery. PMI’s latest reading came in at 57.5 for              investment and for withdrawing from non-strategic
manufacturing and 55.3 for services, all reflecting             sectors. This would ensure a sustained economic
upside trends in the coming months.                             recovery going forward.
However, markets across the world are reflecting                I look forward to your feedback on this edition.
positive investor sentiment. This is largely on the
back of increased liquidity in the markets and also
due to optimism about future growth. Investors reflect
increased optimism as flows into equities and bonds
surged, while gold prices moderated. Markets have                                                       Dr Rajiv Kumar,
also rallied on the back of a weakening dollar since                                                       March 2021,
April 2020. Global investors appear to be bullish on                                                         New Delhi

                                                            3
G20: The Macro Scene
Real Sector
% Share of GDP Per Capita Latest GDP Inflation Industrial Output Manufacturing Manufacturing
World GDP, 2019 ($), 2019 Growth (%)* (y/y, %) Growth (y/y,%) (%) of GDP^, 2019 PMI
United States 24.4 65,280.7 -1.9 Q4 1.4 Jan -1.3 Jan 11.3 59.2 Jan
China 16.3 10,261.7 6.5 Q4 -0.3 Jan 7.3 Dec 27.2 51.5 Jan
Japan 5.8 40,246.9 -1.2 Q4 1.8 Dec -2.6 Dec 20.7 49.8 Jan
Germany 4.4 46,258.9 -2.9 Q4 1.1 Jan 2.9 Dec 19.4 57.1 Jan
India 3.3 2,104.1 0.4 Q4 4.1 Jan 1.0 Dec 13.7 57.7 Jan
United Kingdom 3.2 42,300.3 -9.6 Q3 0.7 Jan -2.1 Dec 8.6 54.1 Jan
France 3.1 40,493.9 -4.5 Q4 0.6 Jan -0.7 Dec 9.8 51.6 Jan
Italy 2.3 33,189.6 -5.2 Q3 0.2 Jan 1.0 Dec 14.9 55.1 Jan
Brazil 2.1 8,717.2 -3.9 Q3 4.6 Jan 8.3 Dec 9.4 56.5 Jan
Canada 2.0 46,194.7 -4.8 Q3 1.0 Jan - 10.6 54.4 Jan
Russia 1.9 11,585.0 -3.4 Q3 5.2 Jan -2.5 Jan 13.1 50.9 Jan
Korea, Rep. 1.9 31,762.0 -1.4 Q4 0.6 Jan 3.4 Dec 25.4 53.2 Jan
Australia 1.6 54,907.1 -4.1 Q3 0.9 Dec -2.0 Sep 5.6 57.2 Jan
Mexico 1.4 9,863.1 -4.6 Q4 3.5 Jan -2.1 Dec 17.3 43.0 Jan
Indonesia 1.3 4,135.6 -2.2 Q4 1.5 Jan - 19.7 52.2 Jan
Saudi Arabia 0.9 23,139.8 -3.8 Q4 5.7 Jan -10.0 Nov 12.5 57.1 Jan
Turkey 0.9 9,042.5 -6.7 Q3 15.0 Jan 12.1 Dec 19.0 54.4 Jan
Argentina 0.5 10,006.1 -10.2 Q3 38.5 Jan 4.9 Dec 12.8 -
South Africa 0.4 6,001.4 -6.0 Q3 2.6 Jan -1.8 Dec 11.8 50.8 Jan
European Union 17.8 34,843.3 -4.2 Q3 0.2 Dec - 14.9 54.7 Jan
Source: CEIC, World Bank, *Calendar Year 2020. ^Japan (2017) & US (2018) values. PMI below 50: contraction; above 50: expansion. For KSA & RSA, PMI reported for whole economy. No new
industrial production releases from Indonesia and Canada since March 2020. Data for December is from 2020.
Financial and External Sectors
Interest Rates External Sector^
10Y (% of GDP, 2019)
Bond Bank Lending Rate
LCU/$* (%,y/y) Current Account Trade Exports Imports Inward Revenue ($ Bn)
USA 1.07 3.25 Jan 1 -2.3 27.5 12.2 15.3 3,640
China 3.23 4.35 Jan 6.47 (-6.5) 1.0 35.7 18.4 17.3 2,895
Japan 0.06 1.49 Jan 103.79 (-5.0) 3.6 36.8 18.5 18.3 1,232
Germany -0.52 2.01 Dec 0.82 (-8.9) 7.1 88.1 47.0 41.1 2,081
India 5.95 8.80 Jan 73.11 (2.6) -0.9 40.0 18.7 21.4 643
UK 0.34 1.10 Jan 0.74 (-4.1) -3.8 64.3 31.5 32.7 1,171
France -0.26 1.25 Dec 0.82 (-8.9) -0.7 64.5 31.8 32.8 1,103
Italy 0.65 1.40 Dec 0.82 (-8.9) 2.9 60.1 31.6 28.5 723
Brazil 7.58 37.01 Jan 5.37 (29.4) -2.7 29.0 14.3 14.7 293
Canada 0.88 2.45 Jan 1.27 (-2.8) -2.0 65.0 31.6 33.3 664
Russia 6.29 6.18 Dec 74.22 (20.1) 3.8 49.1 28.3 20.8 546
Korea, Rep. 1.77 2.74 Dec 1,098.24 (-5.9) 3.7 76.7 39.8 36.9 703
Australia 1.12 6.51 Jan 1.29 (-11.3) 0.5 45.7 24.1 21.6 387
Mexico 5.22 5.30 Dec 19.94 (6.0) -0.2 78.2 39.1 39.1 543
Indonesia 6.26 9.15 Dec 14,061.9 (2.5) -2.7 37.3 18.4 18.9 225
Saudi Arabia 0.67 0.82 Dec 3.75 (0.0) 6.3 62.2 36.0 26.1 307
Turkey 12.57 20.26 Jan 7.40 (24.9) 1.2 61.4 31.6 29.8 246
Argentina# 50.89 56.22 Jan 88.36 (46.0) -0.8 32.4 17.3 15.1 85
South Africa 8.74 7.00 Jan 15.14 (5.0) -3.0 59.2 29.9 29.4 114
EU -0.51 - 0.82 (-8.9) -2.3 90.7 47.1 43.6 9,415
As of 31.01.2021,unless otherwise stated. Source: CEIC, World Bank, Investing.com & Trading Economics. # 7Y bond.* - sign indicates appreciation. Inward revenue = export of goods
& services+ primary income+ remittances. ^ US & Japan 2018 values. `52 week bond yield and 3-month interbank rate.
Commodities and Markets
Data as of 31 Jan 2021 31 Jan 21 31 Jan 20
Copper (MT) Price ($) Price (`) DJIA 29,982.62 (4.3) 28,734.45
Iron Ore - 62% Fe (dmtu) 7,972.2 6,03,150 NASDAQ 100 12,925.38 (43.8) 8,991.51
Aluminium (MT) 169.6 4,210 SSE Composite 3,483.07 (26.8) 2,746.61
Steel (Rebar, MT) 2,003.9 1,67,450 Nikkei 225 27,663.39 (19.2) 23,205.18
Brent Crude Oil (bbl) 629.6 3,881.0 FTSE 100 6,407.50 (-12.1) 7,286.00
Coal 6,000 GCV (MT) 53.6 3,829 Hang Seng 28,283.71 (7.5) 26,312.63
Natural Gas, US (MMBtu) 86.8 2,747 STI 2,902.52 (-8.0) 3,153.73
Natural Gas US (MMBtu) 2.66 193.9 BSE Sensex 46,285.77 (13.7) 40,723.49
Source: $ Prices from World Bank Commodity Prices Pink Sheet. London Metal Source: Yahoo Finance. % change from last year in brackets.
Exchange. Rs. Prices from MCX, CEIC. ^NMDC/CIL Price (excl taxes etc).
4
1        ON THE RADAR

A Year of Covid-19                                            stronger health systems. As against a world average
                                                              of 15,113 India has 8094 confirmed Covid cases per
                                                              million population. Similarly, India is faring much better
                                                              on Covid-related fatalities, with 114 confirmed deaths
From a suspicious viral infection in China in November
                                                              per million population, compared to the world average
2019 to over 117 million cases and 2.6 million deaths
                                                              of 335.
across the world as of 9 March 2021, the Covid-19
pandemic has devastated health systems and                    Since September 2020, India’s active Covid caseload
economies alike.                                              has declined steadily, with only 1.85 lakh active cases
                                                              as of 9 March 2021. Just two states currently contribute
It is noteworthy that the total burden of confirmed
                                                              nearly 73% of the total active caseload in the country.
cases and deaths in India is among the lowest in
                                                              Further, from around 1000 daily Covid deaths in
the world despite our large population and a high
                                                              September 2020, the daily death toll is currently down
population density. A year into the pandemic, India has
                                                              to less than 100. Given that India has now embarked
around 11.2 million Covid cases and 158,000 deaths.
                                                              on an ambitious vaccination drive, with a special focus
In contrast, with almost an equivalent combined
                                                              on those who are more vulnerable, one can expect the
population, Europe (740 million) and North America
                                                              daily deaths to decline further and bring us closer to
(580 million) together have had 69 million Covid
                                                              normalcy relatively quickly. As of 9 March 2021, India
cases, and over 1.6 million deaths despite having
                                                              had administered over 2.1 crore vaccine doses.

                                                          5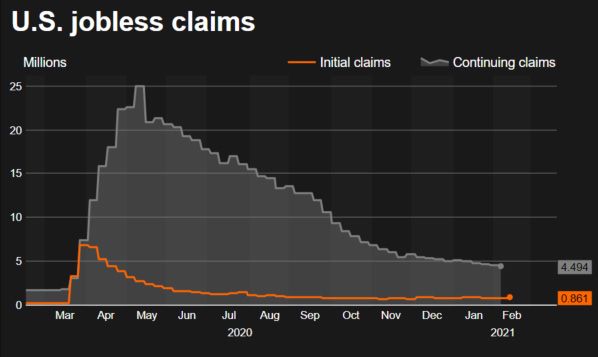
1     ON THE RADAR

                                                                Crucially, the lockdown catalyzed a behavioural shift
Lockdown                                                        in hygiene habits. People became far more conscious
While several measures such as screening passengers             about wearing face covers in public places and
at airports, prohibiting large gatherings in public             maintaining hand hygiene, as compared to the pre-
places, and introduction of physical distancing norms           lockdown period. This period was also utilised for
had been initiated in stages by the Central and state           fostering partnerships with the private sector, civil
governments, India entered into a nationwide lockdown           society and volunteer groups as well as accelerating
on 25 March 2020 when the number of Covid cases                 research and development efforts.
and fatalities were still very low.                             Further, there was a significant increase in the
According to the Oxford Covid-19 Government                     adoption of technology during the months of the
Response Stringency Index, India’s lockdown                     lockdown. A survey of 800 physicians conducted by
stringency score was 100 when we had just 0.04                  Boston Consulting Group, between March–May 2020,
daily Covid-19 cases per million population on 25               revealed that 85% clinicians in metropolitan areas and
March 2020. In contrast, by the time Italy’s lockdown           tier-1 cities used teleconsultation and digital platforms
stringency score exceeded 90, the country was                   during the lockdown. By early December 2020, over
already witnessing 79.21 daily Covid cases per                  1 million tele-consultations had taken place through
million population and 12.29 daily deaths per million           e-Sanjeevani, MoHFW’s telemedicine service, across
population. Similarly, while the United States had 33.95        550 districts in India.
daily Covid deaths per million population on 25 March           Cognizant of the economic hardships caused by the
2020, it had a relatively low lockdown stringency index         nationwide lockdown, curbs were progressively eased
score of 68.41.                                                 by the Central government and the decision-making
As highlighted in the Economic Survey 2020–21,                  power with respect to lockdowns was increasingly
India’s approach to tackling this global crisis has             decentralised to states in a calibrated manner while also
been grounded in the principle that while GDP growth            ensuring that the health gains were not frittered away.
will recover from the temporary shock caused by an              To address economic challenges, a package of Rs 20
intense lockdown, human lives that are lost cannot be           lakh crore was announced by the Union Government
brought back.                                                   as part of the Aatmanirbhar Bharat Abhiyaan. This
Countries that opted to go in for a delayed lockdown went       included a slew of measures for ameliorating the
on to experience excess Covid cases and deaths. As              hardships faced by various segments of society—such
of 9 March 2021, UK had 61,988 total cases per million          as migrant labourers, street vendors, urban poor, small
population, Spain 67,589, Italy 51,015, Brazil 51,760           businesses and salaried workers.
and the US 89,503, compared to India’s 8094 total
cases per million population. On the same date, UK had
1828 total deaths per million population, Spain 1527,
                                                                Health System Preparedness
Italy 1657, Brazil 1248 and the US 1621, in contrast to         One of the key priorities of the nationwide lockdown
India’s 114 total deaths per million population. In fact,       was to boost health infrastructure and human resource
various estimates suggest that lockdown 1.0 and 2.0             capacity in various parts of the country, including
averted between 14 lakh and 29 lakh cases and most
                                                                through the addition of beds and ventilators in hospitals;
importantly, 37,000 and 78,000 deaths in India.
                                                                creation of dedicated Covid hospitals, health centres
Although the health system in some parts of India               and care centres; as well as designation of testing
can brace itself fairly quickly to deal with a rapidly          laboratories in the public and private sectors.
spreading pandemic—due to significant inter- and
                                                                In the pre-Covid era, India produced virtually no
intra-state disparities—it was necessary to buy time
for allowing capacity to be ramped up in other areas.           Personal Protective Equipment (PPE) domestically.
India’s nationwide lockdown was therefore a timely              Now we manufacture over 450,000 kits per day.
and necessary intervention for preparing the health             Production of ventilators and N-95 masks has also
system, delaying and eventually flattening the peak,            been ramped up to an extent that India has not only
gaining clinical management experience, as well as              become self-sufficient in this regard but can also export
putting in place the necessary protocols and guidelines         to other countries. Further, testing capacity has been
for adoption by states.                                         enhanced significantly, in excess of 10 lakh Covid tests
                                                                per day, on average.

                                                            6
1 ON THE RADAR
A three-tier care system was established across as telemedicine solutions offering online consultations
the country for managing Covid patients. Category with doctors at home.
I Covid hospitals were set up for treating severely A coalition of over 100 healthcare specialists in the
symptomatic patients. These hospitals have fully private sector came together to launch Swasth, a first-
equipped intensive care units, ventilators and beds of-its-kind, made in India telemedicine application that
with assured oxygen support. Category II Covid health aims to deliver equitable and affordable healthcare
centres were established for treating patients with to all Indians, by cutting across geographical and
moderate symptoms. To enable isolation and care for income barriers. It is an open-source platform built
those afflicted with a mild form of the illness, Category with inter-operability principles that comply with the
III Covid care centres were set up by repurposing Government’s National Digital Health Mission. The
hostels, schools, hotels, stadiums and lodges. application facilitates seamless, remote interaction
Further, several initiatives were taken to ramp up India’s between registered medical practitioners and patients
surveillance, testing and contact-tracing capabilities. through multiple modes of video and telephony. It
The Consortium for Affordable and Rapid Diagnostics also deploys Artificial Intelligence-based triaging to
(CARD) was established for bringing together determine the care required, culminating in a digitally
scientists, laboratories and private players to enable signed prescription and treatment advice.
the production of around 100 lakh rapid antibody tests. Swasth has completed over 2.60 lakh Covid triages
To facilitate effective contact tracing, the Government since its launch in May 2020. Further, it has partnered
of India launched the Aarogya Setu mobile application, with leading telemedicine providers and hospitals,
which allows people to assess their risk of contracting resulting in over 40 lakh combined teleconsultations,
the infection based on their location and interactions conducted by over 15,000 doctors over the course
with others. For creating awareness about measures of a year. Along with free consultations, Swasth also
for boosting immunity, the AYUSH Sanjivani mobile provides services like home quarantine assistance;
application was also launched as a collaborative access to diagnostic laboratories and pharmacies as
effort between the Union Ministries of AYUSH and well as hospital bed discovery and booking assistance
Electronics and Information Technology. at a subsidised cost.
Partnerships between the government and civil society
Public-Private Partnerships have also played a crucial role in managing the Covid
outbreak in the country. The Government of India’s
As emphasised by the Prime Minister, any model of Empowered Group 3 mobilised NGOs, international
good governance must exemplify the “4P” principle— organisations and industry partners for assisting
people, public, private partnership. During a time of states and districts in identifying Covid hotspots and
unprecedented crisis, India put this mantra into practice
deputing volunteers; delivering essential services to
by galvanising the active participation of every level
the vulnerable, including the homeless, daily wage
of government, private sector, civil society as well as
workers, migrants and urban poor families; as well as
citizens for tackling the Covid outbreak in the country.
in creating awareness about disease prevention.
The development of Aarogya Setu, setting up of
Civil society partnerships enabled the local
CARD, expansion of Covid testing capacity as well
as enhanced domestic manufacturing of PPE kits, administration in Aspirational Districts to ramp up
masks and ventilators, are some of the prominent isolation camps, set up control rooms, enable delivery
achievements that were enabled by partnerships of door-to-door food supplies, and mobilize SHGs for
between the government, private sector and civil making masks and sanitizers, while simultaneously
society over the last several months. sustaining their livelihoods during the lockdown period.
In Osmanabad district, for instance, a Covid testing
Additionally, a host of innovations have emerged from
centre was established by utilizing the Corporate
start-ups during this crisis period, including robots
Social Responsibility corpus. The ‘Surakshit Dada-
for sanitisation of public places and delivery of food
to patients in isolation wards of hospitals; low-cost, Dadi & Nana-Nani Abhiyaan’ initiative was launched by
easy-to-use, portable ventilators for deployment in the Piramal Foundation in 25 Aspirational Districts as
rural areas; applications for monitoring the health an outreach effort focused on protecting the health and
status of Covid patients in quarantine centres; as well well-being of senior citizens during the Covid period.
71 ON THE RADAR
Further, NITI Aayog, in partnership with Bill and Melinda
Gates Foundation, Centre for Social and Behavioural
Role of NITI Aayog
Change, Ashoka University, and the Ministries of NITI Aayog has played an important role in the
Health and Women and Child Development, launched management of the Covid-19 pandemic. NITI is
a behaviour change campaign called ‘Navigating the co-chairing the national task force, which has
New Normal’. The campaign has two parts—a web systematically contributed towards the scientific
portal containing resources informed by behavioural and technical response to the pandemic, including
science and the use of nudge and social norms theory guidance on the lockdown. It has issued guidelines on
related to Covid-safe behavioural norms, as well as a testing, prevention, treatment, and surveillance. NITI
media campaign focused on the wearing of masks. Aayog is chairing and has helped Empowered Group
1 in developing medical infrastructure and Covid
Vaccine management plan for the country.
During March–April 2020, NITI supported the Ministry
A sum of Rs 100 crore was allocated from the PM of Health and Family Welfare to coordinate inter-state
CARES Fund for supporting Indian academia, start- transportation and delivery of essentials such as
ups and industry to develop and produce an effective medicines, medical devices as well as Covid-related
vaccine against Covid-19. Currently, about 30 vaccines emergency supplies (sanitizers, personal protective
are in different stages of development in India. Two equipment, oxygen cylinders).
vaccines in the most advanced stage of development, Further, NITI chaired a taskforce on the Covid vaccine
COVAXIN developed through an Indian Council of as well as other science and technology issues that
Medical Research-Bharat Biotech collaboration and facilitated the rapid development of diagnostics,
protocols for sample movement and ethical clearances,
COVISHIELD by the Serum Institute of India, have been
along with expediting regulatory process. NITI Aayog
approved for restricted use in emergency situations is also chairing the National Expert Group on Vaccine
by the Central Drugs Standard Control Organisation Administration for Covid-19, which is providing
(CDSCO). guidance on the selection of the vaccine candidate,
Consequent to the approval granted by the CDSCO, procurement of the vaccine, prioritization of population
India launched a massive vaccination drive on 16 groups, financial resources for procurement of
January 2021. While it took the UK and US 18 days vaccines, as well as the implementation and monitoring
and 10 days, respectively, to roll out 1 million vaccine mechanisms for the vaccine roll-out.
doses, India took just 5 days to achieve that threshold. NITI additionally chairs Empowered Group 3, which
In the first phase, priority was accorded to healthcare is tasked with coordinating with the private sector,
and frontline workers. The second phase is currently civil society, and international organizations for Covid
underway, in which people above the age of 60 and response related activities. Over 92,000 NGOs
those between the ages of 45-59 years suffering from registered on the Darpan portal of NITI Aayog have
a specified comorbidity, are being covered. been mobilised.
Beyond meeting the needs of the domestic population, NITI Aayog also developed a platform to engage the
India has also supplied over 55 million Covid private sector, a directory of Covid volunteers and a
vaccines to 62 countries, including Maldives, Bhutan, framework for scaling up Covid testing. Further, the
Bangladesh, Nepal, Myanmar, Seychelles, Sri Lanka, Telemedicine Practice Guidelines issued in March
Brazil and Morocco. Thus far, at least 92 countries 2020 by the National Medical Council and the Ministry
have approached India for Covid vaccines, bolstering of Health and Family Welfare, were prepared in
the country’s credentials as the vaccine hub of the partnership with NITI Aayog. To take note of practices
world. for tackling Covid-19, which are grounded in our own
realities, NITI also released a compendium of practices
from states and union territories.
82 THE BIG PICTURE
Markets and fears of future lockdowns due to Covid-19 kept
a lid on sustained gains. Recovery for the FTSE
has been tepid, as the UK continues to grapple with
new Covid-19 variants and infections. A nationwide
Global financial markets have remained buoyant on the
lockdown till March 29 and policy uncertainties around
back of loose monetary conditions and ample liquidity.
Brexit kept the pound and markets under pressure.
More recently, confidence surrounding the vaccine
Japanese markets, however, continued solid recovery
rollouts have further instilled optimism in the markets.
on the back of stronger than expected economic
Moreover, globally, central banks have pumped in
recovery, with the economy expanding at 12.7% at an
more than USD 28 trillion, most of which has found its
annualized rate in Q3/latest quarter.
way into the financial markets.
Emerging markets continued to scale new heights
Figure 1: Global markets amidst easy liquidity and a depreciating dollar. EMs
witnessed USD 9.4 billion worth of foreign equity inflows
in January ’21 alone. Of this, China attracted the majority
share, attracting USD 6.2 billion, while the rest of the
EMs funnelled USD 2.7 billion. Chinese markets have
been supported by strong recovery in both, domestic
as well as external markets, and is expected to be
the only major economy with positive GDP growth in
2020. In India, a better than anticipated budget helped
erase market losses in the run up to the budget. The
government’s plan for a fiscal-infrastructure push and
a glide path for the fiscal deficit by FY26 allayed the
markets concerns. Surplus liquidity, strong FII flows
and record high retail participation aided BSE Sensex
reach lifetime highs. The stronger than anticipated
economic recovery in September 2020 quarter and
manufacturing PMI reaching 57.7 in January 2021
provided further reasons to be optimistic. Strong
recovery, vaccine rollouts and a depreciating dollar are
likely to keep growth in emerging markets elevated.
The beginning of year 2021 has been highlighted with
fears of inflation driving bond yields higher worldwide.
Bond yields have inched up in India, due to increased
budgeted borrowing requirement and RBI looking to
tighten liquidity amidst inflation fears. Yields on the
Indian 10-year G-Sec have moved up by nearly 36bps
Equity markets in developed economies continued
since the start of the year.
to rise with intermittent corrections. The US markets
have been supported by exceptional performance of IT The commodity market looks to begin a new “super
companies and major banks. However, mixed macro cycle” this year. With brent crude rising more than 200%
data and inflation concerns are likely to keep markets from its April 2020 lows, and copper up by nearly 92%,
volatile. European markets remain below their pre- continuing to scale new highs, commodities are back in
pandemic highs. Sentiments in the Eurozone took a focus. Investors bet commodity demand to take off this
turn for the worse, with Composite PMI for January year on the back of a depreciating dollar and a faster than
declining to 47.5. Localized but frequent lockdowns expected economic rebound in the emerging markets.
92 THE BIG PICTURE
Global Recovery
Figure 1: Global Commodity Prices (October ’18 = 100)
Strengthens
In its January 2021 economic update, the International
Monetary Fund (IMF) improved its 2020 global GDP
growth estimate to -3.5% from -4.4%. The major
component of this recovery in many economies is
expected to be private consumption, while investment
growth is estimated to be gradual (except in China).
The IMF also signalled increased optimism for 2021 as
it upgraded GDP growth estimate for 2021 to 5.5% from
its October 2020 projection of 5.2%. The vaccine drive
is underway in many large economies and economic Source: World Bank
activity is also seeing a reacceleration. Many countries
PMI for economies like the US, UK, China, Eurozone,
are, however, seeing a surge of Covid infections, and
Germany, India and Canada has rebounded firmly into
consequent restrictions on mobility and measures to
positive territory. For countries like Japan, France,
promote social distancing.
Italy, Russia and South Africa it is yet to find stable
The beginning of 2021 saw major developments on the ground. Global PMI, however, has now moderated for
economic front. China’s National Bureau of Statistics the last three months, and PMI services have fallen to
revealed that the second largest economy will be the 51.6 from its most recent peak of 52.9 in October 2020.
only positively growing one in 2020, pegging its GDP
growth for 2020 at 2.3%. China expects strong growth Figure 2: Global PMI
of 6.5% in the December 2020 quarter. The Biden
administration in the US affirmed joining the WHO’s
Covax vaccination programme to halt the spread
of Covid-19, giving a major thrust to efforts towards
suppressing the disease. The Congressional Budget
Office of the United States predicts that their economy
will have a much sharper recovery than expected in
mid-2020, but it will take several years for output to
reach its full potential and for the number of employed
workers to return to its pre-pandemic peak.
Global commodity prices have started to indicate a
steady recovery, with gold prices moderating from
its peak in August 2020. Further, prices of copper,
aluminium and crude oil suggest a speedier recovery
in industrial demand, which indicates strength in the
global economy. Crude oil prices have doubled in the Source: IHS Markit
past 9 months and are expected to see further recovery
as OPEC+ continues to cut production and demand is
expected to recover sharply.
102 THE BIG PICTURE
According to the IMF, the sharp uptick in global recovery Figure 1: Difference in real GDP and components over
is primarily because of the pent-up consumption FY20
demand and therefore might be shortlived. In its World
Economic Outlook, for January 2021, it points out
that major indicators of global economic performance
have already started to show signs of tapering growth.
With renewed lockdowns in several economies
across Europe, global economic recovery, particularly
services output, is expected to remain subdued going
forward. The Biden administration’s stance to maintain
the tariffs imposed by the Trump administration on
Chinese imports will likely hurt global trade and global
growth.
Central governments in advanced economies and
emerging markets have recently announced extended
(Source: MoSPI)
fiscal packages to support the economy. Most central
banks across the globe are also expected to maintain Consumer Price Index (CPI) grew at 4.1% y/y in
an accommodative monetary policy to support liquidity January 2021, from 4.6% y/y in Dece mber’ 20,
in the market. With immense fiscal expansion and moderating from the peak reached in October 2020,
new credit lines taken by the corporate sector, both keeping close to the mandated policy target for the
public and private sector debt is set to expand to RBI. This was due to marked moderation in the Food
exorbitant levels. The Institute of International Finance and Beverages category, and within it particularly in
(IIF) estimated global debt to reach USD 277 trillion Vegetables, Meat and Fish and Eggs, through the last
in 2020, with major debt expansion for government, few months. Inflation in food categories such as Oils
followed by the non-financial and financial sectors and and Fats, Spices, Milk Products and Pulses remain on
households. Advanced economies are expected to see the higher side.
a greater increase in debt relative to emerging ones, Figure 2: Inflation metrics
implying requirement of greater sustained growth for
the former. The IIF also estimates that the four years
from 2016 have been marked by one of the largest debt
accumulations. With such high debt levels, the global
economic system will likely become highly unstable if
the impact of the virus on economic activity does not
ameliorate in a few months.
Indian Macro
(Source: MoSPI)
The Indian economy recovered well by the first half of
FY21 after the sharp decline in the June 2020 quarter Core inflation continues to be moderate, reflecting
as consumption and investment demand picked up supply bottlenecks and demand uptick for basic
sharply. In the September 2020 quarter, real GDP essentials. The Wholesale Price Index (WPI) growth
contracted by 7.5% y/y, significantly improving from the has picked up from 1.2% y/y in December 2020 to
-23.9% y/y growth in the June 2020 quarter. Growth 2.3% y/y in January 2021 after several months of tepid
in Private Final Consumption Expenditure (PFCE) growth.
improved from -26.6% y/y in the June 2020 quarter
Growth of Index of Industrial Production (IIP) remains
to -11.3% y/y in September 2020 quarter, and that in
subdued. The index increased by 1.0% y/y in January
Gross Fixed Capital Formation improved from -47.1%
2021, following a print of -2.1% y/y in December 2020.
y/y in June 2020 quarter to -7.3% in September 2020
For a more sustained recovery, India would require
quarter.
112 THE BIG PICTURE
stable and stronger growth in industrial production in the
coming months. India’s Purchasing Managers’ Index
(PMI) picked up pace in January 2020, reaching 57.7
for manufacturing and 52.8 for services. This is after
PMI for both manufacturing and services moderated
for two months post its recent peak in October 2020.
Global PMI reflects an even more worrisome picture,
as it continues to moderate from the levels reached
in November 2020. Global PMI services fell to 51.6 in
January 2021 from its peak of 52.9 in October 2020.
According to RedSeer Consulting, the festive season
sale in India for 2020 grossed a massive USD 8.3
billion between October and November 2020, almost (Source: CEIC)
65% higher than last year. This could contribute to an
improved December 2020 quarter performance on a y/y
basis relative to expectations. However, only pent-up
demand might not be enough to sustain this recovery
further. The Government of India’s thrust on boosting
the economy by doing infrastructure investment will
be crucial. The recently announced highway and
road projects in the FY22 budget could help generate
much needed demand in the economy. Further, the
government’s thrust on boosting industrial production
through the PLI schemes and Aatmanirbhar Bharat
Abhiyaan will be important contributors for bringing our
industry up to scale and global competitiveness. In the
FY22 budget, the Finance Minister also announced
measures to ensure proper channels for infrastructure (Source: MoSPI)
financing (through DFI and capital markets) and asset
monetization.
High Frequency
Indicators
(Source: SIAM)
(Source: IHS Markit)
122 THE BIG PICTURE
(Source: CEIC) (Source: CEIC)
(Source: CEIC)
(Source: SIAM)
133 CREDIT
Indian Credit
Scenario
143 CREDIT 15
4         STATES OF THE NATION

                                                                  these circumstances, the Indian government spent Rs
Tourism Sector                                                    25 crore on promoting domestic tourism in FY20. As
                                                                  lockdown rules ease and domestic flights and trains
Buckles Up                                                        return back to normal service, pent up demand is likely
                                                                  to drive the industry’s recovery and mostly through
                                                                  domestic tourism.
According to the Ministry of Tourism’s annual report              Indian states can easily be mapped according to
of 2020, the tourism industry in India contributed to             different forms of tourism experience that they offer.
5.06% of the GDP and 12.2% employment in 2017.                    The next section discusses some popular tourism
India’s rich history and varied landscape, along with             categories and the states that cater to those sub-
regional diversity, makes it a popular destination for            sectors.
domestic and international tourists. From snow-capped
mountains in the north and east, to the salt and sandy            Heritage/Historical tourism
deserts in the west, to the backwaters in the south,
                                                                  Some people travel to explore the history and heritage
India offers a lot to explore. In addition, each state has
                                                                  of a place. India has been ruled by different dynasties
its unique local cuisine and culture that is linked with
                                                                  and has been home to people from different parts of
the history of the region.
                                                                  the world that had different cities and states as their
In his speech during Independence Day 2019, the                   base. As a result, Indian states have inherited a rich
Prime Minister had encouraged all Indians to visit at             heritage tourism sector.
least 15 domestic destinations by 2022. The “Dekho
                                                                  Agra in Uttar Pradesh has the Taj Mahal, Agra Fort, and
Apna Desh” campaign was accordingly launched in                   Fatehpur Sikri close by, which attract both domestic
January 2020 to create awareness about tourist spots              and foreign tourists. Delhi is dotted with monuments
among Indians. According to the 2020 Indian Tourism               from the Lodi Dynasty to the Mughal era. The Red
Statistics at a glance, Uttar Pradesh and Tamil Nadu              Fort, Qutub Minar, Humayun’s Tomb are some few
had the largest number of tourist visits in 2019. While           monuments around which the city thrives. Tamil Nadu
Uttar Pradesh was the most popular destination among              has five world heritage sites identified and certified by
domestic tourists, Tamil Nadu attracted the largest               Unesco that include the Chola temples, monuments
number of foreign tourists followed by Maharashtra,               of Mahabalipuram, and the Nilgiri Mountain Railways.
Uttar Pradesh, and Delhi. Other popular states                    Tamil Nadu is also home to the temple town of Madurai,
were Tamil Nadu, Andhra Pradesh, Karnataka and                    which has the historic Meenakshi temple. Hampi, an
Maharashtra. In FY20, the sector was badly disrupted              ancient village in Karnataka, is known for its temples
due to the Covid-19 pandemic. Globally, the tourism               from the Vijayanagara Empire. Maharashtra and Goa
sector, along with the closely associated travel sector,          have several forts. The ones in Maharashtra were built
was among the worst hit during the lockdown. Despite              under Chhatrapati Shivaji Maharaj and other rulers

Source: ITS at a glance, 2020.

                                                             16
4 STATES OF THE NATION
and peshwas of the Maratha empire. The Goan forts catering to this segment, along with public hospitals. In
are a legacy of the Portuguese rule in India. Similarly, addition, the Ministry of AYUSH, established in 2014,
Rajasthan has several forts and palaces that were built is responsible for creating awareness about traditional
by Rajput kings and chieftains. West Bengal has the methods of treatment like Ayurveda, Yoga, Unani
Victoria Memorial and several other monuments and and Siddha. Chennai, Mumbai, Delhi, Bengaluru,
buildings that were built when Kolkata was the capital and Ahmedabad are among the top cities that attract
of the British Empire. medical tourists.
Religious tourism Luxury tourism
From Vaishno Devi in Jammu and Kashmir to Tirupati This sector has the highest value add among other
Temple in the Chittor District of Andhra Pradesh, the tourism sub-sectors. States like Rajasthan, Kerala,
religious tourism sector boasts of a regular flow of and Goa are paving the path. From luxurious forts and
devotees. Varanasi in Uttar Pradesh is not only among palaces that cater to the bustling wedding industry, to
the oldest cities of the world but also a very important the reserve forests in Ranthambore that offer luxurious
religious site for the Hindus. Bodh Gaya, in Bihar, is safari trips, Rajasthan attracts both domestic and
among the most important Buddhist pilgrimage sites. It foreign tourists. The backwaters of Kerala and the
attracts both Indian and foreign tourists annually. Ajmer beaches of Goa are other popular destinations for
Sharif in Rajasthan, Haji Ali Dargah in Maharashtra, luxury vacations.
and the Tomb of Salim Chisti in Uttar Pradesh are
popular pilgrimage sites for Muslims. Similarly, the
Golden Temple in Amritsar, Punjab, Jain Temples in Adventure tourism
Diwlara, in Mount Abu, Rajasthan, and Basilica of Bom This is a niche but growing sector in India that attracts
Jesus are among some of the most popular sites for visitors mostly to the states in the north-eastern part of
religious tourism among Sikhs, Jains and Christians. India or to other Himalayan states. Adventure activities
Medical tourism in the Himalayan states range from treks and caving to
rock climbing, river rafting, etc. Kerala hosts the annual
High quality of medical treatment at low costs has snake boat race, the Western Ghats are popular for
made India a popular destination for medical tourism. moonlight treks, and the Nilgiri Hills attract several
According to market reports, the Indian medical tourism backpacking tourists.
sector was likely to reach the value of $7-8 billion by
2020. According to reports, most medical tourists to Indian states offer a number of reasons to travel
India are from low-income countries like Afghanistan domestically. All states are well-connected through
and Bangladesh, followed by Russia and other central different modes of transport like roads, railways and
Asian states. The market for western medication airports. When it comes to tourism, Incredible India
is already mature, with a range of private hospitals indeed has a lot to offer.
175 POLICY AND PROGRAMME
Championing
development. In those days, imbalanced development
was recognised as a direct outcome of colonial rule
Change in
wherein the concentration of industries in selected
regions by the British deprived the left-out areas of
financial support required to industrialise, create wealth
Aspirational Districts and improve the socio-economic profile of its residents.
The concept of “balanced regional development” was
first mooted in the Third Five Year Plan (1961–66) and
In his seminal philosophical work, The Republic, Plato exhorted State governments to take steps to identify
famously wrote, “Our need will be the real creator,” the backward areas through a sound methodology.
emphasising that necessity is indeed the mother of As a consequence of this mandate, at the provincial
invention. However, the extension of this approach to level, various State governments encouraged
the theory of economic development has been widely collection of data on several key socio-economic
contested. Post World War II, the consensus among parameters and creation of composite indexes of
developmental economists crystallised around the backwardness. The Government of Gujarat took many
notion that removal of impediments to development pioneering steps by identifying the backward blocks in
is what would unleash economic growth. This found the State for targeted actions (Dr IG Patel Committee,
expression in the importance accorded by developing 1983). These were some of the early shoots of the
countries to the ease-of-doing business. Reduction in concepts of “data-driven governance” and “evidence-
economic uncertainty, through removal of bureaucratic based policymaking” in India, which have increasingly
red tape, simplification of rules, infusion of adequate gained prominence in our academic discourse today.
funds and a well-planned strategy, is largely accepted Taking this approach a step further, the Cowlagi
as the hallmark of rapid economic growth. Committee in 2004 further refined the identification of
On the other hand, another school of thought, backward blocks in Gujarat by including a wider range
pioneered by Albert O. Hirschman, stresses on the of indicators and embedding the spirit of convergence
nobility of dealing with economic anxieties rather in the design of the Programme. At the Central level
than “exiting” them. He emphasized that more than too, the Tenth Five Year Plan (2002–07) embraced the
infusion of large resources, developing countries theory of “balanced regional development”, with 2007
required training in dealing with difficult economic and marking the inception of the Backward Region Grant
policy decisions. The argument derives sustenance Fund, which supported 250 districts with untied funds.
from the idea that making mistakes and learning from Learning from all these experiences, for the past three
them is as important, if not more, than avoiding them. years, NITI Aayog has anchored the Aspirational
In his essays, Hirschman often drew strength from Districts Programme (ADP) in 112 most under-
Nietzsche’s famous maxim, “That which does not developed districts of the country. Using a three-pronged
destroy me, makes me stronger.” Thus, constantly approach (or the 3 Cs) of promoting “Convergence,
having to deal with uncomfortable facts and figures Collaboration and Competition”, the ADP is a synthesis
provides a fertile breeding ground for such training and of the two approaches towards development—provision
should be embraced by policymakers through greater of bare necessities and ample opportunities to the
decentralization of decision-making power. This model deprived as conservatives like Milton Friedman argued
incentivises creation of structures wherein puzzling for and, at the same time, exposition of fissures in the
outcomes are exposed through data collection and socio-economic fabric of each district through robust
stakeholders are compelled to deconstruct those data that creates incentives of local administration to
findings. creatively respond to their own peculiar challenges, as
It could be argued that India’s approach towards Hirschman had professed. This amalgamated overture
economic development, especially towards its under- towards correcting regional imbalances and ensuring
developed pockets, is emblematic of a continuing social progress of the marginalized is in many ways a
transition where both these schools have been fiddled novel experiment.
with, both at the federal and provincial levels. The A key component of the Aspirational Districts
Industrial Policy Resolution adopted by the Parliament Programme is the emphasis on data-driven
in 1956 aimed at setting up public sector units in governance and evidence-based policy at the district
backward regions of the country as it was believed level. By engaging in regular monitoring of data points,
that the provision of infrastructure can boost regional and using the same for ranking the districts, the
185 POLICY AND PROGRAMME
Programme has engendered a data-driven approach district’s upliftment (which includes Central and State
towards governance at the district level, and efforts are governments, district administration, development
being made to percolate it further down at the block and partners, civil society et al) within the framework of the
panchayat levels as well. The first two years of ADP Programme ensures that the vision for development
were focused on improving the efficiency, frequency, remains egalitarian and inclusive. Involvement of
and efficacy of data-driven interventions at the central multiple stakeholders guards against the myopic
ministerial levels, and supporting the districts with tendency of devising policy interventions solely on
insights, analysis, and other kinds of assistance. Now the basis on data insights but rather through a holistic
that this strategy has borne some positive results in lens carved out of the accumulated knowledge and
terms of net improvement in indicators across all experience of every stakeholder.
thematic focus areas, NITI Aayog is moving forward in Thus, the Aspirational Districts Programme and the
enabling the district administration to undertake similar manner of its implementation falls in the Goldilocks Zone
activities at their end to improve blocks and panchayats. wherein the delicate balance between the importance
To this end, the “Champions of Change” digital platform of data and lived human experiences is maintained. As
provides the Aspirational Districts administration with all the data collected under the Programme is available
self-service analytics tools that require zero-coding in the public domain, it provides the fodder on which
skills but enable rich graphing and data analysis various kinds of models can feed and churn out new
straight from a web-browser environment. insights, which are useful to improve the incisiveness
Concomitantly, the design of ADP also ensures that and efficacy of policy interventions. Independent
the well-articulated warnings of many economists, evaluation studies have strongly supported the impact
which caution against making data the “be-all and of this development model and have also attested to
end-all” of all policy formulation, do not go unheeded. its potential to serve as a template for other developing
Nobel laureate Lars Peter Hansen has persuasively countries. The overall thrust of the Programme is on
argued that data does not speak for itself and relies peer-learning, course correction and equipping these
on interpretation through statistical models to convey districts with the tenacity to deal with their challenges.
any meaningful insight. Modelling of data is inherently After three years of implementation, the results of this
a subjective exercise and at best, characterises one of approach exemplified by ADP have been promising as
many possible ways of making sense of that data. In almost all Aspirational Districts have shown significant
ADP’s framework, the monthly capturing of a district’s improvement in critical gap areas. Convergence of
performance of 49 key performance indicators, across resources and efforts, in a spirit of healthy competition
five sectors, helps the districts to systematically and guided by quality data, is emerging as the new gold
align their development priorities. But at the same standard of inclusive and sustainable development.
time, the inclusion of all possible stakeholders in a
196 GLOBAL NEWS
Indian Economy to Grow by 10% Slowing Chinese Investment May
in FY22: S&P Impact Global Growth
S&P Global in its recent update for the Indian economy China continues to be a major driving force for the
projected a 10% y/y growth in FY22. It mentioned that global economy on the trade front and as a buyer of
consistently good agriculture performance, flattened commodities. However, economic activity and demand
coronavirus infection curve and government spending created by Chinese infrastructure and other types of
have all supported economic recovery. construction in advanced and emerging economies
are waning.
Read more:
https://www.cnbc.com/2021/02/16/india-economic- Read more:
recovery-fiscal-2022-sp-global-ratings.html h t t p s : / / w w w. s c m p . c o m / c o m m e n t / o p i n i o n /
article/3121485/chinas-overseas-investment-falling-
just-when-global-economy-needs
US Unemployment Scenario
Remains Grim Biden Restores Tariffs on China
The number of people filing for unemployment benefits Imposed by Trump
for the first time increased unexpectedly last week,
raising concerns about the economic recovery. Job The new United States administration has decided to
growth remains tepid for the second month, despite keep the tariffs imposed on Chinese imports by the
declining Covid-19 infections. Trump administration. However, it has announced it
will evaluate how to proceed after a thorough review.
Figure 1: Rate of Employment Recovery Is Slowing
Read more:
https://www.scmp.com/economy/china-economy/
article/3122289/us-china-trade-war-trumps-trade-
tariffs-remain-moment-beijing
India to Emerge 3rd Largest
Energy Consumer by 2030: IEA
The International Energy Agency (IEA) projected
India’s oil demand to grow to 8.7 million barrels per
day (mbpd) in 2040 from about 5.4 mbpd in 2019,
accounting for more than 25% of global growth. It also
expects that India will overtake the European Union as
Source: Refinitiv Dateastream – Routes graphic/Stephen Clup 18/02/21
the third largest energy consumer by 2030.
Read more: Read more:
https://www.reuters.com/article/us-usa-economy/ https://www.bloombergquint.com/business/india-
u-s-weekly-jobless-claims-unexpectedly-rise- to-overtake-eu-as-world-s-third-largest-energy-
idUSKBN2AI1UL consumer-by-2030-iea
207 STATE NEWS
Gujarat Launches ODPS-2.0 its schemes more accessible to citizens. As a part of
Duare Sarkar, as many as 11 schemes of the state
to Promote Transparency in government—including Swastha Sathi, Khadya Sathi,
Governance Jai Johar and Kanyashree schemes—will be made
available to beneficiaries at their doorsteps.
ODPS-2.0 aims to work towards good governance
along with transparency. The state government plans Read more
to facilitate the process of providing online approvals
https://timesofindia.indiatimes.com/india/bengal-govt-
for industrial development projects. The objective is to
kicks-off-massive-duare-sarkar-outreach-campaign-
develop online systems by making maximum use of
ahead-of-assembly-polls/articleshow/79507804.cms
technology in departments such as housing, revenue
and urban development.
Read More
India’s First Blockchain-Enabled
https://techobserver.in/2020/12/05/egov-gujarat- Trading Platform for Rooftop
cm-vijay-rupani-launches-online-development- Solar Power in UP
permission-system-2-0/
The Uttar Pradesh Power Corporation (UPPCL),
Madhyanchal Vidyut Vitran Nigam Limited (MVVNL)
Maharashtra Releases and the Uttar Pradesh New and Renewable Energy
Renewable Energy Policy Development Agency (UPNEDA) are hosting a first-of-
its-kind pilot project on energy generated from solar
Maharashtra released the Renewable Energy Policy, rooftop systems installed atop Lucknow buildings.
with the target to add 17,385 MW renewable energy
capacity by 2025. This will include 12,930 MW of Read More
solar capacity, 2,500 MW of wind capacity, 1,550 MW
https://mercomindia.com/uttar-pradesh-blockchain-
of bagasse and waste capacity, 380 MW of small
rooftop-solar-trading/
hydroelectric and 25 MW of new technologies.
Read More Andhra Pradesh Introduces New
https://energy.economictimes.indiatimes.com/
news/renewable/maharashtra-to-add-17385-mw-
Tourism Policy
renewable-energy-capacity-by-2025/79654370 The Andhra Pradesh government introduced a new
tourism policy to make the state a premier world-class
destination. The objective is to build robust tourism
Bhopal Declared Best ‘Smart infrastructure and promote responsible tourism
City’ of India practices among all stakeholders.
The Ministry of Housing and Urban Affairs declared
Bhopal as the best ‘Smart City’, as part of its Smart Read more
City Mission. Ahmedabad was ranked second, followed https://www.hindustantimes.com/travel/ap-government
by Surat and Indore at the third and fourth positions, -comes-up-with-new-tourism-policy/story-
respectively. MYPJXa0qhctgAeeML44ACO.html
Read More
Jharkhand Govt to Promote State
https://www.freepressjournal.in/bhopal/madhya-
pradesh-bhopal-smart-city-ranked-1st-in-smart-city- as Eco-Tourism Destination
mission-of-goi The Jharkhand government has decided to utilize
its existing infrastructure at popular forests and
West Bengal Launches Duare waterbodies, with the aim to promote the state as an
eco-tourism destination. For this purpose, the state
Sarkar Outreach Scheme tourism department is working under two policies,
The West Bengal government has launched a massive namely, the Swadesh Yojana and the Retreat Tourism
outreach programme called ‘Duare Sarkar’ to make policy.
217 STATE NEWS
Read More Read More
https://indianexpress.com/article/north-east-india/ https://www.business-standard.com/article/finance/
tripura/tripura-best-performing-state-under-pmay- fifteen-finance-commission-submits-report-on-tax-
urban-in-the-northeast-7123678/ devolution-to-prez-kovind-120110900585_1.html
Tripura Emerges as Best- Kerala Knowledge Mission
Performing State in Launched
Implementing PMAY(U) The state government has launched the Kerala
Knowledge Mission with the aim to transform Kerala
Tripura has emerged as the best-performing state in
into a knowledge economy. Job aspirants and
the implementation of the Pradhan Mantri Awas Yojana
educated unemployed youth can register at www.
(Urban), under the North-Eastern and Hilly States
knowledgemission.kerala.gov.in, which will act as a
category.
digital workforce management system.
Read More Read More
https://indianexpress.com/article/north-east-india/ h t t p s : / / w w w. n e w i n d i a n e x p r e s s . c o m / c i t i e s /
tripura/tripura-best-performing-state-under-pmay- thiruvananthapuram/2021/feb/10/kerala-knowledge-
urban-in-the-northeast-7123678/ mission-launched-2261914.html
14 States Okay Centre’s Single Karnataka to Create 1 Mn Jobs by
Window System 2025
As many as 14 states—Telangana, Andhra Pradesh, The Karnataka government has decided to create
Gujarat, Maharashtra, Odisha, Uttar Pradesh, one million jobs in the state by 2025 under the
Uttarakhand, Punjab, Assam, Tamil Nadu, Himachal Karnataka Digital Economy Mission, by attracting
Pradesh, Madhya Pradesh, Goa and Karnataka— more investments in the information technology sector.
have given their consent to be part of the Centre’s Under this initiative, the state government plans to
single window clearance platform and the investment focus on improving connectivity even to remote parts
clearance cell to provide all requisite clearances of the state, providing round-the-clock electricity and
to investors at one point. The exercise has been reducing rural–urban divide by establishing the much-
undertaken by DPIIT, which plans to launch the needed infrastructure.
technology-driven clearance system by 15 April 2021.
Read More
Read More https://www.business-standard.com/article/current-
https://www.thehindubusinessline.com/economy/14- affairs/karnataka-to-create-1-million-jobs-in-it-and-
states-onboard-dpiits-single-window-system/ related-sector-by-2025-121020901776_1.html
article33454757.ece
Bihar to Introduce Policy for
15th FC Keeps Transfer to States Setting up Ethanol Plants
from Divisible Tax Pool to 41% for The Bihar government has decided to come up with
5 Years an incentive policy to attract investment for setting
up ethanol plants over the next one month, with easy
The 15th Finance Commission (FC) has kept the availability of land and raw materials. The policy is
transfer to states from the divisible tax pool to 41% aimed at attracting investment for the production of
from 2021–26. States’ share at 41% of the divisible ethanol from molasses, sugarcane, maize and cereals.
pool comes to Rs 42.2 trillion for the period of 2021–
26, while the total grants have been pegged at Rs 10.3 Read More
trillion. This will make aggregate transfers to states at https://www.hindustantimes.com/india-news/bihar-to-
Rs 52.5 trillion, roughly at 50% of the total divisible unveil-ethanol-production-incentive-policy-soon-to-
pool in the next five years. woo-big-investors-101613549650808.
22You can also read