THE EFFECT OF TEST TIMING ON THE PROBABILITY OF POSITIVE SARS-COV-2 SWAB TEST RESULTS: MIXED MODEL APPROACH - JMIR PUBLIC HEALTH AND SURVEILLANCE
←
→
Page content transcription
If your browser does not render page correctly, please read the page content below
JMIR PUBLIC HEALTH AND SURVEILLANCE                                                                                                           Benoni et al

     Original Paper

     The Effect of Test Timing on the Probability of Positive
     SARS-CoV-2 Swab Test Results: Mixed Model Approach

     Roberto Benoni1, MD; Silvia Panunzi2, MSc; Irene Campagna1, MD; Francesca Moretti2, PhD, MD; Giuliana Lo
     Cascio3, MD; Gianluca Spiteri2, MD; Stefano Porru2, MD; Stefano Tardivo2, MD
     1
      Postgraduate School of Hygiene and Preventive Medicine, University of Verona, Verona, Italy
     2
      Department of Diagnostics and Public Health, University of Verona, Verona, Italy
     3
      Department of Pathology, University Hospital of Verona, Verona, Italy

     Corresponding Author:
     Roberto Benoni, MD
     Postgraduate School of Hygiene and Preventive Medicine
     University of Verona
     Strada Le Grazie, 8
     Verona, 37134
     Italy
     Phone: 39 0458027659
     Fax: 39 0458027659
     Email: roberto.benoni90@gmail.com

     Abstract
     Background: During the COVID-19 pandemic, swab tests proved to be effective in containing the infection and served as a
     means for early diagnosis and contact tracing. However, little evidence exists regarding the correct timing for the execution of
     the swab test, especially for asymptomatic individuals and health care workers.
     Objective: The objective of this study was to analyze changes in the positive findings over time in individual SARS-CoV-2
     swab tests during a health surveillance program.
     Methods: The study was conducted with 2071 health care workers at the University Hospital of Verona, with a known date of
     close contact with a patient with COVID-19, between February 29 and April 17, 2020. The health care workers underwent a
     health surveillance program with repeated swab tests to track their virological status. A generalized additive mixed model was
     used to investigate how the probability of a positive test result changes over time since the last known date of close contact, in
     an overall sample of individuals who tested positive for COVID-19 and in a subset of individuals with an initial negative swab
     test finding before being proven positive, to assess different surveillance time intervals.
     Results: Among the 2071 health care workers in this study, 191 (9.2%) tested positive for COVID-19, and 103 (54%) were
     asymptomatic with no differences based on sex or age. Among 49 (25.7%) cases, the initial swab test yielded negative findings
     after close contact with a patient with COVID-19. Sex, age, symptoms, and the time of sampling were not different between
     individuals with an initial negative swab test finding and those who initially tested positive after close contact. In the overall
     sample, the estimated probability of testing positive was 0.74 on day 1 after close contact, which increased to 0.77 between days
     5 and 8. In the 3 different scenarios for scheduled repeated testing intervals (3, 5, and 7 days) in the subgroup of individuals with
     an initially negative swab test finding, the probability peaked on the sixth, ninth and tenth, and 13th and 14th days, respectively.
     Conclusions: Swab tests can initially yield false-negative outcomes. The probability of testing positive increases from day 1,
     peaking between days 5 and 8 after close contact with a patient with COVID-19. Early testing, especially in this final time window,
     is recommended together with a health surveillance program scheduled in close intervals.

     (JMIR Public Health Surveill 2021;7(6):e27189) doi: 10.2196/27189

     KEYWORDS
     close contact; COVID-19; health care workers; health surveillance; swab test timing

     https://publichealth.jmir.org/2021/6/e27189                                                    JMIR Public Health Surveill 2021 | vol. 7 | iss. 6 | e27189 | p. 1
                                                                                                                         (page number not for citation purposes)
XSL• FO
RenderX
JMIR PUBLIC HEALTH AND SURVEILLANCE Benoni et al
This study aimed to estimate how the individual probability to
Introduction test positive changes over time, from the date of the last known
COVID-19, caused by SARS-CoV-2 infection, manifests as an close contact until the end of individual follow-up evaluation,
acute respiratory distress syndrome, which requires intensive and to evaluate how different scheduled surveillance time
care and can lead to difficulties in the management of cases and intervals might impact disease prevention.
limited hospital beds. The COVID-19 pandemic has become a
challenge for health care systems because of the large in-hospital Methods
diffusion of the pathogen [1,2]. The spread of the infection may
involve patients sharing the same hospital ward (ward-based
Population and Setting
contact) but can also result from infectious health care workers The University Hospital of Verona (UHV) is a high-level facility
(12%-29% of cases) [3,4]. that serves an area with 922,000 inhabitants and patients from
other Italian regions. During the COVID-19 pandemic, it was
The ongoing COVID-19 pandemic is placing a large strain on one of the hub centers for the Veneto region.
global health care, social, and economic systems. On April 7,
2021, John Hopkins University reported a total of 132,469,663 According to the guidelines of the Italian Ministry of Health
cases and 2,874,372 deaths worldwide [5]. [9], the UHV established a taskforce [10] and conducted a health
care surveillance program (HSP) to ensure the safety and
Italy is one of the most affected countries with 3,686,707 well-being of patients and employees and the continuity of care.
registered cases (as of April 7, 2021), 5% of which were health
care workers [5,6]. Asymptomatic cases play an important role All the employees of the UHV, the staff temporarily operating
in the nosocomial transmission of the disease [7]; they are at UHV structures (contractors, PhD students, and internship
estimated to vary from 5% to 80% of the total number of cases holders) and the University of Verona staff operating at UHV
[8]. Personal protective equipment (PPE) such as universal face facilities were involved in the HSP and were considered health
masks and preventive actions such as SARS-CoV-2 screening care workers (HW) for the purpose of this study. Individuals
programs for hospitalized patients and workers have been involved in the HSP with an identifiable date of close contact
introduced to limit the spread of the infection [4]. with a patient with COVID-19 were included in the study. The
definitions of close contact are presented in Textbox 1. The
Contact tracing and active surveillance implemented through study period was approximately 2 months: February 29, 2020
SARS-CoV-2 swab tests play an important role in the (data on the first swab in our database), to April 17, 2020 (set
containment of the disease. Very few studies have investigated date of data collection).
the “best time to test,” particularly in situations where a close
contact was detected and most of them focused on symptomatic
cases only.
Textbox 1. Definition of close contact with a confirmed COVID-19 case according to the Veneto region (Italy) guidelines dated March 13, 2020 [11].
• A person cohabiting with a patient with COVID-19.
• A person who had direct physical contact with a patient with COVID-19.
• A person who had unprotected direct contact with the secretions of a patient with COVID-19.
• A person who had direct contact (face to face) with a patient with COVID-19 at aJMIR PUBLIC HEALTH AND SURVEILLANCE Benoni et al
The AllplexTM2019-nCoV assay (Seegene Inc) was used to next one was “virtually” modified with a mathematical shift as
test the respiratory specimens. The virus was identified through shown below.
multiplex real-time reverse transcriptase–polymerase chain
An index to enumerate individual swabs was generated as
reaction (RT–PCR) testing, which targeted 3 viral genes (E,
follows:
RdRP, and N), with a detection limit of 4.8 copies/mL. The
results were validated by the National Reference Laboratory of
the National Health Institute [14]. Automated RNA extraction
and RT–PCR were performed using Seegene NIMBUS (Seegene
Inc). RT–PCR was performed using the CFX96TMDx platform where ds and dc are the dates of the individual swab tests and
(Bio-Rad Laboratories Inc) and subsequently interpreted using of close contact, respectively, i identifies each of the individuals
Seegene Viewer (Seegene Inc). Samples were considered included in the study, and t is the index identifying each
positive at a cycle threshold (Ct) value of ≤40 for at least 1 of individual’s test finding.
the 3 target genes. Microbiology laboratory data (swab results
and dates) and data from the questionnaires were then merged In our HSP, the fixed surveillance interval between swabs was
into a unique database. 7 days. The Iv for the first swab (Ivi1) was assumed to be 0
because it was considered unmodifiable by HSP timing.
Ethics Statement
According to Decree-Law N.14 of March 9, 2020, personal data Thereafter, we formulated a GAMM model introducing the
can be collected to guarantee public health and ensure the index time as follows:
diagnosis and assistance of the infected individuals in the context Yi ~ Bin (ni, πi); πi = probability of a positive test
of the COVID-19 emergency [15]. All data were collected
Logit(πit) = βi[f{(dsi1 – dci) + (Ivit × It)}] + bi0 + εit
exclusively for the purpose of the health surveillance program
and were anonymized and presented in an aggregated format where ds1 and dc are the date of the first swab and the date of
to ensure the privacy of the participants. The study conformed close contact, respectively, i is the individual index, and t is the
to the ethical standards of the 1964 Declaration of Helsinki and time observation index. It and Iv are the fixed surveillance
its later amendments. interval time and the index visit, previously exposed, and f {(dsi1
Statistical Analysis – dci) + (Ivit × It)} indicates a smooth function with penalized
splines; furthermore, bi0 is the individual-specific random
A data exploratory analysis was first conducted to investigate
the characteristics of the HWs. Categorical data were compared intercept in the model.
using the chi-square test, and the Mann-Whitney (2-sample A P value ofJMIR PUBLIC HEALTH AND SURVEILLANCE Benoni et al
Table 1. Characteristics of health care workers at University Hospital of Verona (Italy) distinguished by SARS-CoV-2 swab test results and the presence
of symptoms (data collected between February 29 and April 17, 2020).
Characteristics Infected health care workers with an Positive swab test finding among health Symptomatic health care workers with
initial negative swab test finding after care workers after close contact with a COVID-19
close contact with a patient with patient with COVID-19
COVID-19
Yes (n=49) No (n=142) P valuea Yes (n=191) No (n=1880) P value Yes (n=88) No (n=103) P value
Sex, n (%) .40 .25 .20
Male 15 (31) 55 (39) 70 (37) 607 (32) 37 (42) 33 (32)
Female 34 (69) 87 (61) 121 (63) 1273 (68) 51 (58) 70 (68)
Age (years), median 40.9 (30.0- 47.9 (32.9- .06 46.7 (31.8- 45.1 (32.2- .31 48.9 (36.9- 41.5 (30.3- .08
(IQR) 52.4) 55.3) 54.8) 53.2) 54.8) 54.7)
Symptoms, n (%) .31 N/Ab N/A N/A N/A N/A N/A
Yes 19 (39) 69 (49)
No 30 (61) 73 (51)
Days from close contact 3.0 (1.0-6.0) 4.0 (2.0-8.0) .06 N/A N/A N/A N/A N/A N/A
to initial swab sample
collection, median (IQR)
a
P values were computed using the chi-square test and the nonparametric Mann–Whitney U test.
b
N/A: not applicable.
Since all HWs were checked over time with repeated swabs differences were observed in the time to the first positive finding
under the HSP, it was possible to calculate the proportion of on the swab test with respect to sex (P=.62), age (P=.47), or
false-negative findings from among the total number of clinical manifestations (P=.39).
individuals who tested negative (false omission rate). The false
In the GAMM model that considered the whole group of
omission rate was 2.5%.
COVID-19–positive individuals, the probability of a positive
The median time from the date of individual close contact to swab test result increased from 0.74 on day 1 to 0.77 on day 5
the first positive finding on the swab test was estimated. In the after close contact (Table 2). This probability peaked between
overall sample of HWs, this median time was 7 (IQR 4-11) the fifth and eighth days (0.77) and then decreased during
days. Considered separately, the median time for HWs who subsequent days since close contact (Figure 1). All the predicted
tested negative on their initial swab test and that for HWs who model probabilities for the first to the 21st day from close
did not was 10 days and 4 days, respectively. No significant contact are indicated in Table 2.
https://publichealth.jmir.org/2021/6/e27189 JMIR Public Health Surveill 2021 | vol. 7 | iss. 6 | e27189 | p. 4
(page number not for citation purposes)
XSL• FO
RenderXJMIR PUBLIC HEALTH AND SURVEILLANCE Benoni et al
Table 2. Predicted probabilities of the generalized additive mixed models for a positive swab test result related to the number of days since close contact
in the whole group of infected health care workers at the University Hospital of Verona (model was fitted with data collected between February 29 and
April 17, 2020).
Day π (0.95% CI)
1 0.74 (0.62-0.84)
2 075 (0.65-0.83)
3 0.76 (0.67-0.83)
4 0.76 (0.69-0.83)
5 0.77 (0.69-0.83) a
6 0.77 (0.69-0.83)
7 0.77 (0.69-0.83)
8 0.77 (0.69-0.83)
9 0.76 (0.68-0.82)
10 0.75 (0.67-0.81)
11 0.73 (0.65-0.79)
12 0.71 (0.63-0.78)
13 0.69 (0.60-0.76)
14 0.66 (0.58-0.73)
15 0.63 (0.55-0.71)
16 0.60 (0.51-0.67)
17 0.56 (0.48-0.64)
18 0.53 (0.45-0.60)
19 0.49 (0.41-0.56)
20 0.45 (0.38-0.53)
21 0.41 (0.34-0.49)
a
Italicized values indicate the days where the probability of testing positive for COVID-19 on the swab test peaks.
https://publichealth.jmir.org/2021/6/e27189 JMIR Public Health Surveill 2021 | vol. 7 | iss. 6 | e27189 | p. 5
(page number not for citation purposes)
XSL• FO
RenderXJMIR PUBLIC HEALTH AND SURVEILLANCE Benoni et al
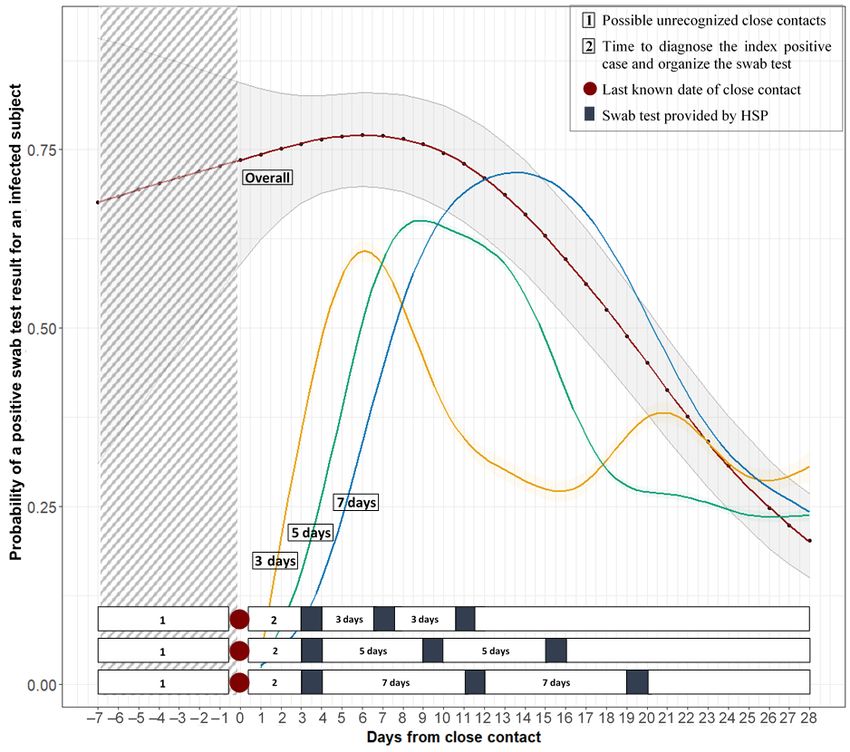
Figure 1. Graphical predictions from the generalized additive mixed models. The 4 curves represent the predicted probabilities of having a positive
test related to the number of days since the last known date of close contact among all health care workers infected with SARS-CoV-2 (overall curve)
and in the subgroups of those infected with SARS-CoV-2 with an initial negative swab test result in the 7-day standard surveillance interval and simulating
2 different time intervals of 3 and 5 days. The bars show the time course of the health surveillance program in the 3 different time intervals related to
the probability curves. HSP: health surveillance program.
The same model was used to analyze the change over time of and between the 13th and 14th days, respectively, with a
the probability of a positive swab test finding in the subset of probability of a positive swab test result of 0.61, 0.65, and 0.72,
HWs with an initial negative swab test result in the standard respectively (Figure 1). This probability then decreased with
HSP 7-day interval and in the alternative “simulated schedule time in all surveillance interval models except for the 3 day
time” for surveillance intervals of 3 days and 5 days (Table 3). interval, in which a secondary tail peak was obtained on the
21st day with a probability of 0.38. All the predicted model
In the 3 intervals (3, 5, and 7 days), the highest peak was
probabilities for the 3 assumed surveillance intervals and for
observed on the sixth day, between the ninth and tenth days,
days 1 to 28 from close contact are indicated in Table 3.
https://publichealth.jmir.org/2021/6/e27189 JMIR Public Health Surveill 2021 | vol. 7 | iss. 6 | e27189 | p. 6
(page number not for citation purposes)
XSL• FO
RenderXJMIR PUBLIC HEALTH AND SURVEILLANCE Benoni et al
Table 3. Predicted probabilities of the generalized additive mixed model for a positive swab test result for COVID-19 in relation with the number of
days since close contact with a patient with COVID-19, among infected health care workers from University Hospital of Verona (Italy) with an initial
negative swab test result (the model was fitted with data collected between February 29 and April 17, 2020). Three different scenarios were included
for the surveillance time interval (3, 5, and 7 days).
Day since close contact with a patient with COVID-19 3 days, π (0.95% CI) 5 days, π (0.95% CI) 7 days, π (0.95% CI)
1 0.07 (0.02-0.23) 0.03 (0.01-0.16) 0.03 (0.00-0.14)
2 0.17 (0.07-0.35) 0.07 (0.02-0.23) 0.05 (0.01-0.18)
3 0.34 (0.20-0.51) 0.15 (0.06-0.32) 0.09 (0.03-0.24)
4 0.50 (0.35-0.65) 0.26 (0.14-0.44) 0.15 (0.06-0.31)
5 0.59 (0.45-0.72) a 0.40 (0.25-0.56) 0.23 (0.12-0.41)
6 0.61 (0.46-0.75) 0.51 (0.37-0.66) 0.34 (0.20-0.51)
7 0.58 (0.42-0.72) 0.59 (0.45-0.72) 0.44 (0.30-0.60)
8 0.52 (0.36-0.67) 0.63 (0.48-0.76) 0.54 (0.39-0.67)
9 0.45 (0.31-0.61) 0.65 (0.49-0.78) 0.61 (0.47-0.73)
10 0.40 (0.27-0.54) 0.65 (0.47-0.79) 0.66 (0.51-0.78)
11 0.35 (0.24-0.49) 0.64 (0.45-0.79) 0.69 (0.54-0.81)
12 0.32 (0.20-0.46) 0.62 (0.43-0.77) 0.71 (0.55-0.83)
13 0.30 (0.18-0.45) 0.59 (0.40-0.75) 0.72 (0.54-0.84)
14 0.28 (0.16-0.45) 0.54 (0.37-0.71) 0.72 (0.53-0.85)
15 0.27 (0.14-0.46) 0.48 (0.33-0.64) 0.71 (0.52-0.85)
16 0.27 (0.14-0.47) 0.41 (0.28-0.57) 0.69 (0.49-0.84)
17 0.29 (0.14-0.50) 0.35 (0.23-0.50) 0.66 (0.46-0.82)
18 0.32 (0.15-0.55) 0.30 (0.19-0.45) 0.62 (0.43-0.78)
19 0.35 (0.15-0.61) 0.28 (0.16-0.43) 0.57 (0.39-0.74)
20 0.37 (0.16-0.65) 0.27 (0.15-0.43) 0.52 (0.35-0.68)
21 0.38 (0.15-0.69) 0.26 (0.14-0.44) 0.46 (0.31-0.62)
22 0.37 (0.12-0.71) 0.26 (0.14-0.45) 0.41 (0.27-0.56)
23 0.34 (0.10-0.72) 0.26 (0.13-0.45) 0.36 (0.24-0.51)
24 0.31 (0.07-0.73) 0.25 (0.12-0.45) 0.33 (0.21-0.48)
25 0.29 (0.06-0.74) 0.24 (0.10-0.46) 0.30 (0.18-0.45)
26 0.28 (0.05-0.75) 0.23 (0.09-0.47) 0.28 (0.16-0.43)
27 0.29 (0.04-0.78) 0.23 (0.08-0.50) 0.26 (0.14-0.42)
28 0.31 (0.04-0.82) 0.24 (0.08-0.54) 0.24 (0.13-0.41)
a
Italicized values indicate the days where the probability of testing positive for COVID-19 on the swab test peaks.
In our study sample, approximately half of the HWs who tested
Discussion positive were asymptomatic. The consistency of this finding
Principal Findings with those of previous studies [21,22] may justify the need to
test individuals regardless of clinical manifestation, especially
Identification and tracking of close contacts are a fundamental in a health care setting, to avoid disease spread from
strategy to prevent the spread of COVID-19. During the study asymptomatic cases [23].
period, approximately one-third of UHV HWs claimed that they
had close contact with a patient with COVID-19. Among them, The median time for the occurrence of symptoms, starting from
9.2% tested positive on the oronasopharyngeal swab test. Other the date of declared close contact, for symptomatic individuals
studies have reported similar results among HWs with regard was estimated to be 4 days. The incubation time of SARS-CoV-2
to both the occurrence of close contacts and the prevalence of is still being debated: a meta-analysis conducted mostly on
positive cases [17,18]. Nosocomial transmission of Chinese data estimated a mean incubation time of approximately
SARS-CoV-2 with outbreaks occurring in different wards has 5 days [24], while the European Centre for Disease Prevention
been reported in several countries [19,20].
https://publichealth.jmir.org/2021/6/e27189 JMIR Public Health Surveill 2021 | vol. 7 | iss. 6 | e27189 | p. 7
(page number not for citation purposes)
XSL• FO
RenderXJMIR PUBLIC HEALTH AND SURVEILLANCE Benoni et al
and Control reports a median incubation period between 5 and setting [33,34], a GAMM model was applied to investigate how
6 days, ranging from 2 to 14 days [25]. the probability of obtaining a positive swab test result may
change over time from the last known date of close contact of
RT–PCR analysis of oronasopharyngeal swab samples has been
that individual and ultimately to discern a possible “best time
recognized as the most reliable test to identify and ascertain
to test” after a close contact.
SARS-CoV-2 infection; however, the sensitivity and specificity
of the swab test are still being discussed [26,27]. Two reviews In our sample, the probability of a positive swab was 0.74 on
reported sensitivities ranging between 63% and 98% [28,29]. day 1 and peaked (0.77) between days 5 and 8 after close
The specificity of the test was reported to be higher (95%) [27]. contact. This high probability retrieved from the first day after
close contact can be explained by the fact that the contact
In this study, 58 swab tests yielded negative findings before a
causing infection may have occurred on a previous date than
positive finding was obtained in the subsequent test. The
the last one that was recognized and reported by the HW (Figure
false-negative rate (the test does not initially detect the infection
1). Individuals who test positive have shown to be infective
when one actually acquires it) in our sample was 22.3%. This
since the preclinical and subclinical stages of the disease
result may have different explanations apart from the intrinsic
[24,35,36], and it was reported that the replication rate of
sensitivity of the RT–PCR test. First, the rate of false-negative
SARS-CoV-2 peaks 2 days post infection, with an increase in
results may change in accordance with how long the infection
the virus titer detectable already in the first 24 h post inoculation
has been acquired. The time between the date of the close
[37]. Two studies conducted only on symptomatic individuals
contact and the date of the first specimen collection was not
reported the maximum probability of a positive swab test result
different between the 2 groups of positive and negative initial
in the initial days following the onset of symptoms [34,38].
swabs, with comparable demographic characteristics, thus
limiting the bias of an incorrect sampling timing (Table 1). In our sample, 25.7% and 4.7% of infected HWs required 2 and
However, some individuals may have presented a longer 3 tests, respectively, to be confirmed as positive, consistent with
incubation period before the virus could be detected in a test, a previous report [39]. Considering this group, the probability
thus leading to false-negative results despite the infection peak (0.72) was obtained approximately 13-14 days after close
already having been acquired. False-negative results are contact for the 7-day standard HSP surveillance interval.
influenced even by the sampling quality of the swab. In
When simulating a 3- and 5-day interval model, the probability
particular, when the viral load is low, the specimen collection
of obtaining a positive swab test result peaked on the fifth to
technique could be a source of diagnostic errors [30]. It is also
seventh and the ninth to tenth days, respectively. In the 3-day
worth noting that the RT–PCR assays used herein had a Ct of
interval model, the time of the highest probability was similar
40. The Ct is a semiquantitative value. A lower Ct value
to that estimated for the whole group of individuals who tested
corresponds to a higher quantity of viral genetic material in the
positive (Figure 1). The function for the 3-day interval shows
sample, which can be considered an approximation of the viral
2 peaks, one between days 5-7 and another on day 21 after close
load. However, viruses have been isolated from laboratory cell
contact. For screening intervals of 5 and 7 days, the function
cultures from samples exhibiting Ct values above 36 [31]. It
seems to include the 2 sets of swabs obtained on the same
may be possible that some of the samples, considered negative
individual to ascertain positivity first and negativity thereafter,
because of their high Ct, still had a very low quantity of viral
under a unique curve interval because of the wider intervals.
genetic material, which increased in the subsequent days. In the
Simulations of the screening time intervals narrower than the
study sample, the estimated probability of incorrectly ruling out
7-day standard HSP surveillance interval have shown that the
a case of COVID-19 on the basis of a false-negative test was
probability of testing positive can be detected earlier.
2.5%. Long et al [32] reported similar results upon assessing
678 patients who underwent repeated testing. It must be Limitations
considered that this probability is influenced by not only test One of the limitations of this study is that HWs have
sensitivity but also disease prevalence. self-reported the dates of close contact, which may have led to
Starting from the assumption that false-negative results may be recall bias errors. On the other hand, the HSP, by continuously
obtained, the median time to a positive swab test result was monitoring HWs over time, permitted the registration of the
measured in the whole group and then separately, distinguishing updated last dates of close contact and to identify true-negative
between HWs with an initially negative finding and those with cases. HWs who tested positive at least once were considered
an initially positive finding on the swab test. The estimated true-positive cases, consistent with a previous report [38], even
median time from close contact to the first positive test was 7 if the specificity of the swab test may have influenced the
days overall, 4 days in the group of HWs who presented an results.
initial positive result, and 10 days for those who presented an Contact tracing has been one of the main strategies to keep the
initial negative finding on the swab test. This can be partly pandemic under control; however, only a few studies have
attributed to the HSP that planned a swab every 7 days for investigated the relationship between close contact and a positive
individuals with close contact. The surveillance time interval swab test result. Monitoring of HWs through swab testing in
plays a crucial role in the detection of COVID-19–positive the hospital setting is particularly important because it may
individuals and influences the spread of the infection. prevent large-scale disease spread.
As a repeated testing strategy is considered important to
overcome false-negative results, especially in a health care
https://publichealth.jmir.org/2021/6/e27189 JMIR Public Health Surveill 2021 | vol. 7 | iss. 6 | e27189 | p. 8
(page number not for citation purposes)
XSL• FO
RenderXJMIR PUBLIC HEALTH AND SURVEILLANCE Benoni et al
Conclusions intervals between swabs in the first 10 days might be
This study is one of the first to explore the best scheduling time recommended, since negative results may be obtained initially.
in an HSP for HWs. A call for algorithms has been made to Many European countries are currently facing a third wave of
detail the exact pathway to monitor the safety of HWs [40]. In COVID-19. Ensuring the safety of patients and HWs and the
a hospital setting, several unrecognized close contacts that cause continuity of care are fundamental in this situation. The correct
infection may occur. Having shown that the probability of a use of the appropriate PPE is pivotal in preventing new
positive swab test result for COVID-19 is already high in the infections; however, when an accidental close contact with a
first days and peaks between the fifth and eighth days after the positive case occurs, it is mandatory to monitor HWs through
last known close contact, early testing, especially within this swab testing. Many positive individuals may be asymptomatic
time window would be advisable. Narrowing of surveillance or pauci-symptomatic; therefore, the recommendation is to test
all HWs regardless of their clinical manifestations.
Authors' Contributions
In this study, RB, S Panunzi, and IC conceptualized and designed the study, were responsible for the data analysis, and made
substantial contributions to drafting the manuscript. FM revised the manuscript critically and contributed substantially to the
interpretation of the data. GLC, GS, IC, and RB made substantial contributions to data collection. S Porru was responsible for
data management. ST revised the manuscript study critically and contributed to study conception.
Conflicts of Interest
None declared.
References
1. Rickman HM, Rampling T, Shaw K, Martinez-Garcia G, Hail L, Coen P, et al. Nosocomial Transmission of Coronavirus
Disease 2019: A Retrospective Study of 66 Hospital-acquired Cases in a London Teaching Hospital. Clin Infect Dis 2021
Feb 16;72(4):690-693 [FREE Full text] [doi: 10.1093/cid/ciaa816] [Medline: 32562422]
2. McMichael TM, Currie DW, Clark S, Pogosjans S, Kay M, Schwartz NG, Public Health–SeattleKing County‚
EvergreenHealth‚CDC COVID-19 Investigation Team. Epidemiology of Covid-19 in a Long-Term Care Facility in King
County, Washington. N Engl J Med 2020 May 21;382(21):2005-2011 [FREE Full text] [doi: 10.1056/NEJMoa2005412]
[Medline: 32220208]
3. Wake RM, Morgan M, Choi J, Winn S. Reducing nosocomial transmission of COVID-19: implementation of a COVID-19
triage system. Clin Med (Lond) 2020 Sep;20(5):e141-e145 [FREE Full text] [doi: 10.7861/clinmed.2020-0411] [Medline:
32788160]
4. Wang D, Hu B, Hu C, Zhu F, Liu X, Zhang J, et al. Clinical Characteristics of 138 Hospitalized Patients With 2019 Novel
Coronavirus-Infected Pneumonia in Wuhan, China. JAMA 2020 Mar 17;323(11):1061-1069 [FREE Full text] [doi:
10.1001/jama.2020.1585] [Medline: 32031570]
5. COVID-19 Dashboard by the Center for Systems Science and Engineering (CSSE) at Johns Hopkins University (JHU).
Johns Hopkins University and Medicine: Coronavirus Resource Center. URL: https://coronavirus.jhu.edu/map.html [accessed
2021-04-07]
6. Epidemia COVID-19 Aggiornamento nazionale 2 dicembre 2020. National Health Institute. URL: https://www.epicentro.iss.it/
coronavirus/bollettino/Bollettino-sorveglianza-integrata-COVID-19_5-gennaio-2021.pdf [accessed 2021-03-11]
7. Rivett L, Sridhar S, Sparkes D, Routledge M, Jones NK, Forrest S, CITIID-NIHR COVID-19 BioResource Collaboration,
et al. Screening of healthcare workers for SARS-CoV-2 highlights the role of asymptomatic carriage in COVID-19
transmission. Elife 2020 May 11;9:e58728 [FREE Full text] [doi: 10.7554/eLife.58728] [Medline: 32392129]
8. Heneghan C, Brassey J, Jefferson T. COVID-19: What proportion are asymptomatic? The Centre for Evidence-Based
Medicine. 2020 Apr 06. URL: https://www.cebm.net/covid-19/covid-19-what-proportion-are-asymptomatic [accessed
2021-03-11]
9. Elenco delle Gazzette pubblicate nel 2020. Gazzetta Ufficiale. URL: https://www.gazzettaufficiale.it/
ricercaArchivioCompleto/serie_generale/2020 [accessed 2021-02-18]
10. Porru S, Carta A, Monaco MGL, Verlato G, Battaggia A, Parpaiola M, et al. Health Surveillance and Response to
SARS-CoV-2 Mass Testing in Health Workers of a Large Italian Hospital in Verona, Veneto. Int J Environ Res Public
Health 2020 Jul 15;17(14):5104 [FREE Full text] [doi: 10.3390/ijerph17145104] [Medline: 32679773]
11. Procedura regionale Nuovo Coronavirus (SARS-CoV-2). Regione Del Veneto. 2020 Mar 13. URL: https://hsancamillo.it/
wp-content/uploads/2020/03/Procedura-regionale-Covid-19-rev._03-13.3.2020.pdf [accessed 2021-02-18]
12. Interim Guidelines for Collecting and Handling of Clinical Specimens for COVID-19 Testing. Centers for Disease Control
and Prevention. 2021 Feb 26. URL: https://www.cdc.gov/coronavirus/2019-ncov/lab/guidelines-clinical-specimens.html
[accessed 2021-01-14]
13. Rapporti ISS COVID-19. Istituto Superiore di Sanità. URL: https://www.iss.it/rapporti-covid-19 [accessed 2021-03-11]
https://publichealth.jmir.org/2021/6/e27189 JMIR Public Health Surveill 2021 | vol. 7 | iss. 6 | e27189 | p. 9
(page number not for citation purposes)
XSL• FO
RenderXJMIR PUBLIC HEALTH AND SURVEILLANCE Benoni et al
14. 03/14/2020: Lab Update: Interim Laboratory Biosafety Guidelines for Handling and Processing Specimens Associated
with Coronavirus Disease (COVID-19). Centers for Disease Control and Prevention. URL: https://www.cdc.gov/csels/dls/
locs/2020/interim_guidelines_for_handling_and_processing_covid-19_specimens.html [accessed 2021-03-11]
15. Elenco delle Gazzette pubblicate nel 2020. Gazzetta Ufficiale. URL: https://www.gazzettaufficiale.it/
ricercaArchivioCompleto/serie_generale/2020 [accessed 2021-03-11]
16. Lin X, Zhang D. Inference in generalized additive mixed modelsby using smoothing splines. J Royal Statistical Soc B 1999
Apr;61(2):381-400. [doi: 10.1111/1467-9868.00183]
17. Mandić-Rajčević S, Masci F, Crespi E, Franchetti S, Longo A, Bollina I, et al. Source and symptoms of COVID-19 among
hospital workers in Milan. Occup Med (Lond) 2020 Dec 30;70(9):672-679 [FREE Full text] [doi: 10.1093/occmed/kqaa201]
[Medline: 33269398]
18. Suárez-García I, Martínez de Aramayona López MJ, Sáez Vicente A, Lobo Abascal P. SARS-CoV-2 infection among
healthcare workers in a hospital in Madrid, Spain. J Hosp Infect 2020 Oct;106(2):357-363 [FREE Full text] [doi:
10.1016/j.jhin.2020.07.020] [Medline: 32702465]
19. Wang X, Zhou Q, He Y, Liu L, Ma X, Wei X, et al. Nosocomial outbreak of COVID-19 pneumonia in Wuhan, China. Eur
Respir J 2020 Jun;55(6):2000544 [FREE Full text] [doi: 10.1183/13993003.00544-2020] [Medline: 32366488]
20. Schwierzeck V, König JC, Kühn J, Mellmann A, Correa-Martínez CL, Omran H, et al. First Reported Nosocomial Outbreak
of Severe Acute Respiratory Syndrome Coronavirus 2 in a Pediatric Dialysis Unit. Clin Infect Dis 2021 Jan 27;72(2):265-270
[FREE Full text] [doi: 10.1093/cid/ciaa491] [Medline: 33501962]
21. Oran DP, Topol EJ. Prevalence of Asymptomatic SARS-CoV-2 Infection : A Narrative Review. Ann Intern Med 2020 Sep
01;173(5):362-367 [FREE Full text] [doi: 10.7326/M20-3012] [Medline: 32491919]
22. Lavezzo E, Franchin E, Ciavarella C, Cuomo-Dannenburg G, Barzon L, Del Vecchio C, Imperial College COVID-19
Response Team, Imperial College COVID-19 Response Team. Suppression of a SARS-CoV-2 outbreak in the Italian
municipality of Vo'. Nature 2020 Aug;584(7821):425-429. [doi: 10.1038/s41586-020-2488-1] [Medline: 32604404]
23. Meyers KJ, Jones ME, Goetz IA, Botros FT, Knorr J, Manner DH, et al. A cross-sectional community-based observational
study of asymptomatic SARS-CoV-2 prevalence in the greater Indianapolis area. J Med Virol 2020 Nov;92(11):2874-2879
[FREE Full text] [doi: 10.1002/jmv.26182] [Medline: 32543722]
24. He W, Yi GY, Zhu Y. Estimation of the basic reproduction number, average incubation time, asymptomatic infection rate,
and case fatality rate for COVID-19: Meta-analysis and sensitivity analysis. J Med Virol 2020 Nov;92(11):2543-2550
[FREE Full text] [doi: 10.1002/jmv.26041] [Medline: 32470164]
25. Infection. European Centre for Disease Prevention and Control. URL: https://www.ecdc.europa.eu/en/covid-19/latest-evidence/
infection [accessed 2021-03-11]
26. Peñarrubia L, Ruiz M, Porco R, Rao SN, Juanola-Falgarona M, Manissero D, et al. Multiple assays in a real-time RT-PCR
SARS-CoV-2 panel can mitigate the risk of loss of sensitivity by new genomic variants during the COVID-19 outbreak.
Int J Infect Dis 2020 Aug;97:225-229 [FREE Full text] [doi: 10.1016/j.ijid.2020.06.027] [Medline: 32535302]
27. Watson J, Whiting PF, Brush JE. Interpreting a covid-19 test result. BMJ 2020 May 12;369:m1808. [doi: 10.1136/bmj.m1808]
[Medline: 32398230]
28. Mawaddah A, Gendeh HS, Lum SG, Marina MB. Upper respiratory tract sampling in COVID-19. Malays J Pathol 2020
Apr;42(1):23-35 [FREE Full text] [Medline: 32342928]
29. Arevalo-Rodriguez I, Buitrago-Garcia D, Simancas-Racines D, Zambrano-Achig P, Del Campo R, Ciapponi A, et al.
False-negative results of initial RT-PCR assays for COVID-19: A systematic review. PLoS One 2020;15(12):e0242958
[FREE Full text] [doi: 10.1371/journal.pone.0242958] [Medline: 33301459]
30. Basso D, Aita A, Navaglia F, Franchin E, Fioretto P, Moz S, et al. SARS-CoV-2 RNA identification in nasopharyngeal
swabs: issues in pre-analytics. Clin Chem Lab Med 2020 Aug 27;58(9):1579-1586. [doi: 10.1515/cclm-2020-0749] [Medline:
32573469]
31. Cycle threshold (Ct) in SARS-CoV-2 RT-PCR. Public Health England. 2020 Oct 28. URL: https://www.gov.uk/government/
publications/cycle-threshold-ct-in-sars-cov-2-rt-pcr [accessed 2021-03-11]
32. Long DR, Gombar S, Hogan CA, Greninger AL, O'Reilly-Shah V, Bryson-Cahn C, et al. Occurrence and Timing of
Subsequent Severe Acute Respiratory Syndrome Coronavirus 2 Reverse-transcription Polymerase Chain Reaction Positivity
Among Initially Negative Patients. Clin Infect Dis 2021 Jan 27;72(2):323-326 [FREE Full text] [doi: 10.1093/cid/ciaa722]
[Medline: 33501950]
33. Liu R, Han H, Liu F, Lv Z, Wu K, Liu Y, et al. Positive rate of RT-PCR detection of SARS-CoV-2 infection in 4880 cases
from one hospital in Wuhan, China, from Jan to Feb 2020. Clin Chim Acta 2020 Jun;505:172-175 [FREE Full text] [doi:
10.1016/j.cca.2020.03.009] [Medline: 32156607]
34. Wikramaratna P, Paton S, Ghafari M, Lourenço J. Estimating the false-negative test probability of SARS-CoV-2 by RT-PCR.
Euro Surveill 2020 Dec;25(50):2000568 [FREE Full text] [doi: 10.2807/1560-7917.ES.2020.25.50.2000568] [Medline:
33334398]
35. Zhang J, Litvinova M, Wang W, Wang Y, Deng X, Chen X, et al. Evolving epidemiology and transmission dynamics of
coronavirus disease 2019 outside Hubei province, China: a descriptive and modelling study. Lancet Infect Dis 2020
Jul;20(7):793-802 [FREE Full text] [doi: 10.1016/S1473-3099(20)30230-9] [Medline: 32247326]
https://publichealth.jmir.org/2021/6/e27189 JMIR Public Health Surveill 2021 | vol. 7 | iss. 6 | e27189 | p. 10
(page number not for citation purposes)
XSL• FO
RenderXJMIR PUBLIC HEALTH AND SURVEILLANCE Benoni et al
36. Lowe CF, Matic N, Ritchie G, Lawson T, Stefanovic A, Champagne S, et al. Detection of low levels of SARS-CoV-2 RNA
from nasopharyngeal swabs using three commercial molecular assays. J Clin Virol 2020 Jul;128:104387 [FREE Full text]
[doi: 10.1016/j.jcv.2020.104387] [Medline: 32380382]
37. Milewska A, Kula-Pacurar A, Wadas J, Suder A, Szczepanski A, Dabrowska A, et al. Replication of Severe Acute Respiratory
Syndrome Coronavirus 2 in Human Respiratory Epithelium. J Virol 2020 Jul 16;94(15):e00957 [FREE Full text] [doi:
10.1128/JVI.00957-20] [Medline: 32434888]
38. Kucirka LM, Lauer SA, Laeyendecker O, Boon D, Lessler J. Variation in False-Negative Rate of Reverse Transcriptase
Polymerase Chain Reaction-Based SARS-CoV-2 Tests by Time Since Exposure. Ann Intern Med 2020 Aug
18;173(4):262-267 [FREE Full text] [doi: 10.7326/M20-1495] [Medline: 32422057]
39. Li Y, Yao L, Li J, Chen L, Song Y, Cai Z, et al. Stability issues of RT-PCR testing of SARS-CoV-2 for hospitalized patients
clinically diagnosed with COVID-19. J Med Virol 2020 Jul;92(7):903-908 [FREE Full text] [doi: 10.1002/jmv.25786]
[Medline: 32219885]
40. Bielicki JA, Duval X, Gobat N, Goossens H, Koopmans M, Tacconelli E, et al. Monitoring approaches for health-care
workers during the COVID-19 pandemic. Lancet Infect Dis 2020 Oct;20(10):e261-e267 [FREE Full text] [doi:
10.1016/S1473-3099(20)30458-8] [Medline: 32711692]
Abbreviations
Ct: cycle threshold
GAMM: generalized additive mixed model
HSP: health surveillance program
HW: health care worker
PPE: personal protective equipment
RT–PCR: reverse transcriptase–polymerase chain reaction
UHV: University Hospital of Verona
Edited by T Sanchez; submitted 14.01.21; peer-reviewed by J Yang, S Case; comments to author 26.02.21; revised version received
08.04.21; accepted 03.05.21; published 03.06.21
Please cite as:
Benoni R, Panunzi S, Campagna I, Moretti F, Lo Cascio G, Spiteri G, Porru S, Tardivo S
The Effect of Test Timing on the Probability of Positive SARS-CoV-2 Swab Test Results: Mixed Model Approach
JMIR Public Health Surveill 2021;7(6):e27189
URL: https://publichealth.jmir.org/2021/6/e27189
doi: 10.2196/27189
PMID: 34003761
©Roberto Benoni, Silvia Panunzi, Irene Campagna, Francesca Moretti, Giuliana Lo Cascio, Gianluca Spiteri, Stefano Porru,
Stefano Tardivo. Originally published in JMIR Public Health and Surveillance (https://publichealth.jmir.org), 03.06.2021. This
is an open-access article distributed under the terms of the Creative Commons Attribution License
(https://creativecommons.org/licenses/by/4.0/), which permits unrestricted use, distribution, and reproduction in any medium,
provided the original work, first published in JMIR Public Health and Surveillance, is properly cited. The complete bibliographic
information, a link to the original publication on https://publichealth.jmir.org, as well as this copyright and license information
must be included.
https://publichealth.jmir.org/2021/6/e27189 JMIR Public Health Surveill 2021 | vol. 7 | iss. 6 | e27189 | p. 11
(page number not for citation purposes)
XSL• FO
RenderXYou can also read