The Evolving Video Landscape: The Shift to Connected TV - Marketplace Intelligence Brief
←
→
Page content transcription
If your browser does not render page correctly, please read the page content below

The Evolving Video Landscape: The Shift to Connected TV
              Marketplace Intelligence Brief

                   By Ben Hovaness and Al Lau
                              April 19th, 2021

            195 Broadway • 8th Floor • New York • New York • 10007   OmnicomMediaGroup.com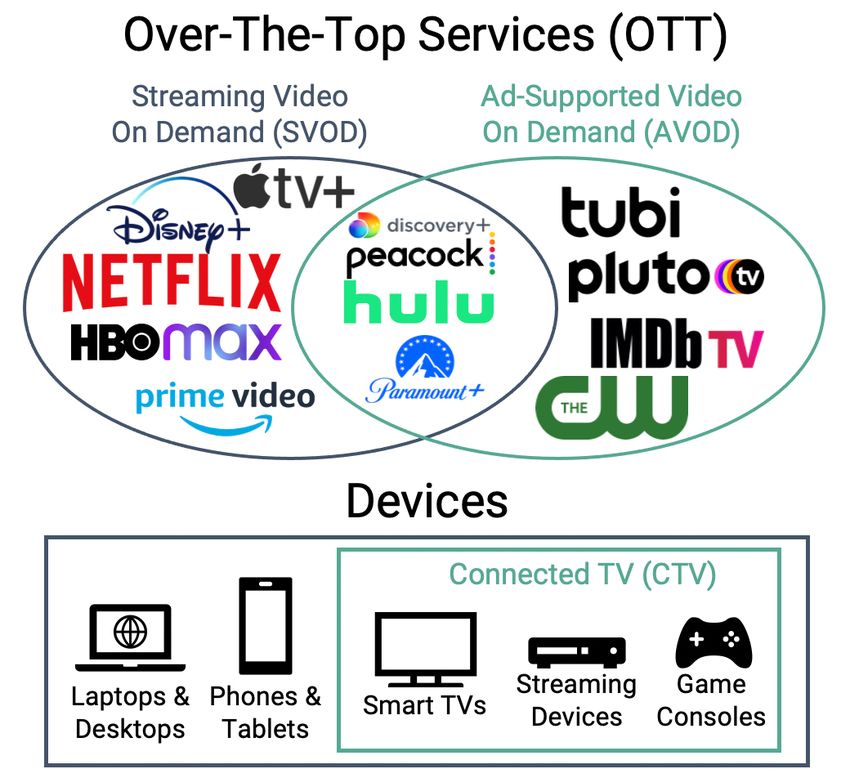
Marketplace Intelligence Brief
The Evolving Video Landscape: The Shift to Connected TV
By Ben Hovaness and Al Lau

EXECUTIVE SUMMARY

Linear TV viewing is in decline. Consumers are spending just as much time in front of their televisions,
but the content they are consuming has changed: more time than ever is spent with TV-connected
devices, or “CTV” for short. While linear TV still makes up the bulk of viewing hours for adults 18+ (30
hours per week), the amount of time spent with CTV is now more than 12.5 hours per week.1 And when
we look at the viewing behavior of younger Americans, people 18-34 now spend more time with CTV than
watching linear TV. The good news is that that 2021 marks the first year that advertisers are able to buy
CTV ads against all the same entertainment content they are accustomed to buying on linear networks,
thanks to a new generation of “over-the-top” (OTT) media platforms.

The consumption trend away from linear and towards CTV has been driven by a few key developments:
the wide availability of high-speed internet capable of delivering an HD video signal, the ubiquity of smart
TVs and cheap connected devices like streaming sticks, and the popularity of early entrants to the
entertainment CTV space like Netflix and Amazon Prime Video. The major media companies like Disney,
ViacomCBS, NBCU, Time Warner and Discovery have responded to these developments by launching
internet-delivered OTT video offerings that offer all the content consumers are accustomed to seeing on
linear TV as well as OTT exclusives: Disney+ and Hulu, Paramount+, Peacock, HBO Max and Discovery+.
While we think these new OTT offerings have a bright future in the ads marketplace, there are two
broader insights for advertisers, tied to these developments:

      1. The Decline of Linear Viewership Will Accelerate
         Between 2015 and 2020, the linear ad supply of impressions against adults 18-49 shrank by more
         than 40%. It is worth noting that this decline occurred during a period of significant content
         exclusivity for linear TV – consumers who abandoned linear TV were giving up quite a lot of
         content not available on OTT services! Now that every major media company has launched or is
         launching an OTT offering focused on entertainment, we anticipate that the rate of decline in
         linear viewership is going to accelerate. Our view is that news and sports – the two content types
         that will remain largely exclusive to linear TV – will be insufficient to retain most viewers. Given all
         this, advertisers should prepare for linear rate inflation to accelerate over the coming years.
      2. The Migration to CTV and OTT Viewing Will Compress Ad Supply
         To some extent, the migration from linear TV to OTT is simply a change in content distribution:
         instead of watching a TV show on a channel, users pick a show in an OTT app’s user interface and
         start streaming it. But OTT isn’t just a different user experience – it is fundamentally a different
         kind of distribution, one-to-one rather than broadcast. That gives media property owners the
         ability to offer both ad-free and ad-supported versions of their new services in a way that was
         impractical with linear TV, improving their ability to maximize revenue through price
         segmentation. We anticipate that at least 30% of subscribers to these OTT services will opt to pay
         more for an ad free experience. This means that in aggregate, assuming that a) OTT viewership

1
    Nielsen Total Audience Report Q3 2020, pg. 3

                                    195 Broadway • 8th Floor • New York • New York • 10007   OmnicomMediaGroup.com
grows to replace present linear viewership and b) ad loads are stable (ad minutes per hour of
content), video ad supply is going to shrink.
These twin trends indicate a few key recommendations for advertisers:
1. Diversify Upfront Investment to the New OTT Platforms
The accelerating decline of linear ratings will make a linear-only upfront less reliable as a means
of guaranteeing ads delivery. This is straightforward enough – the more volatile ratings become,
the harder it is for sellers to accurately predict ad delivery and fulfillment of upfront commitments.
We have already seen this phenomenon over the past several years, as sellers have chronically
fallen short on delivery and have accumulated liability in the form of ADUs. And the shrinking
reach of the typical linear program increases over-frequency problems. Despite these challenges,
abandoning the upfront is not the answer. We recommend that our clients diversify their upfront
investment to include these OTT services such as Peacock, Paramount+, etc. to gain exposure to
the upside of these platforms’ success. To manage risk, we further recommend that advertisers
negotiate flexibility of delivery and increased cancellation options in their upfront negotiations this
year.
2. Reconsider the Role of Integrations, Custom Content, and Sponsorships
Custom content, sponsorships, integrations: none of these are new to advertisers. What is new,
however, is the diminished role that traditional advertising breaks will play in the new video
landscape. With viewership of any given show fragmented across both ad-supported and ad-free
viewers, buying an ad against a piece of content no longer guarantees that it will reach the full
audience. Product placement and sponsorships offer a way out of this audience fragmentation by
embedding the advertiser’s offering or message in the content itself. We recommend that
advertisers reconsider the role of integrations, custom content, and sponsorships in their video
advertising investment, with an eye towards expanding it over the coming years. Advertisers can
and should include these sorts of arrangements in their upfront negotiations.
3. Expand Video Investment Beyond Traditional TV Media Sellers
While the major media conglomerates have all created OTT video offerings, and we recommend
diversifying upfront spend to include them, it is highly unlikely these companies will ever fully
reproduce their historical supply of TV ad inventory. This supply constraint indicates that
advertisers should further diversify their spend in the living room to a broader set of media
partners. YouTube, Roku, and IMDb TV (among others) all offer large audiences and competitive
CPMs. Advertisers can access a wide variety of smaller CTV properties programmatically,
aggregating reach across a number of supply sources. We recommend advertisers critically
evaluate their current mix of TV investments, and aggressively diversify their investment on TV
and TV-connected devices to boost their exposure to increasing CTV ad supply.
195 Broadway • 8th Floor • New York • New York • 10007 OmnicomMediaGroup.com2
2
“Devices” portion of this figure adapted from an IAB tech lab article
195 Broadway • 8th Floor • New York • New York • 10007 OmnicomMediaGroup.comBACKGROUND
The Audience Is Shifting Out of Linear TV
Linear TV has seen a steady audience decline over the last several years. The erosion began with the
fragmentation of cable networks, and continued as time-delayed viewership (enabled by ubiquitous
DVRs) caused enough disruption to change the currency metric. Now audiences are migrating outside of
traditionally delivered channels altogether. More households have dropped cable subscription for
choices available in a Broadband-Only (BBO) setting, Nielsen’s designation for cord-cutters and cord-
nevers. This has created a net loss of audience for ad-supported content available for purchase by
advertisers. Over the past year, the COVID-19 pandemic has accelerated this long-running shift out of
linear TV consumption. Since Nielsen began measuring and reporting on non-linear television usage,
devices (which includes DVR, DVD, and Game Consoles) and OTT TV (Over The Top, which consists of
Smart TV, media sticks and boxes) have both gained a significant share of viewership and usage. Among
adults 18-49, OTT and connected devices now account for nearly half of consumption. And for those 18-
34, the share is now more than half.3
TV Usage by Device, A18-49 TV Usage by Device, A18-34
100% 0% 0% 0% 2% 100% 0% 0% 0% 3%
5% 8% 6%
11% 10%
17% 15% 14%
90% 19% 21% 90% 20% 22% 19%
21% 27% 26%
21% 25% 32%
21% 25%
80% 21% 80%
24%
21% 25%
70% 19% 70% 25%
18%
23%
60% 60%
22%
50% 100% 50% 100%
40% 83% 81% 40% 80%
76% 78%
74% 72% 72%
68% 69% 66%
64%
30% 60% 30% 61%
55% 56%
51%
46%
20% 20%
10% 10%
0% 0%
4Q11 4Q12 4Q13 4Q14 4Q15 4Q16 4Q17 4Q18 4Q19 4Q20 4Q11 4Q12 4Q13 4Q14 4Q15 4Q16 4Q17 4Q18 4Q19 4Q20
Linear Devices OTT Linear Devices OTT
The TV Upfront Process: Origins and Challenges
Every spring since 1962, advertisers and agencies have gathered with major broadcast networks to
review the upcoming fall lineup of programming and anticipated ad inventory. “Upfront” deals were
initially struck to help advertisers secure inventory they can rely on for their marketing plans. Agencies
helped coordinate all the details of the upfront deal structure and execute the buys accordingly. And
networks were able to estimate their upcoming revenue for future content investments.
Over time, media fragmentation has changed the upfront structure dramatically. First, it was getting
cable networks involved in the process as viewership grew. Then the Newfronts were formed to help
3
Nielsen data
195 Broadway • 8th Floor • New York • New York • 10007 OmnicomMediaGroup.comdigital media vendors to get a share of upfront spending commitments. Now the major media
conglomerates are trying to spread upfront commitments across their vast multimedia empires. As the
marketplace changes, in many ways the linear market stays the same. The traditional linear market still
functions in a supply and demand model to determine pricing: we have seen the drop in ad supply
materialize as higher prices, because demand continues to outpace supply.
With shrinking viewership and available Linear Inventory 2015-2020
inventory, over the past 25 years upfront
3.0
pricing has seen increases every year
Millions
except for the BY0102 and BY0910
2.5
seasons (those years had steep drops in
demand induced by negative
2.0
A18-49 GRPs
macroeconomic conditions). For the past
BY2021 upfront, there were also some 1.5
demand decreases, but the market
managed to keep the pricing at flat or at a 1.0
slight increase.
0.5
Between 2015 and 2020, the total
available linear ad supply for the A18-49 0.0
demographic shrank by 40%. Upfront 2015 2016 2017 2018 2019 2020
buying does allow advertisers to better
secure inventory than taking their chances in the scatter market, but most networks faced audience
shortfalls at a level that outstripped their upfront commitments. This has resulted in high level of
liabilities that are carried over from one year to the next.
CTV: Definitions and Development
Connected Television or CTV is how we describe video programming delivered over the internet and
displayed on a TV. The term is inclusive of content delivered by a TV’s own smart apps, as well as
content delivered by an external device like a Roku stick or Apple TV. OTT refers to internet-delivered
video programming, regardless of device. By way of example, Hulu viewed on an iPad is OTT but not
CTV, while YouTube viewed on a TV is both CTV and OTT.
The CTV category has seen tremendous growth over the past few years, fueled by technological
improvements and increased content availability. The expansion of broadband deployment around the
US has increased the typical home download speed to ~120Mbps, far more than the ~20Mbps required
to stream a 4K program. Connected devices (Roku, Fire stick, etc.) and Smart TVs (TVs with internet
connectivity and applications) have both become ubiquitous and cheap – in fact, it is now difficult to find
a new TV lacking smart features. These twin developments in internet connectivity and consumer
electronics resolved the longstanding technical challenges that had historically kept internet-delivered
video out of the living room.
On the content side, the low cost of entry to Netflix and Amazon Prime combined with their large and
growing content libraries have made it easier for consumers to shift away from a traditional cable
subscription. These companies are the biggest players in the SVOD, or non-ad-supported, OTT space.
195 Broadway • 8th Floor • New York • New York • 10007 OmnicomMediaGroup.comWhen it comes to ad-supported content, at the high end services like Hulu, Peacock, and peer offerings
provide a brand-safe environment with content similar to a typical network. At the more affordable end of
the price spectrum, there are a number of CTV channels hosted by the likes of Roku and YouTube which
offer the same type of inventory at a lower price point. In CTV advertising, there is a flavor for every taste.
INSIGHTS
The Decline of Linear Viewership Will Accelerate
Our view is that in retrospect, 2019-2021 will be seen as the period when the CTV space started to
mature. Consider a sampling of the platforms that have launched during this period: Disney+ and Apple
TV+ in 2019, HBO Max, Peacock and AMC+ in 2020, and Discover+ and Paramount+ in 2021.
We anticipate this maturation will accelerate CTV consumption growth over and above the trend to date.
And this acceleration in CTV consumption is also going to accelerate the decline of linear TV viewership.
Broadly speaking, we think two types of consumers will be driving this trend:
1. Cord-cutters and cord-nevers: The phenomenon of households dropping their Pay-TV service (or
never acquiring it at all) is having a large impact on linear TV scale. eMarketer estimates4 that by
the end of 2020, cord-cutters accounted for 30.1 million households, or about 24% of the US total.
And they project that by the end of 2022, that number will be closer to be 29%. Another way of
expressing this is that by the end of next year, Pay-TV households will account for about 54% of
the total, down from 80% in 2015. That means sharply fewer people to drive viewership.
2. Cord-shavers: Linear TV consumption isn’t an all-or-nothing proposition; consumers also have the
option to reduce the scale of their Pay-TV packages as their viewing preferences change. And an
added incentive for change now upon us. For the last several years a large portion of high-quality
entertainment content produced by the major media conglomerates was available exclusively via
their linear and Pay-TV networks. Now that these companies are launching OTT services loaded
with both their back catalogs and an array of exclusive content, materially all entertainment
content will soon be available via CTV. Given the observed consumer preference for OTT
platforms, this transition is naturally going to shift viewership to these new platforms at the
expense of linear consumption. News and sports will be left as the two remaining anchors of the
linear bundle. Those will likely be sufficient to retain many Pay-TV subscribers, but not to maintain
present linear consumption levels.
We think the combination of a reduced pool of Pay-TV subscribers and declining consumption by the
subscribers who remain will accelerate linear ratings declines for the foreseeable future.
4
eMarketer data on Pay-TV households in the US
195 Broadway • 8th Floor • New York • New York • 10007 OmnicomMediaGroup.comThe Migration to CTV and OTT Viewing Will Compress Ad Supply
Ad supply as we experience it on the buy side is a function of two variables: ad-supported viewing hours
(the total number of hours consumers spend watching ad-supported content) and ad load (the number
of ad minutes per hour). Ad-supported viewing hours, multiplied by ad load, yields the total quantity of ad
supply available. We expect that the migration to CTV and OTT viewing will certainly reduce the former
and probably reduce the latter, at least in the near term.
Declining ad-supported viewing hours will be a direct
product of the migration from linear to CTV/OTT
viewership. Media companies are taking advantage of
the 1:1 relationships afforded by internet distribution to
segment their services into ad-free and ad-supported
offerings. This serves their business interests by
enabling a degree of price segmentation (mapping
product prices to consumer-willingness-to-pay) which
was impossible in the linear era. The diagram to the
right is a stylized illustration of the business logic.
Hulu was the first major OTT service to implement this
segmentation strategy in 2015 with two price points,
one ad-free and the other ad-supported. The new OTT
offerings from peer media companies are largely
following suit, as the table below summarizes:
Disney+ Hulu Peacock HBO Max Paramount+ Discovery+
Ad-free $8 $12 $10 $15 $10 $7
Ad-supported N/A $6 $0/$5 TBA June ‘21 $6 $5
We can’t know for certain how consumers will split
Hulu's Experience:
across the ad-free and ad-supported variants, but we
Ad-supported vs. Ad-free Subscribers
can make some informed guesses. In 2019, a Hulu
executive indicated that 70% of their subscribers are on
the ad-supported offering, with 30% on the ad-free
version. We think that is a reasonable baseline for
30%
platforms with similar pricing deltas, such as
Paramount+. It remains to be seen how consumers will
split across services with very large deltas like Peacock
($10 vs. $0) and small deltas like Discovery+ ($7 vs.
70%
$5). Regardless, a substantial fraction of subscribers to ad-supported
each of these platforms will never generate ad-
supported viewing hours. That is going to put
downward pressure on ad supply.
Ad load is the other variable in the ad supply equation.
We know that in linear television, national ad loads average about 12 minutes per hour. Comparisons to
195 Broadway • 8th Floor • New York • New York • 10007 OmnicomMediaGroup.comstreaming platforms are difficult since ad loads there are not reliably measured. Anecdotally, though, ad
loads appear to be lower on these OTT platforms than on their linear counterparts. Peacock’s launch, for
instance, was accompanied by an announcement of the “industry’s lowest ad loads of five minutes per
hour,” or about 40% of the linear average. Hulu has about 10 minutes per hour, or 83% of the linear
average. We aren’t aware of any counterexamples of OTT platforms that offer equal or greater ad loads
compared with linear TV.
These twin OTT trends – a decreasing number of ad-supported viewing hours, and reduced ad loads –
will inevitably compress ad supply. The new OTT services will become an important part of our
investment approach but will not, by themselves, be a solution to our chronic TV supply challenges.
RECOMMENDATIONS FOR ADVERTISERS
Diversify Upfront Investment to the New OTT Platforms
Shrinking linear viewership reduces the value of the media channel in a number of ways: increasing
prices, decreasing reach, and increasing over-frequency serving of consumers. The latter two points are
less obvious, but equally important to the linear value proposition: the fewer people that a broadcast
program reaches, the lower the chances that it is delivering incremental reach to an advertiser’s
campaign. For that reason, cable networks with lower reach have historically been much cheaper in CPM
terms than their wider-reaching broadcast counterparts. The decline in linear reach increases over-
frequency wasted impressions, served to consumers who are already past the point of saturation.
The new OTT platforms give advertisers Projected Reach Against A18+ For a Sample
the ability to regain this lost living room 4-Week TV Campaign in BY2122,
reach. This chart shows the projected Linear-only vs. Linear + CTV
household reach % against adults 18+ for
50%
a sample linear buy on its own compared
with what is possible when CTV is added 45%
to the mix: Reach is boosted by over 54%.5 40% +54%
Reach % of Adults 18+
35%
Transitioning to OTT platforms also
enables technological improvements to 30%
frequency control, because ads there are 25%
delivered on a 1:1 basis. That means 47.1%
20%
platform owners are able to control ad
frequency at the user-level, which is simply 15% 30.6%
not possible in the linear world. While the 10%
implementation of frequency controls is up 5%
to each OTT platform and therefore bears
scrutiny, the potential for waste reduction 0%
is enormous. Linear TV Only Linear TV + CTV
An upfront approach excessively focused on linear media also exposes advertisers to the challenge of
increased volatility. As linear ratings have declined over the past several years, media sellers have
5
Internal OMG projections
195 Broadway • 8th Floor • New York • New York • 10007 OmnicomMediaGroup.comchronically overestimated – by a large margin – how much supply they would have to sell to advertisers.
Advertisers bought based on those projections but didn't receive the full quantity of impressions that
they had been promised. As a result, liability has been accumulating. Now in 2021, with an acceleration
of the ratings decline imminent, we believe sellers’ projections of linear ratings will be even less reliable
than before.
All of these trends indicate that advertisers should diversify their upfront investments to the new OTT
platforms. In their negotiations, advertisers should push for maximum flexibility of delivery across
services (while not being compelled to shift), and improved cancellation options in the event ratings
declines accelerate even faster than anticipated. Finally, we recommend that advertisers demand
payment-for-delivery terms. The current practice of payment for estimates, combined with rates of linear
underdelivery now commonly exceeding 10%, means that advertisers are in effect making enormous
advance payments to media sellers. We are confident our clients can find better uses for that capital.
Reconsider the Role of Integrations, Custom Content, and Sponsorships
Increasing consumer adoption of ad-free TV experiences means that advertisers should reconsider the
role of integrations, custom content, and sponsorships in their media mix. In the past, advertising against
a particular show meant that you would reach all of its viewership. But in a world where 30% or more of
CTV viewers on ads-optional platforms are paying a premium to avoid ads, there is added element of
audience fragmentation to reckon with. That means that integrations and custom content are going to
be more important than ever to reach consumers of entertainment programming. Brands will need to
work closely with TV platforms (OTT or otherwise) to identify shows and films that appeal to their
audience, share similar ideals, and can lift brand perception through borrowed equity of show, film, or
character.
Fortunately, OMG has deep institutional expertise in this area. We have decades of experience in
leveraging client media investments to unlock high profile tent poles, scripted integrations, co-marketing
deals and now, a strong push by many clients to develop original programming on non-ad supported
platforms and ad supported. We have also worked with every major production studio – including Netflix
Originals – to identify these opportunities.
For most of our clients, of course, this type of spending is nothing new. But we think this is the moment
to reconsider where such efforts live in the planning process. If more and more entertainment content is
going to be consumed in an ad-free context, advertisers need to approach strategic media planning with
an eye to aggregate consumer attention rather than defaulting to a lens of total impression or GRP
tonnage.
Expand Video Investment Beyond Traditional TV Media Sellers
We think that advertisers should take another look at their TV investment portfolios in light of these
developments. Shrinking ad supply from the major media companies – created by both linear declines
and the compression of ad caused by the migration to OTT – suggests that it is a good idea to cast a
wider net on CTV. At OMG, we make CTV ad products available for purchase in a variety of ways. The
Enterprise Partnerships team has favorable fixed and auction-based rates exclusive to OMG clients.
Outside of such arrangements, many sellers like YouTube will also auction off their CTV inventory at
195 Broadway • 8th Floor • New York • New York • 10007 OmnicomMediaGroup.comdynamic prices purely set by market forces. On the linear side, by comparison, many advertisers are used
to their own legacy pricing on key vendors – subject, of course, to an annual rate of change. As those
rates of change inflate each year, many CTV ad products are becoming increasingly price-competitive
and attractive, even in the absence of legacy pricing.
Each advertiser will have to make their own determination about the right mix. Advertisers with lower TV
base rates have less incentive to migrate to partners that do not have an advertiser-specific rate card.
But even for advertisers with the very lowest TV rates, we think there are substantial untapped
opportunities in the world of CTV, especially on the programmatic side. Omnicom account teams can
help each of our clients make the price comparison and evaluate the balance of their video investments.
As with any market, there are inefficiencies here that can be tapped to the benefit of savvy advertisers.
Conclusion
The shift in media consumption to CTV devices and OTT platforms is going to create challenges for
advertisers. Media strategies that were heavily dependent on low legacy base rates with TV sellers are
going to encounter increasing headwinds. Advertisers that have not been able to figure out how to
generate a return from digital advertising are going to be caught between a rock and a hard place, as
linear prices continue to inflate dramatically and digital media further increases its share of time spent.
But where there is challenge, there is opportunity. We think that advertisers who diversify their upfront
investment to the new generation of OTT platforms, take a serious look at the role of sponsorships and
integrations in their media portfolios, and expand their video investment beyond traditional TV media
sellers will be the best-positioned to weather this transition. OMG and its brand agencies have a
spectrum of offerings to help you seize the opportunity. We will be with you every step of the way.
195 Broadway • 8th Floor • New York • New York • 10007 OmnicomMediaGroup.comYou can also read