The Fed's Monetary Policy Exit Once Again Behind the Curve
←
→
Page content transcription
If your browser does not render page correctly, please read the page content below
The Fed’s Monetary Policy Exit Once
                        Again Behind the Curve

                                      Michael D. Bordo and Mickey D. Levy 1

                                       Hoover Monetary Policy Conference

                                     Hoover Institution, Stanford University

                                                    May 6, 2022

1
 Michael D Bordo is Economics Professor at Rutgers University and Ilene and Morton Harris Distinguished Visiting
Fellow at the Hoover Institution, Stanford University. Mickey D. Levy is senior economist at Berenberg Capital
Markets and member, Shadow Open Market Committee. The authors would like to thank Andy Filardo and Ned
Prescott for valuable comments and Mahmoud Abu Ghzalah and Tatiana Daddario for their empirical research.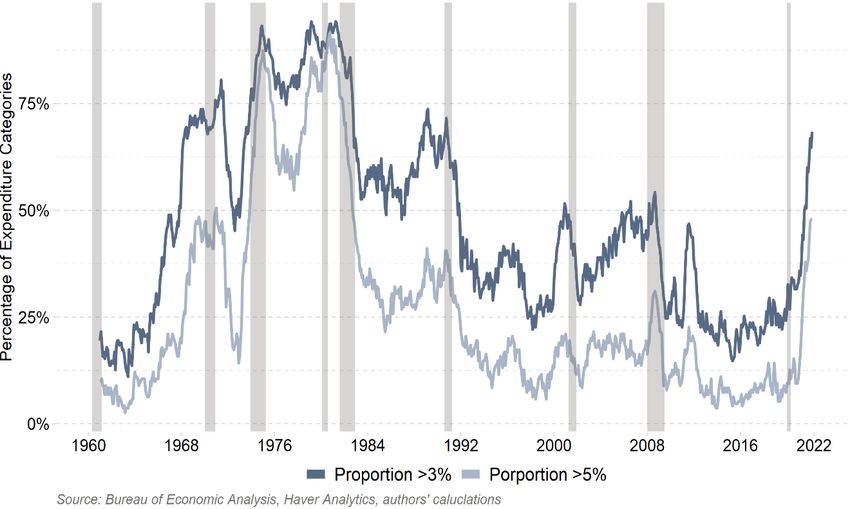
The Fed’s Monetary Policy Exit Once Again Behind the Curve

                                   Michael D. Bordo and Mickey D. Levy

1.Introduction

Every business cycle has different characteristics that economic policymakers influence and respond to.
The 2020 pandemic posed a negative shock to aggregate supply and aggregate demand. Pent up
demand and unprecedented fiscal stimulus and sustained aggressive monetary ease fueled a V-shaped
recovery involving strong demand amid ongoing supply constraints. The Federal Reserve now finds itself
in an uncomfortable situation that it failed to anticipate, but one that has occurred before in its modern
history: it faces undesired high and rising inflation and is behind the curve, and must tighten monetary
policy just enough to reduce inflation but not so much as to generate a recession.

This paper assesses the current situation through the lens of history, comparing the current inflation and
the conduct of monetary policy to the recovery phase of prior business cycles. Focusing primarily on
cycles since World War II, we highlight a persistent pattern of the Fed extending its monetary policy
easing too long and delaying its tightening exits. Most frequently, this has led to rising inflation and then
catch-up tightening that led to a recession more frequently than to a soft economic landing. While
countercyclical monetary policy is a difficult task, the Fed does not seem to take away the appropriate
lessons from history (Bordo and Levy 2022).

Prior to World War II, the Fed’s focus on price stability under the gold standard and adherence to the
real bills doctrine led it to prevent inflation but at the expense of depression and financial instability. The
evolving policy anchors and the Fed’s developing objectives resulted in major policy errors that
contributed to the Great Inflation of 1965 to 1982. The current high inflation has some key differences

                                                                                                                  1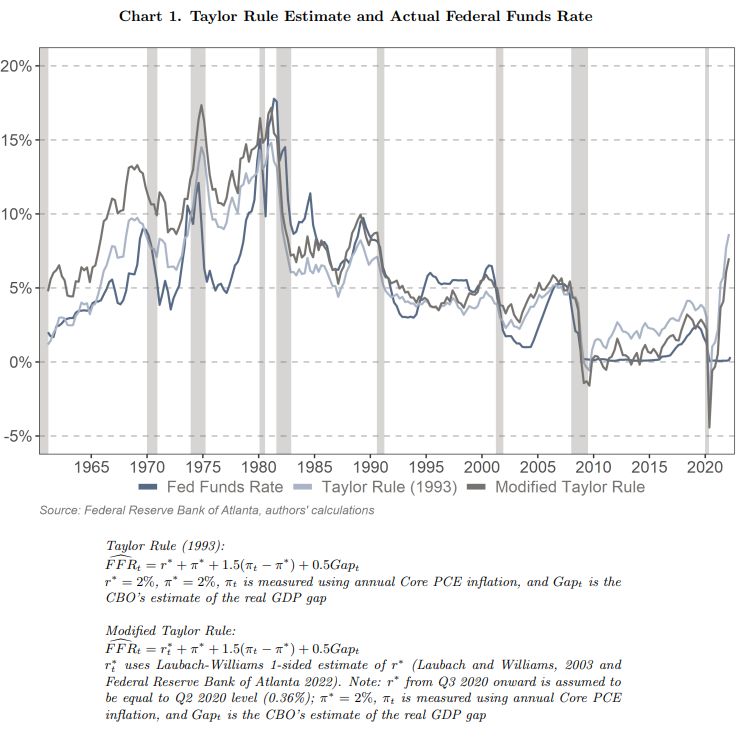
that distinguish it from the 1970s, but the Fed’s extended denial of any similarities between the two
periods has allowed some of the more troubling characteristics of the Great Inflation to reemerge and
threaten sustained economic growth. We provide empirical evidence that shows how the recent
pervasiveness of inflation has begun to mirror the 1970s while intermediate-term inflationary
expectations have risen but remain below the upward ratcheting of inflationary expectations during the
Great Inflation found by Levin and Taylor (2013).

The Fed’s current monetary policy mistakes did not just occur out of the blue. Rather, the Fed’s new
strategic framework and delayed exit from its emergency policy responses to the pandemic are a
culmination of the evolution of its objectives and discretionary policy deliberations. The Fed’s earlier
anchor of price stability evolved into a low inflation target and more recently toward favoring higher
inflation as a vehicle for avoiding the Effective Lower Bound (ELB) while its long-standing tilt toward
prioritizing low unemployment has become more pronounced. These asymmetries, which have been
institutionalized in its new strategic framework (Levy and Plosser 2020), have contributed to its current
dilemma.

The recent rise in inflation has been predictable, based on the expected excess demand that would be
generated by the unprecedented expansive monetary and fiscal policy responses and the nature of the
pandemic (Bordo and Levy 2020 and 2021; and Levy 2021).

Section II provides a historical perspective on business cycles, including a description and measures of
the Fed’s earlier delayed exits. Section III analyzes the similarities and differences between the current
situation and the Great Inflation of 1965-1982. Section IV considers factors that explain why the Fed has
tended to be behind. Section V provides a recap of lessons from history and makes recommendations
that would help avoid future policy mistakes.

2. Behind the Curve in Historical perspective

The Federal Reserve has long had difficulty in timing its exits from countercyclical expansionary
monetary policy. Bordo and Landon-Lane (2013) examined the historical and empirical record on the
timing of the Fed’s exits from recessions following the business cycles approach taken earlier by Milton
Friedman, Karl Brunner and Allan Meltzer. 2 In general, they found that since the Fed was founded in

2
    Friedman (1953) first laid out the difficulty of using discretionary monetary policy to stabilize the business cycle,

                                                                                                                            2
1913 it has followed a pattern of waiting too long to tighten. The pattern has evolved over time. After
WW I, the Fed under the leadership of Benjamin Strong focused on stabilizing the real economy and
maintaining price stability, leading to the development in the U.S. of countercyclical monetary policy. It
did so within the frameworks of the gold standard and the real bills doctrine. Under this strategy once
the economy began recovering the Fed usually tightened when the price level increased, as adhering to
the gold standard would require. It paid less attention to the real economy.
After World War II and the Employment Act of 1946, the Fed began pursuing its dual mandate which
attached importance to maintaining full employment and stabilizing the real economy along with the
continued connection to the fixed dollar peg of the gold standard under Bretton Woods. Price level
stability remained important until the mid-1960s. The Fed’s exits were similar with those of the mid-
1920s.
After 1965 the Fed began jettisoning the gold peg under pressure to accommodate expansionary fiscal
policy and fully abandoned it in the Nixon Shock of August 1971. The Fed’s focus shifted towards full
employment at the expense of rising inflation. During the Great Inflation, the Fed’s exits from
recessions became subsumed by higher inflation, tightening when inflation went up but never enough to
stamp out inflationary expectations. The government’s misguided wage and price controls failed to
contain inflation and the Arab oil embargo imposed a negative supply shock. The upward ratcheting of
inflation and inflationary expectations enabled by accommodative monetary policy undercut the Fed’s
credibility, leading to the US dollar currency crisis in 1978.
The Volcker disinflation shock in 1979-1982 led to a new regime of low inflation and ushered in The
Great Moderation during which the Fed’s more balanced approach to inflation and employment
resulted in more timely exits. The Fed’s aggressive monetary tightening in 1994 lowered inflationary
expectations and resulted in a stronger economic expansion – a picture-perfect soft landing. In the early
2000s, the foundations of the Great Moderation eroded as the Fed’s fears of the risks of deflation led it
to delay its exit from easy monetary policy. Its policies facilitated the debt-financed housing bubble and
financial instability that resulted in the Financial Crisis (GFC) of 2008-2009. Following the GFC, inflation
i.e., of fine tuning. He showed that when the Fed used its policy tools to offset exogenous shocks in most cases it
aggravated the business cycle. It mistimed policy actions because of long and variable lags between policy changes
and its effects on output and prices. Friedman and Schwartz (1963) and others (Nelson 2019) supported this with
their historical analysis. Brunner and Meltzer (1964) published a report for the US Congress documenting episodes in
the post-World War II era when the Fed fell behind the curve. They criticized the Fed for following an incorrect policy
doctrine, the Burgess Rieffler Strong Doctrine --an extension of real bills (Bordo 2022). This monetarist evidence was
used in their case against discretion and in favor of a monetary rule.
3stayed low and the Fed sustained zero interest rates and used quantitative easing to keep bond yields
low and reduce unemployment. Its concern about a downward spiral in inflationary expectations and
the Effective Lower Bound (ELB) led it to reassess its strategy that resulted in a new strategic framework
in 2020. That framework institutionalized its asymmetric prioritization of maximum inclusive
employment over inflation and de-emphasized preemptive monetary tightening. The Fed’s delayed exit
from its emergency policy responses to the pandemic has allowed a surge in inflation and inflationary
expectations that poses a serious challenge to sustained economic expansion.
The Historical record. Bordo and Landon Lane (2013) examined the Fed’s exits from 1920 to 2007,
comparing the timing of changes in policy (policy rate, monetary base and money supply (in nominal and
real terms) with the timing of changes in macro variables (real GDP, prices, inflation, output gap and
unemployment). They measured the turning points in these variables compared to NBER business cycle
troughs3. Table 1 presents some salient variables pertaining to the Fed’s exits.
For seven NBER cycles from 1920-1960, the table shows the turning points around the cyclical troughs in
in the price level (Column 2) and the unemployment rate (Column 3) compared with the turning points
in monetary policy representing tightening measured by the nominal and real discount rate until 1953
and the federal funds rate thereafter (Columns 4 and 5) and the nominal and real rate of growth of the
monetary base (Columns 6 and 7). When the Fed tightened, the policy rate would increase and the rate
of growth of the monetary base would decline. The last column of the table ascertains the timing of the
policy measures whether on time, too soon, or too late) and the economic outcome.
Pre-World War II: 1918-1941. In general, the timing and narrative evidence suggest that the Fed waited
until the price level (CPI or GDP deflator) rose before tightening, but in two cycles in the mid-1920s the
exit involved timely responses to both real and nominal variables. Friedman and Schwartz referred to
these episodes as ‘The High Tide of the Federal Reserve’. In sharp contrast, Friedman and Schwartz
viewed the Fed’s responses in three other business cycles in this period as policy failures.
3
Regression analysis was used to measure the timing of policy changes relative to the trough of a set of real
variables and price variables. The results suggest that in the post WWII era, especially after 1965, the Fed’s
tightening was more responsive to the level of unemployment than to inflation. Pre-WWII period the Fed was more
responsive to the price level than the real economy.
4Table 1: Cyclical Turning Points in Monetary Policy 1920 – 1960b
(1) (2) Price (3) (4) (5) (6) (7) (8)
Cycle Peak to Trough Level: CPIc Unemploymentd Discount Real Discount Monetary Real Comments and
(Trough) (Inflation) Ratee Rate Base Monetary Result
(Fed Funds (Real Fed Funds Growthf Base
Rate) Rate) Growth
1. 1920Q1 – 1923Q2 Too late, serious
(1921Q3)a 1922Q1 1921Q1 3, 7g - 3, 7 -1, 3 recession
2. 1923Q2 – 1926Q3 Too late, mild
(1924Q3) 1924Q1 1924Q1 3, 3 4, 4 2, 2 4, 4 recession
3. 1926Q3 – 1929Q3 On time, mild
(1927Q4) 1928Q1 1928Q1 -1, -1 -1, -1 0, 0 -1, -1 recession
Too soon, real
4. 1929Q3 – 1937Q2 bills mistake,
1933Q1 1932Q1 -6, -5 -6, -5 3, 4 3, 4
(1933Q1) Great Contraction
5. 1948Q4 – 1953Q2 Too late, mild
(1949Q4) 1950Q1 1949Q4 1, 2 4, 5 -3, -2 -3, -2 recession
6. 1953Q2 – 1957Q3 On time, mild
(1954Q2) 1954Q4 1954Q3 (0, 1) (-1, 0) -1, 0 -1, 0 recession
7. 1957Q3 – 1960Q2 On time, mild
(1958Q2) (1958Q2) 1958Q2 (0, 0) (0, 0) -1, -1 -1, -1 recession
a
Source: Bordo and Landon-Lane (2013). Tables 1a, 1b, 2a, 2b.
NBER trough dates for each cycle.
b
We omitted 2 cycles containing WWII years: 1937Q2-1944Q4 and 1945Q1 – 1948Q3.
c
The turning point was determined by visual inspection for the first quarter after the start of the recession when the price level changes from having a
negative slope to a positive slope.
d
The turning point was determined as the first quarter after the start of the recession when the derivative of the unemployment series changes from
positive to negative.
e
The turning point was determined as the first quarter after the start of the recession when the interest rate started to increase from a period of falling
or relatively level rates.
f
The turning point was determined as the first quarter after the start of the recession when the monetary base growth rate started to fall from a time of
increasing or relatively constant growth rates.
g
In each cell the first number represents the number of quarters after the price level trough, and the second number represents the number of quarters
after the unemployment peak. Missing value represents a cycle in which no definitive turning point was identified.
5In the first cycle (1920-23 peak to peak), the Fed waited until inflation reached 15% per year before
commencing tightening in late-1919. The mistiming is generally blamed on pressure from the Treasury
on the Fed to keep interest rates low to support bond prices. When the Fed finally tightened it led to
the second deepest recession in U.S. monetary history. The Fed’s largest policy mistake was during the
Great Contraction from 1929 to 1933. Its tightening cycle began in early 1928, not because prices were
rising, but because of fears based on the Real Bills doctrine that the Wall Street boom in stock prices
would lead to inflation. The ensuing recession that began in July 1929 turned into the Great Contraction
when the Fed failed to appropriately address the four banking panics from 1930 to 1933 and allowed
the money supply to collapse. The Fed’s third mistake unfolded in 1936 when it doubled reserve
requirements on commercial banks because it feared that banks would monetize their excess reserves
that would lead to high inflation. This ‘too soon’ tightening led to the recession of 1937-1938, the third
deepest in U.S. history. 4 These episodes provide valuable cautionary tales of the risks of misguided
monetary policy.
1945 to 1965. World War II was financed by a combination of taxes, bond issue and the inflation tax of
money issue. M1 and M2 surged during 1940-1945. Compared to World War I, inflation during WW II
was quite constrained by extensive price controls. Following the War, it was widely agreed that
managing aggregate demand was an important role of the government, and the biggest concern was
that aggregate demand would collapse and recession and deflation would follow, like the post-WW I
period.
Instead, pent-up demand surged, fueled by the lagged impact of monetary ease and sustained low
interest rates, as the Fed was constrained from rising interest rates under the fiscal dominance of the
Treasury (Bordo-Levy 2020). Consumption, housing and business investment spending boomed. The
excess demand strained the transition from wartime to civilian production, and inflation surged after the
wartime wage-price controls were lifted. The inflation of 1945-1948 was temporary but intense,
exceeding 10% following the removal of wartime price controls.
The Fed belatedly tightened monetary policy in 1948 through higher bank capital and reserve
requirements while the government’s fiscal policy turned restrictive as defense spending fell faster than
anticipated. This generated a mild recession and deflation in 1949.
4
This cycle is not shown because the recovery phase from 1938 Q2 to 1945Q1 was dominated by World War II and the
Fed, under the control, of the Treasury did not conduct countercyclical monetary policy.
6The Fed regained its independence with the Accord of February 1951 and under Chairman William
McChesney Martin followed a balanced approach to inflation and employment during the 1950s and
early 1960s, with relatively successful exit policies (Meltzer 2010). The business cycles and recessions of
1953-1954 5, 1957-1958 and 1960-1961 were relatively mild, similar to those in the mid-1920s. Like the
1920s, inflation was anchored by the gold standard constraint so that when the exits were delayed they
did not lead to inflation but to a rise in the price level which then declined with recessions (see Table 1).
Cyclical Episodes since the 1960s. Table 2 provides a description of the NBER business cycles since the
1960s and conduct of monetary policy around them. Reflecting the modern monetary policy regime, it
includes for each expansion the trend in inflation and the unemployment rate (Column 2 and 3) and
monetary policy reflected by the real Fed funds rate and money supply (Column 4). For an early and late
stage of each cycle it measures in percentage points the deviation of the Fed funds rate to an estimate
of the Taylor Rule (Column 5). Column 6 describes the economic result of the Fed tightening.
Following Table 2, Chart 1 shows a comparison of the actual Fed funds rate with estimates of several
variations of the Taylor Rule.6 The gaps between the Taylor Rule and Fed funds rate are consistent with
the descriptions of the business cycles provided below.
1965-1970: The Beginning of the Great Inflation. During the first half of the 1960s, the Fed under
Chairman Martin was dedicated to both price stability based on its indirect link to the gold standard
under Bretton woods (Bordo and Eichengreen 2013) and full employment. But the policymaking
environment was evolving. The historical objective of price stability was replaced by the view that
moderate inflation was good for economic performance, and the anchor provided by the gold standard
eroded. Keynesian policy prescriptions advocated activist macroeconomic policies that attempted to
5
The Korean war from June 1950 to July 1953 was largely financed by taxation unlike other wars (Ohanian 1997). In
the first year of the war prices rose at over a 10% annual rate, driven by government expenditures and by rapid
consumption in anticipation of the kind of shortages seen in WWII (seen in a rise in velocity). The price jump ended
with the imposition of price, wage and credit controls which prevailed until 1953. The Fed began raising rates in
late 1952 to stem a perceived rise in inflation (Meltzer 2010 chapter 2, page 99) contributing to the recession of
1953-1954 although Friedman and Schwartz (1963 page 61) describe how the Fed shifted to ease before the
business cycle trough.
6
Both variations use the Congressional Budget Office’s estimate of the GDP Gap and core PCE inflation rather than
the GDP deflator used in the original Taylor Rule (1993). Our second variation uses Laubach-Williams (2003)
estimates of r* in place of Taylor’s r*=2.0% in his 1993 version. See footnotes to Chart 1.
7Table 2. Cyclical Episodes of the Federal Reserve’s Exits from Monetary Ease, 1961 to Present
Cyclical Episodes of Federal Reserve Exits from Policy Ease after World War II
(1) (2) (3) (4) (5) (6)
Inflation1 Unemployment rate2 Fed Policy Comments
Cyclical Expansion Fed Funds Rate minus
Start → End Start → End Real FFR3 Money Result
Taylor Rate4
1961 Q2 - 1969 Q4 1.2% → 5.5% 6.4% → 3.5% 0.9% - 3.7% ↓ real MB & M2 1966 - 1969: -2.4pp 1970 recession
sharp slowdown, sustained
Note: 1965 Q4 -1967 Q1 1.6% → 3.2% 4.5% → 3.8% credit tightening (Reg Q ceilings) 1971 - 1973: -1.6pp
expansion
Oil price shock &
1971 Q1- 1973 Q4 5.6% → 6.2% 5.4% → 4.9% 1.5% - 3.4% ↓ real MB & M2 1975 - 1979: -4.0pp
deep recession
1975 Q2 - 1980 Q1 11.1% → 12.4% 7.3% → 6.0% -2.1% - 2.8% ↓ real MB & M2 1983 - 1987: +2.3pp oil price spike & recession
↓ real MB,
1980 Q4 - 1981 Q3 13.6% → 11.1% 7.2% → 7.4% 2.6% - 7.2% 1988 - 1989: +1.1pp recession
M2 unchanged
1983 Q1 - 1990 Q3 5.2% → 5.0% 10.1% → 5.4% 5.7% - 4.2% ↓ real MB & M2 1991 - 1993: -0.3pp mild recession
Fed hikes until Oct '87 stock market
Note: 1987 Q1 - 1987 Q4 1.7% → 3.7% 6.9% - 6.2% 1994 - 1999: +1.4pp extended expansion
crash then eases (↑ MB & M2)
1991 Q2 - 2001 Q1 4.3% → 2.5% 6.3% → 4.0% 2.7% - 3.7% ↓ real MB, ↑ M2 2001 - 2006: -0.9pp recession in 2001
Note: 1994 Q1 - 1995 Q1 2.4% → 2.1% 6.8% → 5.8% 0.7% - 2.7% ↓ real MB & M2 2007 - 2008: -0.7pp extended expansion
2002 Q1 - 2007 Q4 1.6% → 2.6% 5.1% → 4.6% 1.3% - 2.5% ↑ real MB & M2 GFC recession
2009 Q3 - 2019 Q4 -0.3% → 1.5% 8.5% → 3.7% 0.5% - 0.7% decline in 2018-19 2009 - 2019: -1.7pp pandemic recession
Note: 2015 Q4 -2018 Q4 0.2% → 2.1% 5.3% → 3.9% -0.1% to -0.3% ↓ real MB, ↑ M2 2015 - 2018: - 2.0pp extended expansion
2020 Q1 - present 1.6% → 6.3% 3.7% → 3.6%
5
0.3% to -6.3%
6
surge in MB & M2
2022 Q17: - 8.1pp;
Modified TR = -6.5pp ?
Source: Bureau of Labor Statistics, Bureau of Economic Analysis, Federal Reserve Board, Haver Analytics, author's calculations
1. CPI before 1991, PCE after 1991, 4-Quarter average of yr/yr inflation
2. 4-Quarter average unemployment rate
3. 4-Quarter average of Real Fed Funds rate
4. Fed Funds Rate minus Taylor Rule estimate, average measured in percentage points.
Taylor Rule: r* + π* + 1.5 (πt - π* ) + 0.5*CBO GDP Gapt, where r* = 2%, π* = 2% and π is core PCE. See Chart 1.
5. March 2022 unemployment rate
6: As of February 2022
7: Based on Q1 core PCE inflation of 5.2% and Q1 effective Fed funds rate of 0.12%.
See Chart 1 for modified Taylor Rule equations and assumptions
89
exploit what was perceived to be a reliable and stable Phillips Curve tradeoff between unemployment
and inflation.

Beginning in 1965, under pressure from the LBJ administration the Fed began accommodating the fiscal
imperatives of the Vietnam War and Great Society. This generated excess demand and higher inflation
(Levin and Taylor 2013). Inflation accelerated from 1.6% in 1965 to 5.9% in 1970. The Fed attempted to
tighten credit in Summer 1966 through higher bank capital requirements and not lifting Regulation Q on
interest rates. This resulted in a “Credit Crunch” that slowed economic growth but did not cause
recession, forcing the Fed to step back. 7 Accelerating Vietnam War spending and renewed monetary
accommodation generated rising inflation. Inflationary expectations and bond yields rose. The Fed’s
delayed exit began only after LBJ announced he would not seek re-election. The Fed’s sharp tightening
in 1969 involved a rise in real interest rates and a decline in the real monetary base and M2. Coupled
with the extension of the Vietnam War surtax, a recession unfolded in 1970.

The 1970s: Upward-Ratcheting Inflation. Arthur Burns became Chair of the Federal Reserve in February
1970. He blamed inflation on non-monetary (cost-push) factors including strong labor unions and greedy
businesses and advocated wage and price controls to stem it. In response to the mild recession of
1969Q4-1970Q4, although inflation was nearly 6%, the Burns-led Fed lowered interest rates
aggressively, below inflation by early 1971, which resulted in rapid growth in money. The Fed then
raised the discount rate to slow credit and then eased rates. In 1972, the Fed kept rates too low,
allowing a sharp expansion in money aimed at supporting Richard Nixon’s election bid (Meltzer 2010).
At the same time there was significant fiscal stimulus. Although the Fed raised rates from 5% to 10% in
the 12 months between the November 1972 election and the November 1973 Arab Oil Embargo, the
lagged impacts of stimulus coupled with an acceleration in money velocity associated with the higher
interest rates generated a surge in nominal GDP growth, to 9.8% in 1972 and 11.4% in 1973. This excess
demand overwhelmed the wage and price controls, and CPI inflation rose from 3.3% in 1973 to 8% even
before the Arab Oil Embargo generated soaring oil prices in November 1973. The Arab oil embargo
contributed to a deep recession from 1973Q4 to 1975Q1 with real GDP declining by 4.7% while inflation
rose to 11% in 1974 when the wage and wage price controls were lifted.

While inflation fell sharply following the recession, it troughed at 5.2% in late 1976, far above its mid-
1973 low, while the unemployment rate was very slow to recede. The unemployment rate rose from

7
    The NBER originally designated the Credit Crunch as a recession but later revised it away.

                                                                                                             10
4.8% to a peak of 9% in 1975Q2 and drifted only gradually lower to 7.8% at year-end 1976 even as the
economy recovered.
The Fed lowered rates aggressively from an average of 10.5% in 1974 to 5.4% in 1975Q4 and kept them
below inflation through September 1977. It belatedly raised rates faster, but only enough to keep pace
with the sharply accelerating inflation, which rose to 6.6% in the fourth quarter of 1977, 9% in 1978 and
10.75% before the second oil price shock in mid-1979. Despite accelerating inflation, the high
unemployment rate remained the top priority of Congress, and Burns did not attempt to stamp out
inflation because he feared the implications of higher unemployment (Burns 1979). The Humphrey-
Hawkins legislation that focused on jobs creation evolved into the Full Employment and Balanced
Growth Act of 1978 that established employment and inflation mandates for the Fed.
The ratcheting up of inflation during the Great Inflation took a heavy toll. From late-1965 to mid-1982,
the CPI rose over 300%. Damage to the Fed’s credibility culminated in a US dollar crisis in 1978. Higher
inflationary expectations and bond yields generated sustained real declines in financial asset values, and
the rising real costs of capital and depressed investment and potential growth. The higher inflation
distorted the tax system that was not indexed to inflation at the time.
Volcker’s aggressive disinflationary monetary policies and The Great Moderation. In August 1979
President Carter appointed Paul Volcker, a well-known inflation hawk, as Fed Chairman. Two months
after taking office, Volcker announced a major shift in policy aimed at rapidly lowering inflation. He
desired the policy change to be interpreted as a decisive break from the past policies. The Fed imposed a
series of sizable hikes in the federal funds rate. The roughly 7 percentage point rise in the nominal funds
rate between October 1979 and April 1980 was the largest, most rapid increase in the Fed’s history.
Although Volcker tightened monetary policy aggressively, because inflationary expectations were
embedded and the Fed lacked credibility, the exit was costly, with back-to-back recessions in 1980 and
1981-1982, and it took until 1983 to definitively lower inflationary expectations (Bordo, Erceg and Levin
2017 and Sargent and Silber 2022).
Volcker’s successful disinflationary policies ushered in The Great Moderation. During this period the Fed
took a more balanced response to inflation and employment, with more timely exits following monetary
easing. The result was moderate inflation and virtually sustained economic expansion. The Fed began
raising rates soon after the 1983 expansion began and well before inflation pressures ensued in mid-
1983. It began raising rates before inflation turned up in late-1986 but eased in response to the Stock
11Market Crash of October 1987. Soon after the Crash, the Fed began raising rates in nominal and real
terms when sustained economic growth lowered the unemployment rate and inflation picked up. It
raised rates aggressively from 6.6% in March 1988 to 9.9% in March 1989, and the yield curve inverted.
Economic growth slowed sharply in 1990Q2-Q3, and a mild recession unfolded in 1990Q4-1991Q1
associated with the Gulf War spike in oil prices.
The Fed’s most noted preemptive exit was in 1994. Following the so-called “jobless recovery” of 1991-
1993, the Fed raised rates sharply, from 3% to 6% during February 1994-February 1995 in response to
declining unemployment and signs of overheating labor markets when there no signs of rising inflation.
The Fed’s tightening dampened inflationary expectations and successfully orchestrated an economic
soft-landing and ushered in strong performance in the second half of the decade. While Fed research
touted this successful preemptive tightening, Fed Chair Greenspan expressed concerns about its
negative impacts on the mortgage market and housing. The Fed delayed monetary response to strong
economic and financial performance and rising inflation and worries about liquidity needs around Y2K
led it to raise rates gradually in 1999. Following the collapse of the dot.com bubble, business
investment fell and consumption growth slowed. In this environment, the Fed tightened too much in
2000, raising rates to 6.5%, far above the 2.6% inflation. The collapse in capital spending contributed to
a recession that was accentuated by the shock of 9/11.
The 2000s: Worries about deflation contribute to a delayed exit. Following the bursting of the dot.com
bubble and the 9/11 shock that extended the recession, inflation fell to 1%, and a new fear gripped the
Fed: based on observations of Japan’s bouts with mild deflation following the bursting of its equity
bubble in 1990, the Fed began to fear the downside economic risks of deflation. Even though Japan’s
economic performance was far different than U.S.’s, its experience resonated with the Fed, which feared
that if deflation were to unfold, aggregate demand would spiral down and would be hard to reverse
through monetary stimulus. The Fed thought that the risks of the costs of deflation far outweighed the
risks of higher inflation, which it believed it could address through monetary tightening, so it strived to
avoid any probability of deflation. This led the Fed to delay its exit from monetary ease, even as
inflation moved back up. The Fed delayed raising rates and then raised them gradually, trying to avoid
harming financial markets, in sharp contrast to the aggressive tightening of 1994. Keeping rates too low
12for too long facilitated the debt-financed housing boom that contributed to financial instability that later
evolved into the Financial Crisis of 2008-2009 (Taylor 2007 and Bordo and Landon-Lane 2014).
Post-Great Financial Crisis. In direct response to the extreme financial market dysfunction that centered
on the mortgage market, the Fed engaged in large-scale purchases of mortgage-backed securities (MBS),
so-called QEI. Fed Chairman Bernanke emphasized that QEI was credit policy, not broad-based
quantitative easing, and said the Fed would unwind its holdings on a timely basis (Bernanke 2008). The
Fed subsequently extended its zero rate policy and ramped up its quantitative easing with purchases of
Treasury and MBS securities well after the financial crisis had ended and self-sustaining economic
recovery had ensued. The low inflation allowed the Fed to focus on employment and extend its
unprecedented monetary ease.
Inflation stayed low during the post-GFC expansion primarily because the expansive monetary and fiscal
policies (the American Recovery and Investment Act of 2009) did not stimulate sustained acceleration in
aggregate demand. Nominal GDP growth remained below 4%, providing little support for higher prices
or wages (Levy 2017). The Fed’s QEs boosted bank reserves and the monetary base, but they did not
translate into increased M2 or credit expansion that generated stronger economic activity (Column 4 of
Table 2). Changes in the Fed’s operating procedures, including paying interest on excess reserves (IOER),
and tighter capital and liquidity requirements, along with a shift to tighter controls and bank supervision
imposed by stress tests, constrained credit (Ireland and Levy 2021). While the low interest rates
boosted home prices and equity markets, the damages imposed by the financial crisis on the banking
system, consumer finances and the housing sector took years to repair. The Fed may have taken away
the wrong lessons from this period, attributing the low inflation to the ex-post observation that the
Phillips Curve had flattened. It subsequently presumed that inflation would stay low. 8
The Fed raised rates very gradually beginning in late 2015 and began unwinding a portion of its bloated
balance sheet beginning in 2017. By 2018Q3, the Fed had raised rates to a range of 2.25%-2.5%,
modestly above PCE inflation of 2.4%. Following the Fed’s delayed exit, the economy continued to grow
at a moderate pace and inflation receded to 1.5%, close to its average of 1.4% since 2012.
8
There were no cautionary voices within the Federal Reserve System to point out that historically, fiscal stimulus
financed by monetary accommodation led to inflation.
13Although inflationary expectations remained fairly well anchored to 2% and the Fed continued to
forecast that inflation would rise to 2%, the Fed harbored mounting worries that if inflation persisted
below its 2% target, there was a risk of a downward spiral in inflationary expectations that would lower
interest rates to the ELB and constrain the Fed’s ability to respond to the next cyclical downturn. These
concerns led the Fed to conduct a strategic review beginning in 2018. Underlying its strategic review,
the Fed focused on the risks of lower inflation, and the more focus was directed at the goal of
maximizing employment for all groups of people. The new strategic framework that was rolled out in
August 2020 (Powell 2020) introduced a flexible average inflation targeting regime that incorporated an
asymmetry that favored higher inflation, and dialed down the Fed’s historic reliance on preemptive
tightening to control inflation, and prioritized the Fed’s employment mandate and broadened its
employment mandate to “maximum inclusive employment”. It was a structurally flawed strategy (Levy
and Plosser 2020).
The Pandemic and Subsequent Recovery. The negative shock to aggregate supply and aggregate
demand and government shutdowns generated a short but massive decline of 9% in real GDP in
2020Q1-2020Q1. The Fed’s response was purposely more aggressive and expansive than its response to
the GFC. It quickly lowered rates to zero and conducting massive purchases of Treasuries and MBS, and
additionally established an array of direct business lending and grants programs coordinated with and
capitalized by the Treasury and Congress (Bordo and Duca 2022). The Fed’s asset purchases generated a
surge in the monetary base. At the same time M2 surged, reflecting primarily government income
support initiatives. Fiscal policy authorized over $5 trillion in deficit spending, more than 25% of GDP,
largely in the form of checks distributed to individuals and small businesses, beginning with the CARES
Act of March 2020. A sizable portion of the government’s fiscal transfers in the ensuing 12 months were
saved and deposited in banks. Associated with the decline in economic activity consequent upon the
pandemic and government-imposed shutdowns, M2 money velocity declined.
A strong V-shaped economic recovery and sharp rise in inflation surprised the Fed. Nevertheless, the
pandemic crisis had encouraged the Fed to be more interventionist, and its policies had helped lift the
economy out of a deep contraction and were considered successful. The Fed maintained its emergency
monetary policies of zero rates and ongoing purchases of Treasury and MBS until March 2022. Its exit
began long after inflation and inflationary expectations had risen sharply, and labor markets were
characterized by accelerating wages and signs of extreme tightness. Measured against any inflation or
14employment benchmark, the Fed’s exit has been more delayed than any in history. Most strikingly, as
inflation rose sharply and the labor market recovery of all groups far exceeded expectations and
exhibited clear signs of tightness and stress, the Fed ignored the data and insisted that tapering its asset
purchases and raising rates would be delayed until “substantial progress” had been made toward its
new employment mandate. By March 2022, the Fed funds rate was 6.3% below PCE inflation (5.4%
below core PCE inflation), the unemployment rate had fallen to 3.6%, and Chair Powell termed the
extreme tightness of labor markets “unhealthy”.
3. The Current Situation: Similarities and Differences from the Great Inflation
As the economy recovered from its 2020Q2 trough, Fed officials presumed that there would be a repeat
of low inflation the post-GFC conditions. When inflation began accelerating, the Fed said it was
transitory, attributing it to the base adjustments following the decline in the CPI and PCE indexes in
March-April 2020 and temporary supply shortages, and dismissed any comparisons to the 1970s as
inappropriate and uninstructive. The Fed’s extended denial that inflation had anything to do with strong
demand that was generated by monetary policy and unprecedented deficit spending contributed to the
persistent acceleration of inflation and allowed some current conditions to become uncomfortably
similar to the 1970s.
So far, the rise in inflation in 2021-2022 has been similar in magnitude to the inflation of the late-1960s
and early 1970s, but below levels during 1978-1982. Through March 2022, CPI inflation had risen to
8.5% from 2.2% in 2019 while PCE Inflation has risen to 6.6% from 1.5% in 2019 (their core measures
excluding food and energy have risen to 6.4% and 5.2%, respectively). These increases are similar to the
rise in CPI inflation to 5.9% in 1970 from 1.5% in 1965. 9 Both inflation episodes were generated by a
surge in government spending and accommodative monetary policy.
A detailed analysis of price increases of components of both the CPI and PCE price index show that
current inflation has been pervasive across a wide array of goods and services, similar to the inflation of
the late 1960s and early 1970s. Charts 2 and 3 show the acceleration of inflation in a growing number of
components of the CPI and PCE. Through much of 2021, the rightward movement of the shares of
9
The CPI measures inflation for out-of-pocket consumer expenditures (it excludes expenditures that are paid for by
employer-financed health insurance, Medicare, Medicaid) and its components are not weighted by expenditure
shares. The PCE components capture all personal consumption expenditures including those that are financed by
third parties and are weighted by shares of spending.
15components indexes experiencing rising inflation was inconsistent with statements by Fed officials
(Powell 2021) and the Biden Administration that the inflation was attributable to sharply rising prices of
select goods and services.
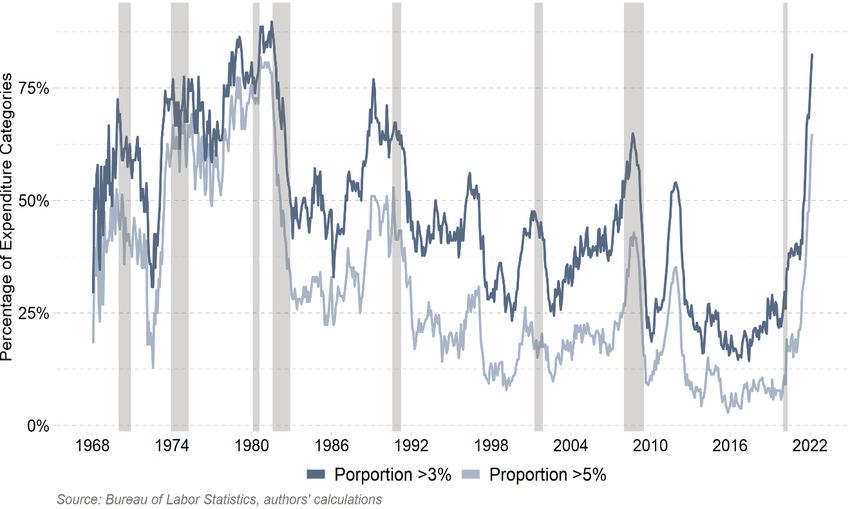
The growing pervasiveness of inflation and similarities to the 1970s are striking. Chart 4 shows the
portion of CPI components that experience inflation exceeding 3% and 5%, while Chart 5 shows similar
shares of components of PCE inflation. Through February 2022, the shares of CPI components
experiencing inflation exceeding 3% and 5% have risen to 82% and 65% respectively, while the shares of
PCE components with inflation exceeding 3% and 5% have risen to 68% and 48%. These shares are as
high as in the late 1960s and early 1970s but remain below the late-1970s. Of note, while the shares of
the PCE components experiencing high inflation are less than the CPI shares and below the shares
experienced in the 1970s, the CPI measures out-of-pocket expenditures, which may influence
inflationary expectations.
The Fed’s misreads of the economy and inflation have been disturbingly similar to the rhetoric of the
1970s. The Fed placed blame on special factors even when measures of aggregate demand including
final sales to domestic purchasers had accelerated to their fastest pace in history. The Biden
Administration, similar with the Nixon Administration, has blamed the inflation on greedy businesses
(but not labor unions!). Fortunately, the Fed has acknowledged that wage and price controls failed.
Instead of a blanket controls, the Biden Administration is attempting to lower prices of select goods by
providing financial incentives to specific industries to increase supply and imposing regulations on others
aimed at controlling their prices. It is also releasing oil from the Strategic Petroleum Reserve.
Inflationary expectations have risen significantly in 2021-2022, but they remain well below those of the
1970s. Short-term and intermediate term expectations have risen markedly, while longer-run
expectations have risen only modestly, suggesting that at least so far, the Fed’s long-run inflation
fighting credibility remains intact. Expectations of inflation in the next year have risen dramatically, to
5.4% (University of Michigan) and 6.6% (Federal Reserve Bank of New York Consumer expectations),
while 3-year expectations have risen to 3.7% (FRBNY). Market-based measures of inflationary
expectations for 5 years have risen to 3.4% while inflation is expected to average 2.6% in years six
through ten (based on the 5-year, 5-year forward curve).
16Chart 2. The distribution of Inflation across 200+ CPI Expenditure Categories
Chart 3. Distribution of Inflation across 191 PCE Expenditure Categories
17Chart 4. Portion of CPI Components Experiencing Inflation Exceeding 3% and 5%
Chart 5. Portion of PCE Components Experiencing Inflation Exceeding 3% and 5%
18The Fed’s unwillingness to acknowledge the persistence of inflation is illustrated in its Summary of
Economic Projections (Table 3). In each succeeding quarterly SEP in 2021, the Fed raised its projection
of inflation for 2021 to reflect inflation that had already occurred, but forecast inflation would fall
sharply in 2022-2023, despite assuming that it would be most appropriate that the Fed would not raise
rates from zero until 2023. That forecast changed materially in March 2022.
Table 3. The Fed’s Summary of Economic Projections of Inflation
Direct comparisons of inflationary expectations with the 1970s are limited by data availability. However,
derived estimates of inflationary expectations during the Great Inflation by Levin and Taylor (2013) are
materially higher than current levels. Current survey-based measures of inflationary expectations are
higher than market-based measures, and may have a bigger influence on wage and price-setting
behavior. Whereas market-based measures are determined by factors that influence yields on US
Treasury securities and the TIPs markets, including changes in the Fed’s holdings of these securities,
commercial bank holdings, foreign central bank policies and the US dollar exchange rate and foreign
demand, consumer expectations may be more closely linked to household and business decisions that
affect the inflation process (Reis 2021).
19In sharp contrast to the upward ratcheting of bond yields between 1965-1982, bond yields have
remained far below inflation since the pandemic began. Yields on 10-year Treasury bonds were 1.5% in
February 2020 and fell to 0.7% in October 2020. They have now risen to 3%. Ten-year Treasury yields
rose from 4.2% in 1965 to 7.8% in early 1970. During the 1970s, they ratcheted up with higher lows and
higher highs. Between June 1978 to June 1982, yields rose from a low of 8.6% and 15.3%.
The higher yields during 1966-1982 pushed down stock valuations, and real total returns on stocks were
negative over the entire period. In contrast, low bond yields since early 2020 have supported high stock
valuations, although this now may be changing. Whereas the high rates during the Great Inflation raised
the government’s debt service costs and heightened concerns about persistent budget deficits, recent
low interest rates have reduced government debt service costs and diluted concerns about rising
government debt. Of note, nominal GDP growth was persistently high in the 1970s, rising to average
11.3% per year in 1978-1981. This environment of persistent excess demand fueled the wage price
spiral. 10
Inflation seems likely to persist at elevated levels, reflecting excess demand even after supply
bottlenecks ease. Monetary and fiscal policy responses may have elongated lagged stimulative effects,
reflecting the character of the pandemic, government shutdowns and the magnitude of the policy
excesses. The Fed’s policy rate will likely remain well below inflation and an appropriate level estimated
by a Taylor Rule.
The current backlog of fiscal stimulus is sizable. A portion of the $5 trillion in deficit spending authorized
has not been spent, and through year-end 2021 personal savings is an estimated $2.5 trillion (13.6% of
disposable income) higher than pre-pandemic. An added wrinkle is that state and local governments
saved virtually all of the $500 billion in Federal grants received through fiscal legislation in 2020-2021.
Their excess savings eventually will be spent or used to finance tax cuts, effectively providing lagged
fiscal stimulus even as Federal budget deficits recede. Another $1 trillion of government spending has
been authorized by the Infrastructure Investment and Jobs Act enacted in November 2021. Such
investment is expected to have a higher fiscal multiplier than transfer payments. In addition, national
10
While the oil price shocks and other negative shocks aggravated inflation, the rapid growth of nominal GDP could
not have persisted without accommodative monetary policy. The high interest rates that reflected the upward
ratcheting inflationary expectations raised the opportunity costs of holding money boosted money velocity that
contributed to the excessive aggregate demand.
20defense spending is likely to rise. These sources point toward sustained excess demand even if supply
chain disruptions dissipate. 11
Through March 2022, the robust recovery of goods demand and oil price spike has generated PCE
inflation of 10.6% while PCE inflation of services have risen to 4.5%, as the recovery of spending on
services has lagged. Services activities are now catching up, which points to continued inflation
acceleration. Services sectors are labor intensive, pushing up operating costs. In addition, the largest
component of services inflation is shelter costs, and inflation of its two biggest components, owner-
occupied rental equivalent (OER) and rental costs, is accelerating and may remain elevated, based on
the historic lags following rising home prices (Levy 2022).
Tight labor markets and higher expected inflation may combine to put upward pressure on nominal
wages. The unemployment rate at 3.6% is below the Fed’s estimates of its natural rate of 4%, and job
openings of 11.5 million exceed job hires of 6.7 million, reflecting an unprecedented gap between labor
demand and available supply. The job quits rate of 3.0% hovers near an all-time high. Real wages have
been declining, as 8.5% CPI inflation has exceeded the 6.75% rise in average hourly earnings of private
sector production and nonsupervisory workers. Higher inflation is influencing wages and a growing
number of wage contracts at large corporations now include cost of living adjustments (COLAs).
Nominal wages are expected to catch up to inflation, reflecting the tight labor market conditions, the
pickup in labor productivity and the feedback loop between wages and inflation.
In sum, the persistence and pervasiveness of inflation have begun to take on some of the negative
characteristics of the 1970s.
4. Why Has the Fed Been Consistently Behind?
The Federal Reserve’s track record of delayed exits stems from a confluence of factors. Economic
theories have evolved and become more conducive to activist macroeconomic policymaking and the
Fed’s reliance om discretion been prone to misjudgments. The Fed’s interpretation of its dual mandate
has evolved toward prioritizing maximum inclusive employment over inflation and has introduced
asymmetries that require discretion in interpreting how to achieve its objectives. The Fed has expanded
11
Money velocity should recover from its abrupt pandemic collapse as the economy returns to normal and interest
rates rise. Similarly, money velocity rebounded following World War II as the lagged impact of monetary stimulus
during the War and pent-up demand generated a surge in spending as normal civilian life resumed.
21its set of monetary tools, including its heightened reliance on forward guidance to manage expectations
and an expanded balance sheet, in ways that have confused its policy deliberations and introduced
delays. It has complicated and muddled the Fed’s communications. The Fed’s assessments and
forecasts of the economy and inflation occasionally have led to monetary policy mistakes. In addition,
the Fed faces constant political pressures from elected officials to facilitate their short-term objectives.
These political pressures have affected the Fed in significant ways during some critical periods.
Evolving doctrines. Even following World War II when the government assumed the role of managing
aggregate demand and the Employment Act of 1946 mandated the Fed to pursue maximum
employment, monetary policy was grounded in price stability and a longer-run balanced budget
anchored fiscal policymakers.
Replacing price stability as an anchor for monetary policy in the 1960s with the goal of moderate
inflation and the Keynesian revolution, popularized by the Phillips Curve that used inflation as a tool for
reducing unemployment, fueled discretionary activist monetary policy. These new analytical
frameworks promoted the role of the Federal Reserve Board staff that advocated the Phillips Curve
framework and activist countercyclical policymaking. The prospects that the Fed could use actively
monetary policy to achieve desired tradeoffs between inflation and unemployment attracted
policymakers of like mind. The realities of higher inflationary expectations in the 1970s and the Fed’s
loss of credibility unhinged the relationship between the unemployment rate and inflation and undercut
any notion of a permanent stable Phillips Curve. In response, the Phillips Curve was modified and has
remained as the Fed’s benchmark, despite its analytical flaws and unreliability. 12
The trauma of the high inflation of the 1970s and Volcker’s jarring disinflationary monetary policy
ushered in The Great Moderation. During this period, the basic premise of the Volcker-Greenspan
regimes was that low inflation was the foundation for achieving maximum employment, a clear
departure from the doctrine of the 1970s. The Fed was quicker to reduce monetary accommodation at
signs of inflation pressures. During this period, scholarly research focused on the benefits of rules that
targeted low inflation and eventually settled on 2% (Taylor 1993). Others advocated the benefits of a
12
While new ideas by the monetarists in the 1960s and 1970s and the rational expectations school in the 1980s and
1990s and research conducted at several Federal Reserve Banks, particularly St Louis and Minneapolis, influenced
thinking in the Federal Reserve System, the Phillips Curve remained as the dominant framework for conducting monetary
policy (Bordo and Prescott 2019)
22framework for targeting low inflation without rules (Bernanke, et al 1999), also centering on 2%.
Inflation targeting and guiding inflationary expectations toward the inflation target became the
dominant anchor guiding monetary policy, operating as a constraint on the pursuit of full employment.
An ensuing pivot in the System’s thinking at the turn of the twenty first century had a significant impact
on monetary policy that remains central to monetary policy. The Greenspan-led Fed’s concerns about
deflation and its perception that the risks of deflation and the stagnation that would result were a far
bigger concern than the risks of high inflation, became influential. 13 This new asymmetric view of risks
around inflation resulted in the Fed’s delayed exit from its 2001-2002 countercyclical easing that proved
costly for economic performance and financial stability. This asymmetric concern re-emerged as a
dominant theme in the decade following the GFC.
Subdued inflation following the GFC allowed the Fed to aggressively pursue maximizing employment. In
2012, Fed Chair Bernanke stated that a key objective of QEIII was to lower the unemployment rate
(Bernanke 2012), a noted departure for then-unconventional monetary policy. Fed Chair Yellen was
even more aggressive in pursuing low unemployment and posted a new Labor Market Dashboard on the
Fed’s website. The persistently sub-2% inflation fueled Fed’s worries about the risks of a downward
spiral in inflationary expectations and asymmetries imposed by the ELB.
These ELB concerns along with the prospects that sustained monetary ease could promote maximum
inclusive employment became a cornerstone of its new strategic plan. The new strategic framework
institutionalized the Fed’s asymmetries, including prioritization of its enhanced maximum employment
mandate and flexible average inflation targeting that favored inflation above 2%. 14 Underlying its new
strategy, the Fed acknowledged that the Phillips Curve was flat which allowed it to eschew the pre-
13
Chaiman Greenspan referred to “low probability but high-cost outcomes” (Greenspan 2003) and argued that
while deflation would create a downward spiral in aggregate demand that would be hard to escape from, while
higher inflation poised fewer risks because the Fed “would know how to address the problem”. Then-Governor
Bernanke articulated how the Fed could resort to quantitative easing at the zero-lower bound (Bernanke 2002).
14
Fed Chair Powell’s description of the Fed’s new strategic plan in his August 2020 Jackson Hole speech emphasized
its enhanced maximum inclusive employment. “The stories we heard [at the Fed Listens] events became a potent
vehicle for us to connect with the people and communities that our policies are intended to benefit.” “With regard
to the employment side of our mandate, our revised statement emphasizes that maximum inclusive employment is
a broad-based and inclusive goal. The change reflects our appreciation for the benefits of a strong labor market,
particularly for many of the low-and moderate-income communities. In addition, our revised statements says that
our policy decision will be informed by our ‘assessments of shortfalls of employment from its maximum level’ as in
our previous statement. This change may appear subtle, but it reflects our view that a robust job market can be
sustained without causing an outbreak of inflation.” Vice Chair Clarida restated these points and concluded “This is
a robust evolution in the Federal Reserve’s policy framework” (Clarida 2020).
23emptive monetary tightening that had been critical to its high priority of managing inflationary
expectations. The strategy’s tenuous theoretical foundations, including heavy reliance on forward
guidance and precise management of expectations, and the absence of any numeric targets was
impractical for conducting sound monetary policy (Plosser 2022). It contributed to the Fed’s excessive
extension of its crisis management policies.
Misreads and unreliable forecasts. Forecasting is very difficult and fraught with challenges. The Fed’s
models do not seem to have captured critical variables that have driven important shifts in the
economy. They largely ignore money supply and the monetary transmission channels in its forecasting.
The Fed, presumably for political reasons, has not forecast prior recessions. Nor have the senior Fed
staff who manage the Fed’s macroeconomic models, according to the minutes of FOMC meetings that
are released with a 5-year lag. Prior to the GFC, the Fed’s macro models did not capture the economic
implications of failing credit conditions and the spreading of financial instability and the precarious
nature of the short-term funding market. As the housing and mortgage market unraveled, the Fed’s
forecasts were consistent with its assertion that the problems facing the housing sector would not spill
into the economy.
The Fed’s misread of the sharply rising inflation in 2021-2022 was not its first. In the 1970s, the Fed
attributed the upward ratcheting of inflation to special factors rather than to monetary accommodation
and did not account for the mounting negative impacts of rising inflationary expectations. Following the
GFC, the Fed’s senior staff model and SEPs significantly over-estimated inflation. When inflation
remained low, the Fed attributed it to a flatter Phillips Curve, while it paid insufficient attention to
factors and policies that may have bottled up the monetary policy transmission mechanism and
inhibited the impact on nominal GDP.
As the economy recovered from the pandemic, the Fed presumed that inflation would stay low as it did
post-GFC. When inflation rose, the Fed attributed it to supply shortages, and stuck to a forecast that it
would decline back toward the Fed’s target. In doing so, it understated any stimulative impacts of an
increasingly negative real Fed funds rate and the surge in M2, and the unprecedented increase in fiscal
deficit spending. The Fed did not acknowledge the fastest growth of aggregate demand in modern
history. It is uncertain whether the Fed’s models estimated that the trillions of dollars of fiscal stimulus
financed by the Fed’s monetary ease would have no impact on the economy or inflation, or used
judgment and overrode its models. The oversight of readily available data raises more questions. In
24You can also read