The Hidden American Immigration Consensus: A Conjoint Analysis of Attitudes toward Immigrants
←
→
Page content transcription
If your browser does not render page correctly, please read the page content below
The Hidden American Immigration Consensus: A
Conjoint Analysis of Attitudes toward Immigrants
Jens Hainmueller                    Stanford University
Daniel J. Hopkins                   Georgetown University

        Many studies have examined Americans’ immigration attitudes. Yet prior research frequently confounds multiple questions,
        including which immigrants to admit and how many to admit. To isolate attitudes on the former question, we use a conjoint
        experiment that simultaneously tests the influence of nine immigrant attributes in generating support for admission.
        Drawing on a two-wave, population-based survey, we demonstrate that Americans view educated immigrants in high-
        status jobs favorably, whereas they view those who lack plans to work, entered without authorization, are Iraqi, or do
        not speak English unfavorably. Strikingly, Americans’ preferences vary little with their own education, partisanship, labor
        market position, ethnocentrism, or other attributes. Beneath partisan divisions over immigration lies a broad consensus
        about who should be admitted to the country. The results are consistent with norms-based and sociotropic explanations
        of immigration attitudes. This consensus points to limits in both theories emphasizing economic and cultural threats, and
        sheds new light on an ongoing policy debate.

I
      n recent years, the immigrant population in the                   should be admitted, how many immigrants should be ad-
      United States has grown rapidly, and it now stands                mitted, and how should the United States address those
      at over 40 million (U.S. Census Bureau 2011). At                  immigrants who are already here? In this study, we seek
the same time, immigration has become a salient polit-                  to disentangle those questions and to focus on the first by
ical issue across the federal system, with Congress con-                identifying the types of immigrants who are supported
sidering major immigration reforms repeatedly. These                    for admission.
contentious, ongoing debates make it clear that at both                      Certainly, there are prior studies examining which
the elite and mass levels, there are stark divisions over               immigrant attributes affect attitudes toward immigrants.
immigration.                                                            Yet to date, survey experiments on these questions have
     Over that same period, scholars have been working                  manipulated only a few immigrant attributes at a time,
to better understand immigration attitudes and to iden-                 such as immigrants’ countries of origin, skill levels, skin
tify whether attitudes toward immigrants are primarily                  tones, or English abilities (e.g. Adida, Laitin, and Valfort
driven by economic competition, ethnocentrism, con-                     2010; Brader, Valentino, and Suhay 2008; Hainmueller
cerns about norms and national identity, or other factors               and Hiscox 2010; Harell et al. 2012; Iyengar et al. 2013;
(see Hainmueller and Hopkins 2014 for a detailed lit-                   Ostfeld 2012; Sniderman, Hagendoorn, and Prior 2004;
erature review). Still, in seeking to explain immigration               Valentino and Iyengar 2011). This empirical strategy has
attitudes, prior research has frequently confounded at                  enabled scholars to test likely influences on immigra-
least three distinct questions: Which types of immigrants               tion attitudes in isolation, but it has not allowed for

Jens Hainmueller is Associate Professor, Department of Political Science and Graduate School of Business, Stanford University, Stanford, CA
94305 (jhain@stanford.edu). Daniel J. Hopkins is Associate Professor, Department of Government, Intercultural Center 681, Georgetown
University, Washington, DC 20057 (dh335@georgetown.edu).
We thank participants in seminars at BYU, MIT, Stanford University, Temple University, the University of California–Berkeley, the University
of California–San Diego, the University of Michigan’s Gerald R. Ford School of Public Policy, the University of Pennsylvania, and the 2012
Annual Meeting of the Midwest Political Science Association, as well as Adam Berinsky, Jack Citrin, Rafaela Dancygier, Shana Kushner
Gadarian, Todd Hartman, Chad Hazlett, Gabriel Lenz, Deborah Schildkraut, Jasjeet Sekhon, John Sides, David Singer, Cara Wong, and
Matt Wright for helpful comments. For excellent research assistance, we acknowledge Christopher Duffner, Katherine Foley, Douglas
Kovel, Clare Tilton, Amelia Whitehead, Marzena Zukowsa, and especially Anton Strezhnev. Stefan Subias provided considerable assistance
in fielding the survey. The usual disclaimer applies. The data used in this study are available in the AJPS Data Archive on Dataverse
(http://dvn.iq.harvard.edu/dvn/dv/ajps).
American Journal of Political Science, Vol. 00, No. 0, XXX 2014, Pp. 1–20

C   2014 by the Midwest Political Science Association                                                             DOI: 10.1111/ajps.12138

                                                                                                                                           1
2 JENS HAINMUELLER AND DANIEL J. HOPKINS
comprehensive tests of the competing hypotheses. To ad- immigrants from several African and Asian countries.
dress that limitation, we introduce to political science an Yet such effects are relatively small in magnitude and
experimental design—conjoint analysis—that can iden- limited in scope. Once we provide information on edu-
tify the attributes of immigrants that provoke especially cation, language, and other factors, Mexican immigrants
positive or negative reactions.1 appear to suffer little penalty as compared to German im-
Our experiment asks a population-based sample of migrants, a finding that distinguishes these results from
U.S. citizens to decide between pairs of immigrants ap- those of Brader, Valentino, and Suhay (2008) and suggests
plying for admission to the United States. In each case, a the limits of ethnocentrism-based explanations.
respondent sees application information for two immi- The results provide us with substantial leverage to
grants, including notes about their education, countries reconsider various theoretical explanations of attitudes
of origin, and several other attributes that vary randomly toward immigrants. Our findings are at odds with ex-
across pairings. Instead of limiting our analysis to one or planations emphasizing labor market threat, since pref-
two factors, this experimental design enables us to vary erences for highly skilled immigrants and those planning
many immigrant attributes simultaneously and to evalu- to work do not vary with respondents’ skill levels, oc-
ate which attributes make immigrants more or less likely cupations, or industries. Yet they are also at odds with
to be granted admission. This design therefore allows us explanations highlighting other types of variation across
to compare the relative explanatory power of various hy- individuals. Indeed, the most striking pattern to emerge
potheses, from those emphasizing labor market threat is not anticipated by prior scholarship emphasizing eco-
or fiscal burdens to those emphasizing sociotropic im- nomic or cultural factors. Past theories have consistently
pacts, norm adherence, or prejudice. Unlike prior obser- posited individual-level differences in attitudes toward
vational research (such as Hainmueller and Hangarter’s immigrants, whether they are based on respondents’ la-
2013 study of Swiss votes on naturalization applications), bor market positions, fiscal exposure to immigration, at-
this research makes use of a sample that is both nation- titudes toward outgroups, partisanship, or other traits.
ally representative and observed at the individual level. The divisive national debates of recent years certainly re-
Individual-level data make it possible to assess a wide vari- inforce the expectation of individual-level differences in
ety of theoretical mechanisms, and so to address our cen- immigration-related attitudes. In contrast, our results un-
tral question: whether various subgroups of Americans cover a sweeping consensus across different groups about
respond differently to specific immigrant attributes. Un- which types of immigrants to admit. These preferences
like prior experimental studies of immigration attitudes, differ little based on the respondents’ education, income,
including Sniderman, Hagendoorn, and Prior (2004) and race/ethnicity, partisanship, or other demographic and
Brader, Valentino, and Suhay (2008), this research inde- attitudinal characteristics.
pendently randomizes numerous immigrant attributes in A wealth of recent scholarship reports pronounced
a single experiment, allowing us to identify and compare differences in attitudes across partisan groups, both on
the unique effects of each. preferred immigration policies (e.g., Knoll, Redlawsk, and
We find that hypotheses emphasizing immigrants’ Sanborn 2011) and on a host of other political issues
adherence to national norms and their expected economic (e.g., Gerber and Huber 2009). Given the expansive in-
contributions receive strong support. For our respon- fluence of partisanship, the underlying American consen-
dents, immigrants with bachelor’s degrees are 20 per- sus on preferred immigrants is all the more remarkable.
centage points more likely to win admission over those The strength of this unacknowledged consensus under-
with no formal education, for example. We also find that cuts explanations of attitudes toward immigrants that
immigrants who have good language skills, have job expe- highlight individual-level differences, such as claims that
rience, and work in high-status jobs are viewed favorably, anti-immigrant attitudes are primarily driven by distri-
whereas immigrants who lack plans to work or entered butional concerns. It also helps us better understand
without authorization are not. Moreover, immigrants’ the roots of contemporary divisions over immigration
countries of origin matter, with respondents penalizing policy—those divisions cannot be masking divisions over
Iraqi immigrants by 14 percentage points (compared to the types of immigrants to admit, as on that point, there
immigrants from the most preferred origin, Germany) is widespread agreement. Immigrants are being assessed
and with more ethnocentric respondents penalizing in similar ways by Democrats and Republicans, by high
school graduates and college graduates, and by rich and
1 poor. The operative question appears to be not how im-
In a companion article, we develop the statistical tools for con-
joint analysis utilized in this study (Hainmueller, Hopkins, and migrants affect specific individuals but how they are per-
Yamamoto 2014). ceived to affect the nation as a whole.THE HIDDEN AMERICAN IMMIGRATION CONSENSUS 3
A wide variety of robustness checks provides con- Economic Self-Interest and Sociotropic
fidence that these results are not artifacts of specific Concerns
choices made during survey administration or analy-
sis. The results are not especially pronounced among One approach to immigration attitudes takes economic
those with a tendency to “self-monitor,” among those self-interest as its starting point. In this view, the native-
who saw less typical immigrant profiles, or among re- born perceive immigrants as competitors for scarce jobs
sponses to profiles seen early or late. Methodologi- and will oppose immigrants if they have skill profiles and
cally, the conjoint analysis employed here has potential occupations similar to their own (Mayda 2006; Scheve
value in studying problems well beyond immigration and Slaughter 2001). For example, high-skilled respon-
attitudes. dents are expected to oppose high-skilled immigrants, but
To be sure, on most issues, public attitudes do not not low-skilled immigrants. Another variant of the mate-
translate directly into policy, and prior research suggests rial self-interest approach hypothesizes that immigrants
that the disconnect between public opinion and policy- might influence native-born residents through their im-
making has been especially pronounced on immigration pact on taxes and spending (Facchini and Mayda 2009;
(e.g., Messina 1989; Tichenor 2002). On the whole, the Hanson, Scheve, and Slaughter 2007). Those native-born
public is thought to be more restrictionist than elected residents whose level of income and place of residence ex-
officials. But the existence of a “hidden American im- pose them to higher costs from immigration are expected
migration consensus” on whom to admit is nonetheless to be especially opposed. For example, a wealthy respon-
important in understanding contemporary immigration dent in a heavily immigrant state with a high income
attitudes and immigration policymaking, even if there is tax is likely to be more anti-immigration than a similar
no similar consensus on immigration policy. First, the respondent in a state with no income tax. Under this hy-
mass-level consensus indicates that any disagreements pothesis, we might also expect that immigrants’ intention
among the mass public are more likely to be over how to work will influence their reception, with high-income
many immigrants to admit or how to handle immigrants Americans especially wary of immigrants not planning to
already here than over whom to admit. More tentatively, work.
our findings are consistent with the claim that salient Other scholarship has contested hypotheses based
disagreements over immigration policy might stem from on material self-interest, either by pointing out that eco-
the selective mobilization of people, groups, and atti- nomic perceptions are weak predictors of immigration-
tudes on this issue (see also Tichenor 2002). Even so, related attitudes (e.g., Burns and Gimpel 2000; Citrin et al.
as the Conclusion discusses, key elements of the Sen- 1997; Sides and Citrin 2007) or by demonstrating that the
ate’s 2013 immigration reform follow the tenets of the preference for high-skilled immigrants is evident among
consensus uncovered here. That proposed reform empha- all subgroups of natives (Hainmueller and Hiscox 2007,
sized skill-based immigration, English-language acquisi- 2010). To the extent that more educated individuals are
tion, increased border security, and penalties for unau- more supportive of immigration, such a finding might re-
thorized migration. Each of those policies is in line with flect increased tolerance. Moreover, Hainmueller, Hiscox,
American public opinion about whom to admit. So while and Margalit (2014) show that attitudes toward immi-
there is no analogous consensus on immigration pol- gration are very similar among native workers in U.S.
icy among interest groups or policy makers, the shadow industries that vary in their dependence on immigrant
of the hidden consensus uncovered here is visible in labor, their labor mobility, or the skill mix of the immi-
policymaking. grants they employ (but see Malhotra, Margalit, and Mo
2013). These findings are inconsistent with the argument
that egocentric concerns about labor market competition
strongly influence immigration attitudes.
Why Do Natives Oppose Immigrants? Still, there are also sociotropic economic explanations
that remain viable even in the face of these objections.
As immigrant populations have grown in developed According to a sociotropic account, native-born Ameri-
democracies, hypotheses about the sources of native-born cans respond to immigrants based on perceptions about
opinion about immigrants have proliferated as well. Here their economic contribution to the nation as a whole. If
we organize several theoretical approaches based on the so, native-born Americans might prefer well-educated,
hypotheses they generate about two questions: What im- experienced, high-status professionals based on percep-
migrant attributes influence native-born attitudes, and tions about their impact on the national economy or their
which native-born groups are influenced? likely tax contribution (Citrin et al. 1997; Hainmueller4 JENS HAINMUELLER AND DANIEL J. HOPKINS
and Hiscox 2007). Sociotropic hypotheses have been well English or those from outside Europe are viewed more
developed in explaining Americans’ perceptions of eco- negatively. With respect to the Middle East, threats related
nomic performance (e.g., Kinder and Kiewiet 1981), but to terrorism could exacerbate such differences (Harell
could extend to their assessments of immigrants as well. et al. 2012; Schildkraut 2011).
Prejudice and Ethnocentrism American Identity and Norms
As with race-related questions, immigration is an emo- Another theoretical approach begins from the premise
tionally charged issue addressing the rights of people that natives evaluate immigrants based on their adherence
who are predominantly nonwhite (e.g., Brader, Valentino, to norms related to American identity (Schildkraut 2011).
and Suhay 2008). Research indicates that those who With respect to immigration, many Americans identify
hold negative stereotypes about immigrants (Burns and strongly with their nationality (Theiss-Morse 2009; Wong
Gimpel 2000) or more biased implicit associations (Pérez 2010), and concerns that immigration might dilute na-
2010) are more opposed to immigration. In the United tional identity are widespread (Burns and Gimpel 2000;
States and Europe, there is substantial variation in sup- Citrin et al. 1997; Schildkraut 2011; Wright 2011). Atti-
port based on immigrants’ countries of origin (Dust- tudes toward immigrants might thus hinge on whether
mann and Preston 2007; Hainmueller and Hangartner they are seen as upholding American norms (Wright and
2013; but see Sniderman et al. 2002). Given those ob- Citrin 2011). But what are “American norms”? One con-
servations, an alternate set of explanations holds that cerns assimilation (Schildkraut 2005, 2011): We should
non-Hispanic whites’ immigration attitudes—and per- expect those immigrants who demonstrate an interest in
haps those of other groups—are structured similarly to America and its culture to win higher levels of support.
their racial views. These viewpoints begin from the con- Over 90% of Americans indicate that speaking English
tention that racial and immigration-related attitudes stem is an important element of American identity (Theiss-
from a common underlying factor, whether it is ethno- Morse 2009; Wong 2010), so we hypothesize that speaking
centrism (e.g., Kinder and Kam 2009), authoritarianism English will matter too.
(Hetherington and Weiler 2009), or social dominance ori- The norm-based approach also produces the expec-
entation (Newman, Hartman, and Taber 2014). Building tation that immigrants’ labor market credentials will be
on the close relationship between immigrants’ countries influential, albeit for reasons not related to economic
of origin and their ethnic or racial backgrounds, this ap- self-interest. Given Americans’ strong adherence to work-
proach generates two hypotheses: that native-born Amer- related norms, immigrants’ professions, job experiences,
icans will be more opposed to immigrants from countries and employment plans are signals of adherence to those
that are more ethnically and culturally distinctive and that norms. Whereas the hypothesis grounded in self-interest
native-born Americans with higher levels of ethnocen- predicts that immigrants’ professions should interact with
trism will be especially opposed (Kinder and Kam 2009, hosts’ professions, this norm-based account expects a
138). common influence across host subgroups. Immigrants
In one variant of hypotheses emphasizing prejudice, who want to enter the United States to improve their job
immigration-related attitudes are straightforward exten- prospects might be rewarded relative to others. A related
sions of racial attitudes. Thus, native-born white Ameri- line of thinking might lead immigrants who are more fa-
cans are likely to be more supportive of immigrants from miliar with the United States, perhaps having spent time
Europe. In this view, sources of intergroup difference that in the country, to garner more support. Notice the simi-
are common to racial ascription, such as skin tone, are larity between the observable implications of this norms-
likely to shape attitudes on immigration. Maintaining based approach and the sociotropic approach. To the ex-
the emphasis on prejudice or ethnocentrism, a second tent that norms about American identity are related to
approach allows for the possibility that the content of professional success, these two approaches yield overlap-
the anti-immigrant stereotypes might differ from that ping expectations.
of antiblack stereotypes. In this view, there are several Conversely, one of the central norms that many
immigrant attributes that might increase perceptions of contemporary immigrants are perceived to violate re-
social and cultural distance, from difficulty with English gards authorized entry (Hood and Morris 1998). If so,
(Hopkins 2014) to differing religious or cultural practices immigrants who have previously been in the United
(Adida, Laitin, and Valfort 2010; Ostfeld 2012). This hy- States without authorization might be penalized despite
pothesis could explain why immigrants who do not speak their increased familiarity with the country. One of theTHE HIDDEN AMERICAN IMMIGRATION CONSENSUS 5
liabilities of the norms-based account is that there is no Experimental Design, Data,
comprehensive list of norms related to American identity, Measurement, and Analysis
giving the hypothesis substantial flexibility. Nonetheless,
our focus here is on well-defined norms, such as those
We employ a choice-based conjoint design to obtain
around language, work, and law. This theoretical discus-
a more comprehensive picture of citizens’ opinions on
sion does not pretend to be exhaustive, but it organizes
whom to admit. Conjoint analyses have been widely used
prior theorizing into three broad approaches. Most hy-
in marketing (e.g., Raghavarao, Wiley, and Chitturi 2011),
potheses lead us to expect pronounced individual-level
but they have seen little use in political science (Hain-
differences in attitudes toward immigrants, whereas a few
mueller, Hopkins, and Yamamoto 2014). Our experiment
theories predict a more common response.
puts respondents in the position of immigration officials,
asking them to make decisions between pairs of immi-
grants applying for admission. We require a choice be-
Limits of Existing Evidence tween each pair of immigrants to simplify the decision
task, given the limits of short-term memory (Krosnick
Pioneering studies played a critical role in identifying
1999). Following a short introduction explaining the ex-
the correlates of immigration attitudes (e.g., Burns and
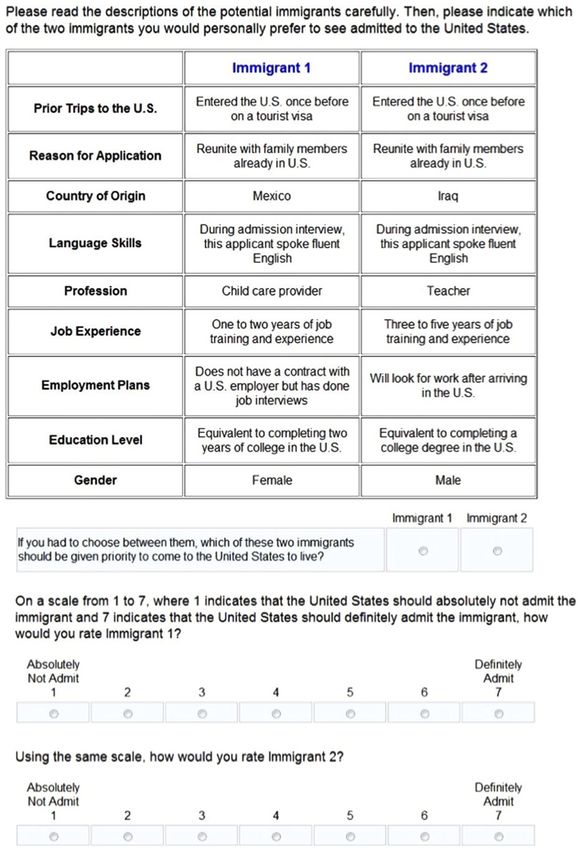
ercise, we show respondents a screen with profiles of two
Gimpel 2000; Citrin et al. 1997; Scheve and Slaughter
immigrants as displayed in Figure 1. The instructions
2001), but these early studies emphasized immigration
asked respondents to “please indicate which of the two
attitudes in general. Prior studies have only rarely con-
immigrants you would personally prefer to see admitted
sidered attitudes about whom to admit separately from
to the United States.” As detailed below, the results are
those about how many to admit. Also, as this literature has
not sensitive to this particular framing of the task.2 We
expanded, scholars have increasingly supplemented ob-
provide details on the question wording, variable coding,
servational studies with experimental approaches. Such
and survey administration in the Supporting Information
experiments vary one, two, or at most three immigrant
(SI).
attributes at a time, including the immigrant’s country
Below the immigrant profiles, we measure the out-
of origin, education, language use, or skin tone (Adida,
come in two ways. The first question asks respondents to
Laitin, and Valfort 2010; Brader, Valentino, and Suhay
report a preference for one of the profiles. We code the
2008; Hainmueller and Hiscox 2010; Harell et al. 2012;
responses to this question in a binary variable, Immigrant
Hopkins 2014; Ostfeld 2012; Schildkraut 2011; Snider-
Preferred, which is 1 if the immigrant profile is preferred
man, Hagendoorn, and Prior 2004; Sniderman et al.
and 0 otherwise. This variable is our primary outcome
2002; Valentino and Iyengar 2011; Wright and Citrin
of interest. The question has the advantage that it forces
2011). Yet even these second-generation studies are lim-
respondents to make trade-offs, as someone must be ad-
ited in their ability to test the relative strength of var-
mitted and someone else rejected. Requiring a decision
ious hypotheses. There is also the possibility of con-
also neutralizes attitudes about overall levels of immi-
founding if the experimentally manipulated attributes
gration, enabling us to focus on the attributes that make
are correlated with other influential attributes. For ex-
immigrants more or less attractive to the native-born. As
ample, if an experiment includes information only on
a robustness check, we also use responses to a pair of
immigrants’ countries of origin, it is unclear whether
questions that ask respondents to rate each immigrant on
immigrants from Mexico are penalized because of per-
a 7-point scale.3 We use these ratings to code a binary
ceptions about their education levels or levels of unau-
variable (Immigrant Supported) as 1 if the rating is above
thorized entry, or for other reasons, such as deep-seeded
the midpoint and 0 otherwise.
prejudice. Certainly, it is difficult to identify a single ma-
nipulation that can definitively test a hypothesis, and
2
it is difficult to make direct comparisons between es- The similarities between these results and those of Wright, Levy,
and Citrin (2014) further suggest that the core results detailed
timates obtained from experiments with different de- below are likely to be robust to the specific framing of the survey
signs, manipulations, and dependent variables. More- task.
over, prior research has focused on only a small subset of 3
Our focus is on which immigrants receive support, and our em-
the sources of immigrant-native distinction. Given these phasis on the forced-choice outcome reflects that. Given our design,
limitations, the following section proposes a research de- it is plausible that responses to the forced-choice question influ-
sign that enables comparisons of a much wider range enced the ratings provided immediately afterward. Future work
might consider randomizing the format of the outcome variable so
of theoretically relevant immigrant attributes on a single as to evaluate its effects. For an example of a conjoint design using
scale. a different response format, see Wright, Levy, and Citrin (2014).6 JENS HAINMUELLER AND DANIEL J. HOPKINS
FIGURE 1 Experimental Design
Note: This figure illustrates the experimental design for the conjoint experiment.
Each respondent evaluates five comparisons between sen to approximate the information available to immigra-
pairs of immigrants, each displayed on a new screen. We tion officials, and that rationale explains why other factors
randomly vary the two immigrants’ profiles on nine at- such as religion were omitted. Each of the attributes can
tributes that previous studies identify as potentially in- take on multiple values. For example, job experience has
fluential. The attributes include each immigrant’s gender, five values ranging from “no job training or prior expe-
education, employment plans, job experience, profession, rience” to “more than five years.” For each profile, we
language skills, country of origin, reasons for applying, and randomly assign the values of each attribute such that
prior trips to the United States. These attributes were cho- the two immigrants’ profiles vary within and across theTHE HIDDEN AMERICAN IMMIGRATION CONSENSUS 7
binary comparisons. Table 1 contains the full list of at- ter more or less. Finally, the design allows us to consider
tribute values. They cover a wide range—in theory, there interactions between respondent and immigrant char-
are just under 900,000 unique immigrant profiles—to as- acteristics (e.g., do ethnocentric voters care more about
sess various theoretical dimensions that are potentially immigrants’ countries of origin?). These interactions pro-
influential. vide opportunities to test additional hypotheses.
While some profiles are more typical than others, the
population of immigrants to the United States is itself
large and diverse, and the attribute values were chosen Sample
to be common, distinctive, plausible, and theoretically
relevant. For example, the professions include a variety Our data come from a two-wave, nationally representa-
of occupations in which contemporary immigrants are tive panel survey of U.S. citizens administered through
likely to be found. Also, the 10 chosen countries jointly Knowledge Networks (KN) between December 2011 and
are the sending countries for approximately 43% of all January 2012. Uniquely among American survey compa-
immigrants in the United States today. Table A.1 in the nies, KN recruits respondents using random-digit dialing
SI reinforces these impressions by using Current Popu- or address-based sampling, and it provides Internet ac-
lation Surveys to estimate the share of immigrants from cess to those who lack it. All members of the KN panel
each of our 10 national-origin groups with some col- have a known probability of selection, so our sampling
lege education or a bachelor’s degree. It confirms that procedure constitutes a two-stage probability design. The
even seemingly atypical profiles likely correspond to sig- KN panel covers the online and offline U.S. populations
nificant numbers of actual immigrants. Below, we also aged 18 years and older, and previous research has shown
address the question of typicality by identifying respon- that it closely approximates national demographic bench-
dents who saw profiles that were more or less typical.4 marks (Chang and Krosnick 2009). The SI provides a full
For each respondent, we also randomly assign the or- list of the survey questions as well as details about survey
der of the attributes to rule out primacy and recency administration.
effects.5 The first wave of our survey contained 1,714 com-
Our design has several advantages over prior obser- pleted interviews and measured key covariates, including
vational and experimental approaches. First, given that attitudes toward immigration, levels of self-monitoring
the attribute values are randomized, the design allows us (Berinsky and Lavine 2011), and ethnocentrism (Kinder
to identify the effect of each immigrant attribute on the and Kam 2009). After a 3-week washout period, we re-
probability of being preferred for admission. Put differ- interviewed respondents in a survey containing the con-
ently, the randomization provides new leverage to disen- joint experiment. Respondents were not made aware of
tangle the effects of correlated attributes such as language the connection between the surveys. Although consid-
skills and country of origin. Moreover, given that we vary erably more costly than a cross-section, this panel de-
all the attributes and measure their effects on the same sign enables us to measure potential moderating variables
scale, the design allows us to examine the attributes’ rela- without priming respondents or introducing differential
tive importance. For instance, we can compare the effect measurement bias. The second wave yielded 1,407 com-
of a college education with that of being Mexican. Second, pleted interviews, so attrition within the panel was limited
we can examine possible interactions in the effect of the to 18%. In SI Table A.2, we use t-tests to demonstrate that
immigrant attributes (e.g., do skill levels matter more for the attrition was not related to any of our core variables.
more culturally distinctive immigrants?). This allows us In the second wave, we also measured additional covari-
to test the conditions under which some attributes mat- ates such as respondents’ employment status, industry,
and occupation. In all analyses, we use post-stratification
4
We impose two restrictions on the randomization to rule out weights to adjust the data for common sources of survey
implausible profiles. First, we restrict immigrants who apply for error.
admission to “escape persecution” to come from “Iraq,” “Sudan,”
or “Somalia.” Second, we restrict the randomization for profession
such that high-skill occupations “financial analyst,” “research sci-
entist,” “doctor,” and “computer programmer” are included only
if the education level is 2 years of college or more. Analysis
5
However, the order of the attributes is fixed for each respondent Conjoint experiments frequently involve many more
across the five comparisons to reduce complexity. Moreover, we unique profiles than there are observations in the data
restrict the randomization of the attribute order such that the work-
related attributes profession, job experience, and employment plans set. In this case, there are just under 900,000 possible pro-
always appear consecutively in a randomized order. files, only a small fraction of which are ever observed.8 JENS HAINMUELLER AND DANIEL J. HOPKINS
TABLE 1 Attributes for Immigrant Profiles in Conjoint Experiment
Attributes Values
Education Level No formal education
Equivalent to completing fourth grade in the U.S.
Equivalent to completing eighth grade in the U.S.
Equivalent to completing high school in the U.S.
Equivalent to completing two years at college in the U.S.
Equivalent to completing a college degree in the U.S.
Equivalent to completing a graduate degree in the U.S.
Gender Female
Male
Country of Origin Germany
France
Mexico
Philippines
Poland
India
China
Sudan
Somalia
Iraq
Language During admission interview, this applicant spoke fluent English
During admission interview, this applicant spoke broken English
During admission interview, this applicant tried to speak English but was unable
During admission interview, this applicant spoke through an interpreter
Reason for Application Reunite with family members already in U.S.
Seek better job in U.S.
Escape political/religious persecution
Profession Gardener
Waiter
Nurse
Teacher
Child care provider
Janitor
Construction worker
Financial analyst
Research scientist
Doctor
Computer programmer
Job Experience No job training or prior experience
One to two years
Three to five years
More than five years
Employment Plans Has a contract with a U.S. employer
Does not have a contract with a U.S. employer, but has done job interviews
Will look for work after arriving in the U.S.
Has no plans to look for work at this time
Prior Trips to the U.S. Never been to the U.S.
Entered the U.S. once before on a tourist visa
Entered the U.S. once before without legal authorization
Has visited the U.S. many times before on tourist visas
Spent six months with family members in the U.S.
Note: This table shows the attributes and attribute values that are used to generate the immigrant profiles for the conjoint experiment.THE HIDDEN AMERICAN IMMIGRATION CONSENSUS 9
Yet the estimation of treatment effects is straightforward ticular applicant for admission. The dots without confi-
on account of the randomization and the resulting or- dence intervals denote reference categories. For exam-
thogonality of each attribute with respect to every other. ple, the second line from the top indicates that male
In survey experiments, researchers commonly randomize immigrants are 2.4 percentage points less likely to win
potential confounders (such as the question order) and support for admission than female immigrants. The es-
then analyze the treatment effects by averaging over those timates are based on the benchmark regression model
orthogonal attributes. Here we evaluate the relative im- described above where the Immigrant Preferred variable
portance of immigrant attributes in an analogous way. We is regressed on sets of indicator variables for each level
follow the statistical approach developed in Hainmueller, of each immigrant attribute (omitting the reference cat-
Hopkins, and Yamamoto (2014) and estimate average egories). The full regression model is displayed in SI
marginal component effects (AMCEs). The AMCE rep- Table B.1.7
resents the average difference in the probability of being Confirming prior research (Hainmueller and Hiscox
preferred for admission when comparing two different at- 2007, 2010; Sniderman, Hagendoorn, and Prior 2004),
tribute values—for example, an immigrant with “fluent the KN panelists prefer immigrants with higher levels of
English” versus an immigrant with “broken English”— education, and the effect is roughly monotonic: the more
where the average is taken over all possible combinations educated the immigrant, the greater the support. In fact,
of the other immigrant attributes. Thanks to the random immigrants with a B.A. are 19.5 percentage points (SE =
assignment of attributes, profiles with “fluent English” 2.1) more likely to be supported for admission than immi-
will have the same distribution for all other attributes on grants without formal education. Differences in the im-
average as compared to profiles with “broken English,” al- migrants’ ability to use English have similarly sized effects.
lowing for a straightforward comparison of means. Hain- Compared to an applicant who speaks fluent English, one
mueller, Hopkins, and Yamamoto (2014) show that the who uses an interpreter sees a decline in support of 16.2
AMCE is nonparametrically identified given the condi- percentage points (SE = 1.4). There is some penalty for
tionally independent randomization of the attributes and speaking broken English (6.4, SE = 1.4), but the penalty
can be easily estimated using a regression of the binary for being unable to use English is much larger. Language
outcome variable, Immigrant Preferred, on sets of indica- is commonly considered a cultural indicator, but in this
tor variables measuring the levels of each attribute. The context, it might be considered an economic skill to some
advantage of this approach is that the estimator for the degree.
AMCEs is fully nonparametric and does not require func- A variety of other cultural differences are correlated
tional form assumptions about the choice probabilities.6 with immigrants’ countries of origin, from their religions
Note that since the unit of analysis is the rated immi- and manners of dress to phenotypical differences such as
grant profile, we have up to 14,000 observations in some skin tone. Conditional on detailed information about im-
models—each of our 1,407 respondents rated five pair- migrants’ education, job experience, occupation, and lan-
ings, with two immigrant profiles per pairing. To obtain guage, it seems reasonable to consider country of origin
accurate variance estimates, we cluster the standard errors an imprecise indicator of cultural differences. Yet despite
by the respondent because observed choice outcomes are the emphasis past research places on cultural differences,
not independent across the profiles rated by a single re- the effects for the immigrants’ countries of origin are typ-
spondent. ically small and statistically insignificant, with only four
countries (China, Iraq, Sudan, and Somalia) reducing the
probability of admission as compared to the baseline In-
dian immigrant. The difference between coming from
Effects of Immigrant Attributes on these four countries and Germany—the most preferred
Support for Admission country of origin—is statistically significant (p < .05,
two-sided). Iraqi immigrants are viewed more negatively
Figure 2 displays the results for all respondents. It uses
dots to indicate point estimates and lines to illustrate 7
Notice that we include the full set of pairwise interactions for
95% confidence intervals for the AMCE of each attribute
the attributes that are linked through the restrictions on the ran-
value on the probability that respondents chose a par- domization. As explained in Hainmueller, Hopkins, and Yamamoto
(2014), the AMCEs for these linked attributes need to be estimated
as the weighted average of the effect of a specific attribute averaged
6
This sets it apart from other estimation approaches in the conjoint over the valid strata of the linked attribute (e.g., we average the
literature, such as conditional logit. Nonetheless, all the results effect of going from a “janitor” to a “waiter” across each education
reported below obtain when estimated via conditional logit. level).10 JENS HAINMUELLER AND DANIEL J. HOPKINS
FIGURE 2 Effects of Immigrant Attributes on Probability of Being Preferred for
Admission
Gender:
female
male
Education:
no formal
4th grade
8th grade
high school
two−year college
college degree
graduate degree
Language:
fluent English
broken English
tried English but unable
used interpreter
Origin:
Germany
France
Mexico
Philippines
Poland
India
China
Sudan
Somalia
Iraq
Profession:
janitor
waiter
child care provider
gardener
financial analyst
construction worker
teacher
computer programmer
nurse
research scientist
doctor
Job experience:
none
1−2 years
3−5 years
5+ years
Job plans:
contract with employer
interviews with employer
will look for work
no plans to look for work
Application reason:
reunite with family
seek better job
escape persecution
Prior trips to U.S.:
never
once as tourist
many times as tourist
six months with family
once w/o authorization
−.2 0 .2
Effect on Pr(Immigrant Preferred for Admission)
Note: This plot shows estimates of the effects of the randomly assigned immigrant attribute values on the probability
of being preferred for admission to the United States. Estimates are based on the benchmark OLS model with
clustered standard errors detailed in SI Table B.1; bars represent 95% confidence intervals. The points without
horizontal bars denote the attribute value that is the reference category for each attribute.THE HIDDEN AMERICAN IMMIGRATION CONSENSUS 11
than others, as being from Iraq reduces the probability contrast, immigrants’ reason for seeking admission has
of admission by 10.6 percentage points (SE = 2.6) com- little influence, with only a hint that those immigrants
pared to Indian immigrants. Given the two wars between who seek better jobs are viewed more negatively than oth-
the United States and Iraq, and given the salience of ter- ers (–2.5 percentage points, SE = 1.2). Those immigrants
rorism after 9/11, it is plausible that Iraqi immigrants who seek to escape from religious or political persecution
are viewed as security threats. Intriguingly, despite media are viewed a bit more favorably (5.9 percentage points,
frames focusing on low-skilled, unauthorized immigra- SE = 2.2).
tion from Mexico, there is little evidence of a penalty Our final attribute summarizes the applicant’s prior
specific to Mexicans. Mexican immigrants are treated in a trips to the United States. Immigrants who have spent
manner indistinguishable from Polish or German immi- time in the United States are likely to be perceived as
grants and earn more support than Indian immigrants. having a stronger connection to the country. In fact, as
This estimate is conditional on information about the im- compared to those who have never been to the United
migrant’s prior trips to the United States, suggesting that States, immigrants who have been to the United States
Mexican immigrants might be viewed negatively in other once, those who have been many times, and those who
contexts because of their association with unauthorized spent six months with family in the United States are
immigration. all between 5.7 and 8.5 percentage points more likely to
We also find evidence that the prospective immi- win admission. Yet the most striking result is the 10.8
grant’s profession matters, with construction workers percentage point (SE = 1.6) penalty for coming previ-
(5.3, SE = 2.1), nurses (8.9, SE = 2.1), doctors (18.5, ously without authorization. Whatever familiarity with
SE = 3.5), and research scientists (14.4, SE = 3.7) enjoy- the United States an unauthorized immigrant might gain
ing a bonus over janitors. Generally, those in high-skill is outweighed by the violation of norm and law. Whether
professions are more likely to win support, although it this penalty comes from concerns about the illegal entry
seems plausible that respondents’ perceptions about la- itself, about future lawbreaking, or from other factors is
bor market demand or expectations about immigrants’ a productive question for future research. Social desir-
societal contributions also matter. Computer program- ability concerns should be muted with respect to unau-
mers and financial analysts are in high-skill professions, thorized immigrants, as our respondents have a clear,
but not ones that advantage would-be immigrants as de- nonracial rationale for treating them differently. In this
cisively. The bonuses are 9.8 (SE = 3.6) and 7.9 (SE = 3.8) light, the fact that a shift from German to Iraqi origin
percentage points, respectively. Job experience makes an (–14.5) has a more negative impact than a shift from never
immigrant more desirable as well. In a sense, our sur- having visited the United States to having come without
vey respondents act like employers, screening for those authorization (–10.8) is informative. It suggests that re-
who will contribute to the U.S. economy. But they also sponses to immigrants’ countries of origin vary in mean-
apply noneconomic criteria about different professions’ ingful ways, even with social desirability potentially at
relative contributions. This pattern is in keeping with the work.
sociotropic hypothesis. To better understand the substantive meaning of
Turning to the applicant’s job plans, we observe that these results, Figure 3 illustrates the predicted proba-
immigrants who have a contract with an employer earn bility of being preferred for admission from our base-
significantly more support than those who have con- line model for immigrant profiles that correspond to the
ducted interviews or will look for work after arriving. 1st, 25th, 50th, 75th, and 99th percentiles of estimated
This observation lends credence to the idea that labor support. The first percentile is occupied by a Sudanese
market demand is influential, with Americans more inter- gardener with a fourth-grade education, no English, lit-
ested in immigrants if U.S.-based employers signal their tle job experience, no plans to work, and a prior unau-
need. At the same time, immigrants without plans to work thorized trip. Such an immigrant would win support in
are penalized more than immigrants with any other sin- 8.1% of pairings (SE = 4.9). On the other extreme is a
gle attribute. Immigrants who do not plan to work are German research scientist with a graduate degree, fluent
15.1 percentage points (SE = 1.5) less likely to be sup- English, 3–5 years of job experience, and a job contract
ported than an immigrant who will look for work after who had previously visited the United States many times.
arriving, and 26.9 percentage points less likely than an This applicant wins support 87.7% of the time (SE = 5.3).
immigrant with a contract. This observation is compati- Taken together, our findings reveal that Americans’ views
ble with explanations based on immigrants’ expected tax about immigrants vary dramatically depending on their
burden or their compliance with American norms. By attributes.12 JENS HAINMUELLER AND DANIEL J. HOPKINS
FIGURE 3 Estimated Probability of Being Preferred for Admission for Selected Immigrant
Profiles
Gender: Male
Education: graduate degree
Language: fluent English
Origin: Germany
Profession: research scientist
Job experience: 3−5 years
• percentile: 99
Job plans: contract with employer
Application reason: seek better job
Prior trips to U.S.: many times as tourist
Gender: Male
Education: two-year college
Language: broken English
Origin: Mexico
Profession: nurse
Job experience: 1−2 years • percentile: 75
Job plans: interviews with employer
Application reason: seek better job
Prior trips to U.S.: many times as tourist
Gender: Male
Education: high school
Language: broken English
Origin: India
Profession: teacher
Job experience: 1−2 years • percentile: 50
Job plans: interviews with employer
Application reason: seek better job
Prior trips to U.S.: never
Gender: Male
Education: 8th grade
Language: tried English but unable
Origin: China
Profession: construction worker
Job experience: 1−2 years
• percentile: 25
Job plans: interviews with employer
Application reason: seek better job
Prior trips to U.S.: never
Gender: Male
Education: 4th grade
Language: used interpreter
Origin: Sudan
Profession: gardener
Job experience: 1−2 years
• percentile: 1
Job plans: no plans to look for work
Application reason: escape persecution
Prior trips to U.S.: once w/o authorization
0 0.1 0.2 0.3 0.4 0.5 0.6 0.7 0.8 0.9 1
Pr(Immigrant Preferred for Admission to U.S.)
Note: This plot shows the estimated probability of being preferred for admission to the United States. The estimates are shown for
selected immigrant profiles that refer to the 1st, 25th, 50th, 75th, and 99th percentiles of the distribution. The estimates are based on
the benchmark OLS model with clustered standard errors; bars represent 90% confidence intervals. Note that by virtue of forcing
each respondent to choose one of the two profiles, the baseline probability of choosing a randomly drawn immigrant profile is 0.5.
Interactions with Respondent tion attitude, gender, and age. The SI describes the coding
Characteristics of each moderator.
These baseline results enable us to jointly assess the im-
portance of various theoretical approaches to immigrant-
Economic Self-Interest
related attitudes. Yet our empirical design allows for more If attitudes toward immigrants are shaped by labor market
finely grained tests, as several of the hypotheses devel- concerns, we should expect that native-born Americans
oped above also posit interactions between immigrants’ with skills or professions similar to a particular immi-
attributes and respondents’ characteristics. For example, grant will be more opposed to that immigrant. We first
the evidence that well-educated immigrants are favored consider skill levels, imperfectly approximated by whether
is compatible with hypotheses about labor market threat or not respondents have any college education. Figure 4
if such responses are concentrated among those in less presents the estimated marginal effects when replicating
competition with highly skilled immigrants. Here and in our benchmark model for the subsamples of respondents
the SI, we consider a variety of potential moderators of the with and without any college education. We see little ev-
effects to better distinguish between the different theoret- idence of an interaction between respondents’ education
ical arguments. Those moderators include the KN pan- and that of their preferred immigrants, with both Amer-
elists’ education, profession, exposure to immigration in icans who attended college and those who did not pre-
their industry, household income, fiscal exposure to im- ferring well-educated immigrants. If anything, it is the
migration, ethnocentrism, race/ethnicity, neighborhood college-educated Americans who are more favorable to-
diversity, partisanship, political ideology, prior immigra- ward research scientists and financial analysts. Here andTHE HIDDEN AMERICAN IMMIGRATION CONSENSUS 13
FIGURE 4 Effects of Immigrant Attributes on Probability of Being Preferred for Admission by
Education of Respondent
Educational attainment: No College Educational attainment: Some College or More
Gender:
female
male
Education:
no formal
4th grade
8th grade
high school
two−year college
college degree
graduate degree
Language:
fluent English
broken English
tried English but unable
used interpreter
Origin:
Germany
France
Mexico
Philippines
Poland
India
China
Sudan
Somalia
Iraq
Profession:
janitor
waiter
child care provider
gardener
financial analyst
construction worker
teacher
computer programmer
nurse
research scientist
doctor
Job experience:
none
1−2 years
3−5 years
5+ years
Job plans:
contract with employer
interviews with employer
will look for work
no plans to look for work
Application reason:
reunite with family
seek better job
escape persecution
Prior trips to U.S.:
never
once as tourist
many times as tourist
six months with family
once w/o authorization
−0.2 −0.1 0.0 0.1 0.2 −0.2 −0.1 0.0 0.1 0.2
Effect on Pr(Immigrant Preferred for Admission)
Note: These plots show estimates of the effects of the randomly assigned immigrant attributes on the probability of being preferred
for admission to the United States. Estimates are based on the benchmark OLS model with clustered standard errors estimated for
the group of respondents without and with some college education, respectively; bars represent 95% confidence intervals. The points
without horizontal bars denote the attribute value that is the reference category for each attribute.
in all subgroup analyses, we present the results separately desirable when they speak English, have a job contract,
by subgroup in our figures, while using joint models with and have no history of unauthorized entry.
interaction effects to estimate the statistical significance Another test of labor market competition considers
of any differential effects.8 Hypotheses based on relative whether respondents are more likely to oppose an im-
skill levels do little to make sense of these results, although migrant who shares their profession. Here we augment
hypotheses based on immigrants’ sociotropic impacts are our benchmark model to include an indicator variable
consistent with this pattern. Examining other attributes, for whether the immigrant’s listed profession matched
we see that the responses are quite similar irrespective of the respondent’s. The results are shown in SI Table B.2.
the respondents’ educational levels. Whether college ed- Respondents are not less likely to prefer or support an
ucated or not, Americans agree that immigrants are more immigrant who shares their profession—the point esti-
mates are very close to zero and insignificant. Similarly, SI
Figure B.1 illustrates that respondents who work in indus-
8
The AMCEs of financial analyst and research scientist are both tries with high or low concentrations of immigrants are
significantly different for respondents with and without college not much different in their responses. None of these tests
education, at p < .0005 and p < .005, respectively. To test for dif- uncovers evidence consistent with labor market threat.
ferences in the conditional AMCEs, we fit a fully interacted model
to the pooled data and then conduct an F-test against the restriction Other interest-based hypotheses lead us to expect
that the conditional AMCEs are the same in both samples. individual-level differences as well. For example, if14 JENS HAINMUELLER AND DANIEL J. HOPKINS
voters are concerned that immigrants will increase public country of origin. More ethnocentric respondents
spending, such concerns might be especially pronounced impose somewhat more of a penalty for immigrants from
among those whose income or state of residence exposes non-European countries.10 This negativity is pronounced
them to potential tax increases (Hanson, Scheve, and for immigrants from countries with significant Muslim
Slaughter 2007). In SI Figures B.2 and B.3, we present populations, but it extends to Mexico, China, and the
the results separately based on respondents’ household Philippines as well. More ethnocentric respondents also
income and fiscal exposure to immigration. We find no place less emphasis on the immigrant’s occupation.
meaningful change in the penalty for such immigrants These results are consistent with ethnocentrism playing
across these subsets.9 Taken together, these results suggest a role in attitudes toward immigrants.
that fiscal concerns stemming from material self-interest In the SI, we consider differences in responses
are far from paramount. Still, these findings are consis- based on respondents’ racial/ethnic backgrounds as
tent with sociotropic concerns: Immigrants who have no well as the demographics of their ZIP codes. Those
plans to work might be perceived as a burden for the living in ZIP codes with few immigrants, many
country as a whole. Mexican immigrants, and many immigrants from coun-
tries other than Mexico all show highly similar pref-
erences about immigrant attributes (Figure B.4). So,
Ethnocentrism, Race, and Ethnicity too, do respondents who are white and nonwhite
(Figure B.5). The SI also presents the results when
Today’s immigrants to the United States come predom- we consider the 152 Hispanic respondents separately
inantly from Asia and Latin America, making them dis- (Figure B.6). The small sample size means that the esti-
tinctive from America’s non-Hispanic white majority. mated effects have considerable uncertainty. But even so,
Variants of the hypotheses emphasizing these ethnic and the pattern for Hispanic respondents is broadly similar
racial differences lead us to expect some respondents to to that for other groups, as they place significant weight
make extensive use of immigrants’ countries of origin in on education and assess immigrants from most coun-
judging their fitness for admission. Here, we discuss three tries similarly. Hispanic respondents do appear to place
such moderators: respondents’ ethnocentrism, their eth- more of an emphasis on the immigrant’s education than
nic/racial identification, and the demographic composi- non-Hispanics, and they apply much less of a penalty
tion of their ZIP code. for unauthorized entry. Non-Hispanics penalize a prior
Following Kinder and Kam (2009), we assess eth- unauthorized entry by 11.9 percentage points (SE = 1.7),
nocentrism through respondents’ sentiment toward vari- whereas for Hispanics the comparable figure is just 1.6
ous ethnic/racial groups, which we measure using feeling percentage points (SE = 5.0). That difference is right at
thermometers included in the panel’s first wave. The level the cusp of statistical significance (p ≈ 0.05), and it is an
of ethnocentrism is computed as the feeling thermome- important limit to the attitudinal consensus on desirable
ter score for the respondent’s ingroup minus the average immigrants. The fact that Hispanics view unauthorized
feeling thermometer score across the outgroups relevant entry differently—and that unauthorized immigration is
to immigration (i.e., immigrants, Latinos/Hispanics, and a salient dimension of contemporary debates—provides
Asian Americans). For this estimation, we break the eth- one explanation for why despite the attitudinal consen-
nocentrism measure into two equally sized bins, splitting sus we identify, there is little consensus in immigration
the sample on the median ethnocentrism value. policymaking.
In Figure 5, we reestimate the benchmark model
separately for respondents with low and high levels of
ethnocentrism. The patterns are quite similar for these Party Identification and Ideology
groups. In both cases, education, speaking English,
Since partisanship is a central source of structure
some high-status professions, job experience, and prior
for contemporary Americans’ political attitudes (e.g.,
trips are valued. Also, the two groups take decidedly
Levendusky 2009), Figure 6 examines whether Repub-
negative views of those who do not plan to work or enter
licans and Democrats exhibit different preferences about
without authorization. Yet there are some differences,
immigrants. The findings are in stark contrast to a sig-
especially with respect to the prospective immigrant’s
nificant body of literature finding that Republicans and
9
Democrats respond differently to cues, whether on im-
We cannot reject the null that the conditional AMCEs for the
immigrant education and “no plans to work” attributes are the migration (e.g., Knoll, Redlawsk, and Sanborn 2011) or
same in both fiscal exposure subsamples (p ≈ .36 and p ≈ .61,
respectively). 10
The p-value for the difference in AMCEs is p < .05.You can also read