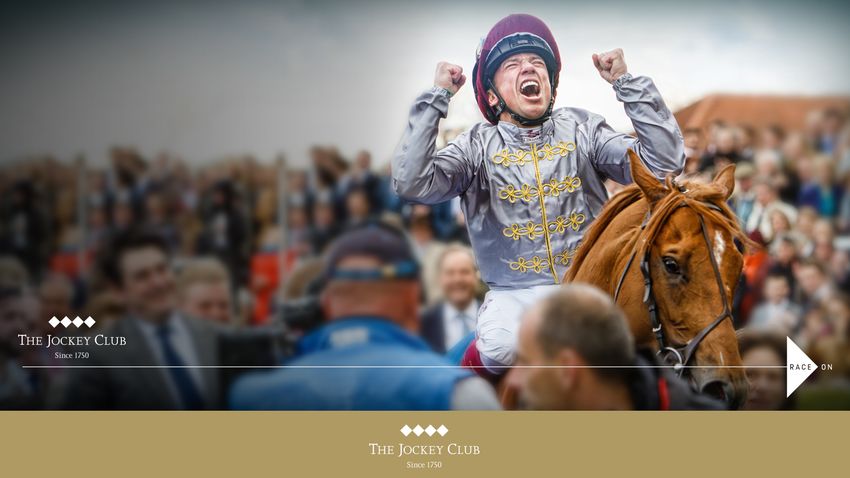
The Jockey Club Round Table Conference on Matters Pertaining to Racing - August 12, 2018
←
→
Page content transcription
If your browser does not render page correctly, please read the page content below
The Jockey Club
   Round Table Conference
on Matters Pertaining to Racing
        August 12, 2018
Stuart S. Janney III
     Chairman
  The Jockey Club


The Jockey Club
   Round Table Conference
on Matters Pertaining to Racing
        August 12, 2018
Laura Barillaro
Executive Vice President &
  Chief Financial Officer
    The Jockey Club
6.5 million unique visitors
60% younger than 50
85% younger than 44
GPS Automated Tracking
The Jockey Club Scholarships

   Jacqueline Schumacher               Brianna Vitt
TJC Jack Goodman Scholarship   The Jockey Club Scholarship
2019
Foal Crop Estimate

    21,500
“ All licensed racing and training facilities
to include monitoring and recording information
in the Equine Industry Database concerning
fatalities and horses observed lame by an official
veterinarian during training hours in addition
to recording relevant information related
to soundness issues of the horse.”Laura Barillaro
Executive Vice President &
Chief Financial Officer
The Jockey ClubThe Jockey Club
Round Table Conference
on Matters Pertaining to Racing
August 12, 2018THE JOCKEY CLUB 1750, today and tomorrow Simon Bazalgette Group Chief Executive
HOW IT
ALL BEGAN…
1750
EARLY BEGINNINGS
Founded in 1750 by a group of
prominent figures in British society
• As a club for those passionate about the Thoroughbred and
  horseracing
• Established an early stated purpose for meeting to “promote the
  improvement of the Thoroughbred and the prosperity of the Turf”
• Soon The Jockey Club established rules to ensure races on
  Newmarket’s ‘Heath’ were run fairly – the basis of the Rules of
  Racing globally today
THE JOCKEY
CLUB ROOMS
EVOLUTION
The Jockey Club established a
key role at the heart of horseracing
• Over time, The Jockey Club took on the responsibility of becoming
  the official governing body of horseracing in Britain

• Members have included many members of the British Royal Family
  – and overseas Royalty – and no fewer than six Prime Ministers

• When the sport needed The Jockey Club’s help to save many of its
  leading assets, this set a course for it to play a very different future
  role
TODAY
The Jockey Club
Is the largest commercial group in British Racing and our
operations include staging several of Britain’s most iconic events
OUR MISSION
Governed by Royal Charter, The Jockey Club’s
mission is to act for the long-term good of British
Racing in all that we do

In practice, this means:

•   Investing all our profits back into racing
•   Promoting excellence (e.g. quality racing)
•   Driving and introducing innovation
•   Working with others with a similar vision
•   Always taking decisions for the long-term
OUR VISION
For British horse racing to
be the best in the world for
many years to come and to
inspire millions to enjoy it
OUR STRUCTURE
GREATEST FOCUS
OF PREVIOUS 10 YEARS?
THE EXPERIENCE
IS EVERYTHING

Putting the CUSTOMER at the centre of all we do:
• Investing to get the customer experience right
• Instead of starting with what we want or we think

Areas this has included:
• Major investment in facilities        • New products
• Data insights & analysis              • Innovations
• CRM & loyalty                         • Partnerships & joint ventures
• Fan engagement                        • Dynamic pricing model
• Brand development                     • Enhancing experience vs profit
CUSTOMER GROWTH STRATEGY
(TACKLING ‘1.2 TIMES’ A YEAR)

Acquisition                                     Retention                    Frequency
To identify and convert                         To maintain a relationship   To inspire the Customer
Crowd and Community                             with the Customer in order   to visit more than one event
into ticket buying                              to get them to repeat any    in our portfolio in that year
customers                                       event once the following     or season
                                                year or season
                          On ticket purchase,
Result:                    they become a                                     Result:
Book for the first time
                               ‘customer’       Result:                      Book for multiple events
                                                Repeat book for an event     in a year (and engage with
                                                the following year (and      our content and partners,
                                                engage with our content      watch broadcast,
                                                and / or watch broadcast)    purchase merchandise,
                                                                             consider racehorse
                                                                             ownership)

                    A) Engaging customers and b) providing them with a
                        fantastic experience are key to this journey
DATA & CUSTOMER INSIGHT AT THE HEART OF OUR STRATEGY
MORE FANS = MORE EVERYTHING

Casual link between the size of your engaged fan base and:

Attendances               increased atmosphere & revenues

Media consumption                  increased profile & media rights revenues

Racehorse owners & syndicate members                            increased horse population

Commercial Partners                  bigger / better deals & activations

Betting turnover                returns for racing

At The Jockey Club:

                      prize money
                                                                               to sustain, improve &
 Profits    =         facilities for customers & participants              =   grow the sport
                      investment in innovations & people
SUCCESSES AND CHALLENGES
RECENT SUCCESSES:
1. FINANCES

Wins include:

• Revolutionising media landscape – unlocking significant value

• Resolving Horserace Betting Levy leakage – after offshore moves and with
  a highly competitive betting market, not a racing-controlled monopoly

• Attracting a wide range of new commercial partners to get involved

• These have powered our ability to provide record prize money to horsemen
  and major investment in facilities for customers and participants
RECENT SUCCESSES:
2. STRUCTURE

Wins include:
• Introducing an effective ‘tri-partite’
  governance structure for British Racing
• Creating championships and series to
  follow and world’s best fixture on ratings
  (British Champions Day)
RECENT SUCCESSES:
3. REACH

Wins include:
• Increasing awareness and interest levels
• Attracting major terrestrial broadcaster (100+ fixtures)
• Increasing media coverage and social media
  engagement
• Attracting new commercial partners for promotion and
  funding
CHALLENGES OF OUR TIME:
1. EQUINE WELFARE

The horse comes first

• We view the welfare of racehorses as our sport’s number one priority
  •   Without them we are nothing!

• But also our sport’s greatest weakness – public perception is all

• Is there more we can do on a global basis to tackle the challenge?
CHALLENGES OF OUR TIME:
2. FUNDING

Bracing for a commercial hit
• Just when revenue lines we control are doing well
  and Levy leaks resolved
• The UK Government is cracking-down on Fixed
  Odds Betting Terminals in licensed betting offices –
  likely to result in widespread shop closures
• Independent estimates suggest a multi-million
  pound adverse impact on British Racing’s funding
  from a) reduction in media rights and b) Levy
CHALLENGES OF OUR TIME:
3. RELEVANCE
Providing a ‘reason to care’ about racing / reaching
the next generation
• The fight for relevance seems to be the same the world over
• We are up against global players such as football, Olympic
  sport and F1, along with locally popular sports, leisure and
  entertainment properties
• Can we do more together promoting racing in a globally-
  connected world?
INCREASED AWARENESS - INTEREST DOUBLED IN FIVE YEARS
                       % UK public interested in horseracing
    25

    20

    15

    10

     5

     0
      2010      2011             2012             2013            2014        2015

             Source: ComRes omnibus surveys commissioned by The Jockey Club
CONSIDERATION AND COMMITMENT IS TO COME… Source: Two Circles study commissioned by Racecourse Association and Great British Racing (results 2016)
SOME OF WHAT WE ARE
DOING
The Jockey Club has introduced a series of
initiatives, including:

• Investing in targeted digital content

• Championship Horse Racing – Team Racing

• City Racing – street races in major cities

• Championing diversity – all fans & talent

• Rewards4Racing – loyalty scheme

• Working with influencers & celebrities

• ‘Horseplay’ family concept

• ‘Racing Explained’

• Series including ‘Chase Triple Crown’
BRAND-LED
THINKING
Started to consider British Racing
– and The Jockey Club – as a
brand
TO CONCLUDE:
A RALLYING CALL
THE FUTURE
Do we have a shared ambition?

No matter where we are in the world or
our particular piece of the puzzle…

To leave Thoroughbred horseracing in better
shape than we found it?
THANK YOU

         @SimonBazalgette
simon.bazalgette@thejockeyclub.co.uk
The Jockey Club
Round Table Conference
on Matters Pertaining to Racing
August 12, 2018Ian D. Highet Secretary-Treasurer The Jockey Club
2018 Strategy Refresh

August 2018
2011
Trends                                                            Handle               Attendance
Percent change, 2000 - 2010

                                                                       37%                30%

                                                      Starts per horse                 Race days

                                                                       14%                14%

                              SOURCE: The Jockey Club Fact book, Selected racetracks                62
2011 Growth strategy for Thoroughbred racing
1 Fewer, better race 2 Innovative wagering 3 Integrated rewards
days platforms
4 New televised 5 Simplified betting 6 Social game
racing initiatives via free-to-play
game
7 Integrity and safety 8 Ownership tools 9 Disseminating best
reforms practices among
tracks
63
63Racing In 2011, coverage was at an all time low
on national National TV hours
200
broadcast/ 175
basic cable TV >150
92
43
Thoroughbred Poker Bowling Thorough- Thorough-
racing 2003 2011 2011 bred racing bred racing
2011 2017
SOURCE: Network schedules 64Tech/media developments since 2011
Pay TV Millennials Stick-and-ball Netflix
Subscribers watching TV sports ratings subscribers
2011 88% 10 million
37% 6% p.a.
Today 79% 125 million
SOURCE: Nielsen, Netflix 65Growth Themes
Innovations in venues
Digital content, data, and marketing
Advanced analytics
Legalization of sports betting
66James L. Gagliano
President and Chief Operating Officer
The Jockey ClubSituation Analysis:
Horseracing today
68After declining United States Thoroughbred handle, 2006-2017
USD Millions
through 2011,
handle has
stabilized 15,000 14,785
-6.1% p.a.
14,000
13,000
+0.2% p.a.
12,000
10,770 10,909
11,000
0
2006 07 08 09 10 11 12 13 14 15 16 2017
SOURCE: TJC Factbook 69The Thoroughbred
industry 2011-2018 Foal Crop Total Starters
1% 4%
per year per year
Field Size Number of US Races
8.04 -3%
per year
to 7.7
70Handle is Handle by track tier, 2011-2017
becoming $M
2011 2017
concentrated in handle,
$M
handle,
$M
CAGR
%
Tier 1 tracks 7,000
Tier 1 5,645 6,886 3
6,500
6,000
5,500
5,000
4,500 Tiers 5,126 4,271 -3
4,000 2&3
3,500
2011 12 13 14 15 16 2017
Note:12 tracks in Tier 1, 27 tracks in Tier 2, 57 Tracks in Tier 3
SOURCE: Equibase 71Tier 1 vs. Tiers 2 & 3: Tier 1 Tiers 2 & 3
races and handle 5,645
6,886 5,126
4,271
per race Handle, $M
42,731
34,459
Total 9,517
9,375
number of
races
$724K $120K $124K
$604K
Handle/
race
2011 2017 2011 2017
SOURCE: Equibase 72Handle has % handle
increased 2017
# of Races
Race Class 2017 Total
handle/race
change
over 7 years
in the ‘best racing’ 240
Grade I /
$3,575K 3%
Grade II
Other
1,792 $464K 5%
Stakes
4,776 Maidens $334K 3%
7,394 Allowance $276K 2%
26,644
Claiming $209K -1%
and Other
SOURCE: Equibase 73ADWs are Handle by betting channel, 2011-2017 % of % of
now 33% of USD M total, total, CAGR
2011 2017 ’11-’17
handle 8,000
7,000
Off-track 72 58 -4
6,000
5,000
4,000
ADW 17 33 14
3,000
2,000
1,000 On-track 11 10 -3
0
2011 12 13 14 15 16 2017
SOURCE: TJC Factbook, State Racing Commissions 74Computer assisted CAW as a percent of handle for sample Tier 1
wagering now tracks 2013 2017
represents 16% to 19% 19
of total handle 17 17
16
11
10
8 8
Track Track Track Track
A B C D
SOURCE: Sample data from four racetracks 75Starters, owners
and foal crop In thousands
65 CAGR
65 62 2011-2017
60 58
55
55 53 52 51
50 Unique starters -4%
45
40
35 32 31
30
29 28 26 26 25
25 23 Registered owners1 -4%
20 Foal crop -1%
21 21 21 21 21 21
15
10
5
0
2011 12 13 14 15 16 17
1 Unique owners registered for a starter at each race
SOURCE: TJC Factbook, Equibase 76Super trainers1
Super trainers
Other
Annual Starts per horse
Starters earnings (indexed)
100
17% 90
33%
83%
67%
2017 2017 2017
1 Super trainers defined as those having at least 100 active horses or more in a year
Note: horses that switch trainers during the year are counted for both trainers, but only for their starts for each trainer, which lowers the overall starts/year. As a
result, starts/year for super trainers is not directly comparable to starts/year for all horses or for graded stakes horses.
SOURCE: Equibase 77Horse racing has
seen an % who agree/strongly agree
improvement in 2011 2018
70% 69%
public perception
since 2011 41%
45%
22%
19%
Positive Racing Average of other
impression of sports1
Horse Racing Recommend
sport to others
1 Other sports include NFL Football, NBA Basketball, NASCAR 7 and MLB Baseball
SOURCE: McKinsey 2018 Thoroughbred Racing Consumer Survey (N=1,351), McKinsey “Digital Diaries” 78~16M Americans Racing fans as a percent Racing fans
(~6% of U.S. adults) of US adult population
follow Thoroughbred
Total: 16M
Whales
320 Bet at least
racing $600K/ year
Fans using ADW
0.5M1 Fans with an
Non-fans 81%
ADW account
6% Fans
Avid fans
13% 2.6M Bet or attend 12+
Lapsed times a year
core
fans
Casual fans
5.0M Bet or attend 3-11
times a year
2017 US adult population =
~251.5M people Occasional
8.3M Bet or attend 1-2
times a year
1 Survey data suggests 22% of casual and avid fans use ADW, which would imply 1.7M fans using ADW
SOURCE: United States Census Bureau, McKinsey 2018 Thoroughbred Racing Consumer Survey (N=1,351), NYRA Bets 2016-17 data 79Average
age of fans Median age of television viewers by sport
64
64
63 PGA tour
62
Horse racing
60 59
58
58 NASCAR
56 MLB
56 57
54
52
52
50
50 49 NFL
48
46
46
44
42
42 NBA
40
0
2006 2007 2008 2009 2010 2011 2012 2013 2014 2015 2016
SOURCE: MAGNA Global, Sports Business Journal 80New fans see New and long-term1 fans at the track
racing as a group % of fans attending the racetrack with…
social experience
New fans Long-term fans
45%
42%
41%
23%
17%
16%
Small group of Large group of Adult family
friends (1-3) friends (4+) members
1 New fans defined as those joining the sport in the past 5 years; long-term fans defined as those joining the sport prior to 5 years ago
SOURCE: , McKinsey 2018 Thoroughbred Racing Consumer Survey (N=1,351), 2018 McKinsey Digital Diaries Consumer Research 81The Jockey Club
Round Table Conference
on Matters Pertaining to Racing
August 12, 2018Ian D. Highet Secretary-Treasurer The Jockey Club
Summary of Situation Analysis
                    Handle has stabilized

                    Volume of racing in slow decline

                    The best racing still growing

                    Bettors rapidly switching to digital

                    Progress on public perception
                                                           84
The Jockey Club
Round Table Conference
on Matters Pertaining to Racing
August 12, 2018You can also read