THE SOCIAL CHALLENGE FOR TODAY'S CEO - March 2021 - OneFifty ...
←
→
Page content transcription
If your browser does not render page correctly, please read the page content below

THE SOCIAL CHALLENGE
FOR TODAY’S CEO
March 2021

THE SOCIAL
CHALLENGE FOR
TODAY’S CEO
Authentic communication from
the C-suite has lost its novelty,
but has it gained in prevalence?
Beyond the CEO, is social
communication now a tool
around the board table more
broadly? What works to attract
and engage an audience?

These are questions leaders and
communicators alike need to
consider, and we’ve examined
through the lens of FTSE 100
executive directors.

5%
                              ONLY

                        OF
                EXECUTIVE DIRECTORS
                  POST REGULARLY

(At least 3 times a month on either their LinkedIn or Twitter channel)
HOW MUCH IS SOCIAL MEDIA ACTUALLY
USED BY FTSE 100 EXECUTIVE
DIRECTORS?
• Our research across 152 FTSE 100 executive directors found that 84% of all FTSE 100
  executive directors have a public LinkedIn or Twitter account. But only 5% of
  executive directors post regularly (at least 3 times a month on either their LinkedIn
  or Twitter channel).
• There was a notable absence of executive directors on Instagram, YouTube, or
  TikTok. We found only one executive director professionally using a public Instagram
  channel Bernard Looney, BP) and no executive director (to-date) is using YouTube
  or TikTok in a professional capacity.
• Use of social media is more common among computer software and retail
  companies, such as Sage, Unilever, Morrisons and Avast.
• FTSE 100 companies are failing to disclose social media channels of their executives.
  We estimate that 95% of companies included in the FTSE 100 index do not disclose
  public social media channels of their executive directors on their ‘our management’
  pages. BP, for example, has chosen to do it. See here.
• There is no explicit guidance from the FCA* on whether you have to disclose
  Executive profiles. However, they recognise that social media is a powerful channel
  to communication and therefore of significance to firms. One could argue that the
  disclosure of Executive profiles are part of an adequate record.

WHICH C-SUITE
MEMBERS ARE THE
MOST ACTIVE ON
SOCIAL MEDIA?
CEOs are instrumental - 89% of
executive directors with an active social
media presence (at least 3 posts a
month) are CEOs. They are pretty much
the only executive directors with a social
media presence and an engaged
audience.
Our research concluded that CFOs are
posting far less and they have lower
engagement rates than CEOs,
especially on Twitter.
WHO USES SOCIAL
MEDIA MOST
EFFECTIVELY TO
BUILD A PERSONAL
PROFILE?
Women are doing it better. 61% of
female FTSE 100 executive directors**
have a public social media page on
Twitter and/ or LinkedIn. In comparison,
only 53% of male FTSE 100 executives
directors are present on social media.
COMPANY/
FEMALE EXECUTIVE DIRECTOR SOCIAL FOLLOWING
ROLE
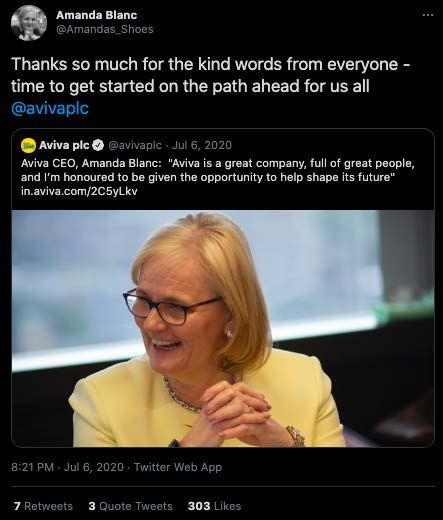
Amanda Blanc CEO, Aviva LinkedIn, Twitter (12k followers)
Alison Rose CEO, NatWest LinkedIn (7k)
Alison Dolan CFO, Rightmove LinkedIn (3k)
3
       THERE ARE

THINGS THAT DRIVE BETTER
    ENGAGEMENTS…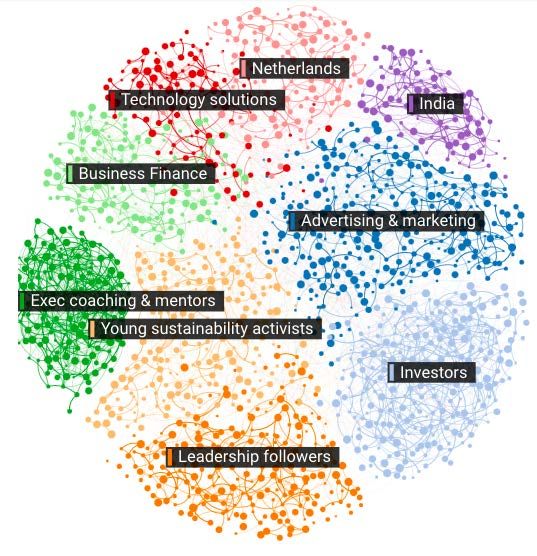
WHAT DRIVES BETTER ENGAGEMENTS?
  The truly social executive director is somewhat rare, but there are a few
  leaders demonstrating what it looks like, such as, Bernhard Looney (BP),
  Alan Jope (Unilever), and Amanda Blanc (Aviva).
  There are 3 things highly engaged executive director profiles have in
  common when it comes to social media behaviours and content:
  • Content is personal & value-driven
  • Content shows passion for topics beyond corporate news
  • They listen and engage

               `

    Building a trustworthy        Achieves confidence and        Brings together expert and
relationship with her followers   differentiation by sharing      engaged voices, with the
  through authentic, honest,        personal interests and        transparency of a public
     and genuine content              progressive values                  debate.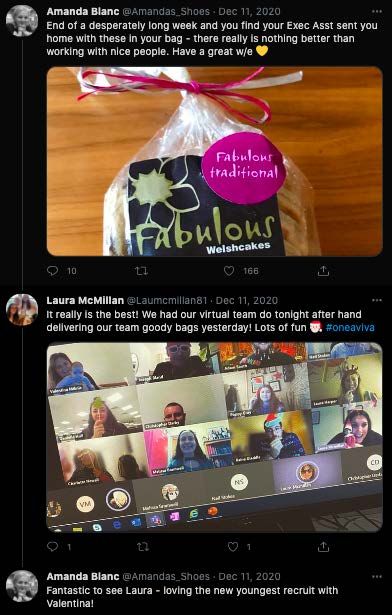
`

LISTEN
&
ENGAGE
95%
        A HUGE

OF FOLLOWERS ARE LURKERS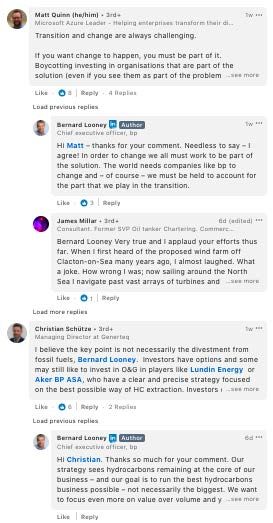
WHAT AUDIENCE FOLLOWS THEM?
• Surprisingly, the combined following of FTSE 100 executive directors across
  Twitter & LinkedIn is (only) 564k - 56k on Twitter, and 497k on LinkedIn. That per
  se is not an issue, as long as the groups they reach, are the ‘right’ ones (e.g.
  corporate stakeholders, media, etc.).
• The people and accounts who we expected to follow executive directors are
  actually following them - they're broadly talking to audiences focussed on
  strategic areas of the business: global leadership followers, business finance &
  investors. We’re sharing a network graph across all followers of an executive
  director to illustrate that point later in this section.
• Adding to the governance point we raised earlier in this report; we can argue
  that social channels of executive directors, given their relevant follower
  composition, is an appropriate channel to receive feedback* and should
  therefore be transparent as such.

• But first, we found some evidence that companies are doing a ‘mediocre’ job at
  creating synergies between the networks of their executive directors: the number
  of unique followers is actually very high (98%), which suggests that accounts
  who follow an executive director are NOT a homogenous group - they don’t
  follow multiple executive directors.
• Among the followers, there’s a heavy 43% London-based skew. Overall, there is -
  an unsurprising - lean towards major cities, like New York, Amsterdam, Paris,
  and San Francisco.
• 95% of followers are lurkers (= those who post lower than 15 times a month),
  which is what we normally tend to see for audiences of senior decision-makers.
  For instance, an audience across senior business leaders and decision-makers
  has 96% lurkers.
• We found no evidence that companies are spending money and efforts on vanity
  follower counts; the ratio of fake followers (10-15%) is low.
9
       THERE ARE

DISTINCT COMMUNITIES WHO
       FOLLOW CEOS
WHAT AUDIENCE FOLLOWS THEM? To illustrate ‘who follows them ’, we generated this network map of all 55k accounts who follow a FTSE 100 executive director on Twitter. • Each dot marks a follower, each line marks a connection between them (e.g. a common connected, shared content they engage with/ interests, etc.). • There you can see the types of people (communities) who follow an executive director, and their network structure (as a community, as well as between the groups). Some members of a group are densely networked (the chances they engage with each other’s or similar content is high), others are only loosely connected (and they probably don’t talk to each other on Twitter). • It also matters where the groups sit on that map. The more central a group, the wider and faster their content will spread into the wider network. Communities at the periphery are often isolated and content is likely to be discussed only among them.
Why is it useful to analyse?
• Better outcomes occur when you understand a) who the most central
  accounts are (they spread information more effectively into the wider network)
  and b) how groups are interlinked (a group which isn’t well connected will need
  a different penetration to engage than one that is)

A few more words to help read the network graph…
• There are 9 distinct communities, with not much overlap (we only see very few
  lines crossing into other groups). Broadly speaking, we can say that executive
  directors are followed by
• People who service them (e.g. coaches / marketeers)
• Business stakeholders (e.g. investors) & services (finance, tech)
• Fans / peers (e.g. leadership followers)

At the periphery, we also see two regional clusters; one in India, one in the
Netherlands. These are stakeholders, leadership followers, and foodies who sit
around JUST EAT CEO Jitse Groen. On the other hand, we have an Indian-based
activist cluster that engages with progressive causes around free election,
freedom of speech, or fair trade. Here’s an example of a post of data privacy that
was among the most shared pieces of content within that cluster. Also interesting
is the cluster young sustainability activist cluster formed around Alan Jope. Nearly
half of the progressive cause activists are below 35 years old. Here’s an example
of their most shared content.

 WHAT’S THE TAKEAWAY?
 Next to the traditional business stakeholders there
 are large groups who pay attention to executive
 directors on social. Where values align, we have seen
 new audiences being formed that can amplify what
 businesses and their leaders stand for/ are looking to
 change.

 But, they need a fundamentally different approach
 to the traditional business stakeholder.
IN SUMMARY, WHERE ARE THE
OPPORTUNITIES?
Right NOW social profiling is where executive directors can stand out from the
crowd - it’s not a very competitive field
• Female executives are out-performing their male counterparts when it comes to
  their social media presence, but they are yet an underutilised asset for many
  businesses
• Personal views and passion is what makes content win, less so the corporate
  news you’re used to
• There’s a risk that social and executive profiling isn’t taken seriously enough from
  a governance point of view?
SOME MORE DATA POINTS
Top 5 executive directors by   Top 5 by posting frequency      Top 5 by engagement rate***
LinkedIn + Twitter followers   (original posts or QTs)

Bernhard Looney, CEO at BP     Steve Hare, CEO at Sage         Alan Jope, CEO at Unilever
105k combined followers        21 tweets per month             3.04% Tw ER

Alan Jope, CEO at Unilever     Alan Jope, CEO at Unilever      Amanda Blanc, CEO of Aviva
58k combined followers         10 tweets per month             1.20% Tw ER

Ben van Beurden, CEO at Shel   Luke Jensen, CEO at Ocado       Steven Harre, CEO at Sage
55k combined followers         Solutions                       0.24% Tw ER
                               8 tweets per month

Jitse Groen, CEO at JUST EAT   Bernard Looney, CEO at BP       Alison Rose, CEO at NatWest
32.1k combined followers       12 LinkedIn updates per month   13.6% LI ER

Laxman Narasimhan, CEO at      Ondrej Vlcek, CEO of Avast      Nick Read, CEO at Vodafone
Reckitt Benckiser              12 LinkedIn updates per month   8.2% LI ER
31.2k combined followers
FOOTNOTES * FG15/4: Social media and customer communications, 1.3 and 1.25. Wates-Corporate- Governance-Principles-for-LPC-Dec-2018, principle six. ** Number of Women Exec. Directors: 31 (13.2%); those who have a social media Twitter or LinkedIn profile: 19. Number of Male Exec. Directors: 204 (86.8%); those who have a social media Twitter or LinkedIn profile: 108. Oct, 2020, Hampton Alexander Review *** Twitter engagement rate (ER) = Sum of likes/ comments/ shares divided by estimated reach (Meltwater), time period: Feb 20 - Feb 21. Average Twitter ER = 0.15%. LinkedIn engagements rate = Sum of likes/ comments/ shares divided by followers for the past 20 posts. Average LinkedIn ER = 2.7%
METHODOLOGY FOR THIS RESEARCH
We searched LinkedIn and Twitter for public social media accounts of FTSE 100 executive
board directors (status 01.02.2020). We excluded non-executive board directors. We
then manually reviewed whether they had a public Instagram, TikTok, or YouTube
channel and captured that information.

Our list to date contains 165 names. The time frame we based our analysis on was Feb
20 - Feb 21. Where data had to be collected manually, we looked at a 3-month time
window, Nov 20 - Jan 21.

To assess the performance of each individual, we used 5 metrics: audience size, posting
frequency, engagement rate, responsiveness, and third-party mentions.
     • Audience size - total number of followers across public channels
     • Posting frequency - average number of original tweets and QTs on Twitter and
        original LinkedIn updates
     • Engagement rate - total number of core engagements divided by the number of
        posts and followers. Core engagement = like, comment, share. We assumed that
        all core engagements are positive engagements
     • Responsiveness
     • Number of Twitter replies
            • On LinkedIn, we manually reviewed a sample set of activities in the past 3
              months and scored them between 1-5, depending on how often they reply
              to their followers or posts they were tagged in/ that are relevant to their
              role and business. 1 = no replies, 2 = likes relevant posts, but doesn’t
              respond to tags, 3 = likes and responds occasionally, 4 = likes, comments,
              and responds frequently, 5 = likes, comments, and responds frequently,
              and proactively engages with relevant people/ posts
     • Third party mentions - there is no meaningful way to quantify this metric on
        LinkedIn, so we decided to only use this as a Twitter-only metric. It’s defined as
        the number of RTs, QTs, and tweets that include an @-mention but aren't ad
        replies or customer service related

To overcome the fact that smaller accounts tend to see higher engagement rates even
though they aren’t actually posting much, we introduced a ‘lower limit’: we only took
into account those who have posted at least 3 times a month. With that in mind, we
then calculated
      • an average score for each of our 5 metrics and
      • a relative score for each individual - how are they performing vs the rest of the
        individuals (= the average score)

In our database, we also captured additional data for each individual. Namely, industry
of their company, role, geographic focus (UK vs global), and gender.

At OneFifty, we believe in full transparency. So, have a look at our spreadsheet here.
We see this as a dynamic panel, which we will be adding to over time. If you have any comments, or are missing a board-level executive from your company, please get in touch with anne-catherine@onefiftyconsultanyc.com
You can also read