The State of the Hudson 2020 - ENVIRONMENTAL HEALTH AND TRENDS OF THE HUDSON RIVER ESTUARY
←
→
Page content transcription
If your browser does not render page correctly, please read the page content below

The State of the Hudson 2020
ENVIRONMENTAL HEALTH AND TRENDS OF THE HUDSON RIVER ESTUARY
EXECUTIVE SUMMARY

Contributors & Acknowledgements
Authors and Contributors                                                                    Suggested citation
Nancy Beard, Chris Bowser, Mike Buzzelli, Scott Cuppett, Brian DeGasperis, Brian            The State of the Hudson 2020. The Hudson River Estuary Program, NY-NJ Harbor &
Duffy, Fran Dunwell, Sarah Fernald, *Stuart Findlay, Heather Gierloff, Ingrid Haeckel,      Estuary Program and the NEIWPCC. New York.
Ann Harrison, Laura Heady, Gregg Kenney, John Ladd, *Jim Lodge, Jacqueline Lendrum,
Mark Lowery, Megan Lung, Sherri Mackey, Jeff Mapes, Kristin Marcell, Susan Maresca,         Technical Review
Dan Miller, Nate Nardi-Cyrus, Chuck Nieder, Meghan Oberkircher, Rich Pendleton,             Phil DeGaetano, Stuart Findlay, Maggie Flanagan, Michelle Forster, Thomas Grothues,
Jennifer Phillips, *Rob Pirani, Dan Rearick, Jeff Rider, Beth Roessler, Bill Rudge, Maude   Jim Lodge, Christopher Nack, Chris Nadareski, Rob Pirani, Evelyn Powers, Lisa Roden-
Salinger, Zachary Smith, Clifton Staples, *Isabelle Stinnette, Meredith Streeter,           burg, Steve Stanne, Margie Turrin, John Waldman, Judith Weis, Isaac Wirgin, Dave
*Lindsey Strehlau, Koon Tang, *Madalyn Taylor, Eric Wiegert, Steve Zahn, *Peter             Yozzo, Chester Zarnoch
Zaykoski, Libby Zemaitis
                                                                                            Graphic design, mapping and data visualization by Sara Eichner and the Pratt Spatial
*All authors are from the NYSDEC except those starred. Some NYSDEC authors also             Analysis and Visualization Initiative.
represent NEIWPCC or Cornell University through a cooperative program.
                                                                                            This document was prepared for the Hudson River Estuary Program, New York State
Special thanks to                                                                           Department of Environmental Conservation, with support from the New York State
John Ladd and Isabelle Stinnette as principal scientific editors; Sherri Mackey and         Environmental Protection Fund, in cooperation with the NEIWPCC.
Maude Salinger for significant editorial and photo research assistance; Chris Bowser
for many outstanding NYSDEC photographs used in this document, Peter Zaykoski for           Although the information in this document has been funded wholly or in part by
project management assistance; and Fran Dunwell and Rob Pirani as Program Managers          the United States Environmental Protection Agency under agreement to the Hudson
for the two Estuary Programs for overall project guidance.                                  River Foundation, it has not undergone the Agency’s publications review process and
                                                                                            therefore, may not necessarily reflect the views of the Agency, and no official endorse-
                                                                                            ment should be inferred.

                                                                                            Cover photo: River Waves, Brandon Pidala

                                                                                            October, 2020

                                                                                                                                                       The State of the Hudson 2020 2
EXECUTIVE SUMMARY

Contents
EXECUTIVE SUMMARY................................................................ 4
THE ESTUARY.................................................................................. 7
USER GUIDE..................................................................................... 9
ACRONYM KEY................................................................................10

WATER QUALITY........................................................................... 11         CONTAMINANTS.......................................................................... 56
       14    Dissolved Oxygen                                                                           58   PCBs
       16    Macroinvertebrates                                                                         61   Dioxins and Furans
       17    Nutrients                                                                                  62   Cadmium
       19    Salinity                                                                                   64   Contamination Along the Estuary
       20    pH (Acidity)                                                                               66   DDT
       21    Bacteria
                                                                                                    PUBLIC ACCESS.............................................................................69
HABITAT AND ECOLOGICAL HEALTH................................. 23                                       71 Public Access to Hudson River Estuary Shorelines
    25 Fish Abundance
                                                                                                        73 Access for Water-Based Activities
      25 Migratory Species
      30 Non-native and Resident Species                                                            COMMUNITY ENGAGEMENT................................................. 78
      31 Impacts From Water Withdrawals                                                                 80 Stewardship Participation
    32 Estuarine Habitats                                                                               83 Local Conservation Planning
      32 Established Oyster Beds                                                                        84 Community Science
      34 Natural and Engineered Shorelines
      37 Submerged Aquatic Vegetation                                                               CLIMATE CHANGE....................................................................... 87
      39 Floating Aquatic Vegetation                                                                    89   Resetting Natural Clocks
      40 Tidal Wetlands                                                                                 90   Sea-Level Rise
      43 Tidal Wetlands Marsh Accretion Monitoring                                                      91   Air Temperature
    45 Watershed Habitats and Ecosystems                                                                92   Water Temperature
      45 Natural Lands                                                                                  93   Precipitation
      47 Conservation of Natural Lands                                                                  95   Tackling Climate Change
      48 Biologically Significant Natural Lands in the Watershed
      49 Tributary Streams
      53 Streamside Vegetation/Riparian Areas

                                                                                                                                                                    The State of the Hudson 2020 3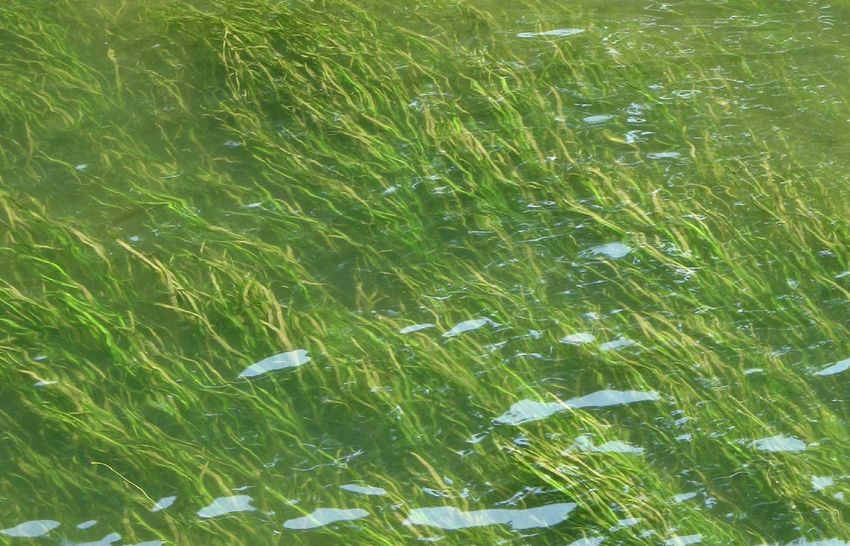
EXECUTIVE SUMMARY

Executive Summary
This State of Hudson Report presents environmental trends on the Hudson                  USEPA and the Governors of New York and New Jersey under the Clean Water Act for a
Estuary and in its watershed. By compiling recent data and historical information, it    similar purpose. These two programs now work very closely together and have joined
allows program managers, partner organizations and interested members of the public      in preparing this report.
to measure and communicate progress toward state and federal goals for conserving           Each chapter in this report compiles the best available data for a variety of indicators
and restoring the estuary ecosystem. Many laws govern the way this ecosystem is          of environmental condition. Where the information is available, the report illuminates
managed, but primarily this report has been created for use by the two programs tasked   long-term trends (>30 years) and short-term trends (>20 years). Historic environmental
with managing this resource—one federal and one state. The Hudson River Estuary          changes are also discussed to put more recent trends in the context of improvements
Program was created within the New York State Department of Environmental                resulting from the passage of the Clean Water Act, Clean Air Act, and other laws of the
Conservation (NYSDEC) in 1987 to conserve the river and its watershed. At the same       1970s and 1980s. Where there is not sufficient data to draw conclusions, the report sets
time, the federal New York-New Jersey Harbor & Estuary Program was created by            a baseline for future considerations of progress.

Photos: left: striped bass monitoring is a key
management tool for a sustainable fishery.
NYSDEC. Right: the American eel has suf-
fered habitat loss due to dams and culverts.
Collecting data allows stream restoration
projects to be prioritized. NYSDEC.

                                                                                                                                                     The State of the Hudson 2020 4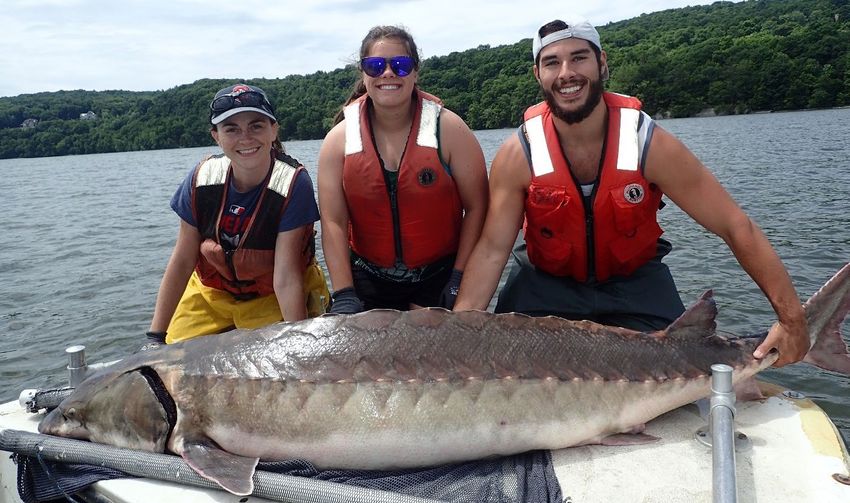
EXECUTIVE SUMMARY

Executive Summary
Findings

Water Quality in the Hudson River Estuary has                   Habitat and Ecological Health trends for fisheries,            Contaminants, such as heavy metals in sediments and
improved dramatically since 1972 and has remained               oysters, wetlands, streams and forests in the                  PCBs in fish, are decreasing in concentration from
largely stable in recent years. The historic trends for         watershed, are variable. Tidal wetlands, in particular,        highs in previous decades but remain a concern.
most water quality indicators show that conditions have         are stable after centuries of habitat loss. However, other     Though average concentrations of PCBs in striped bass
improved since passage of the 1970 Clean Air Act and the        critical natural habitats continue to be lost or damaged.      tissues have declined since the 1990s, concentrations have
1972 Clean Water Act. The clean-up of water quality in          Submerged aquatic vegetation, a keystone in-water              remained stable in recent years and EPA estimates that the
the Hudson is one of its biggest success stories. Prior to      habitat, has partially rebounded following habitat loss        advisories for consuming Hudson River fishes may need to
the Clean Water Act, portions of the Hudson were so             from recent tropical storms. Tributary streams, which          remain in place for more than 50 years. Average concen-
polluted that fish were rarely seen. Today those same           have been heavily fragmented by dams and culverts over         trations of cadmium were much lower in crabs collected
reaches of the Hudson support the growth and survival           a period of centuries, are getting new attention, with pilot   in 2004 than those collected in 1979 and will be further
of many fish and wildlife species. Cleaner water has            restoration projects underway. The decline in some fish        assessed soon. The cleanup of contaminated sediments at
made the Hudson an attractive destination for a variety         populations, such as striped bass and herring, may be          hundreds of Superfund and brownfield sites along the estu-
of shoreline and on-water recreational activities.              leveling off, while other species such as shad and sturgeon    ary has reduced many dispersed sources of pollution. Data
                                                                are still at risk. In recent years, restoration projects are   from the past 20 years indicate that dioxin concentrations
                                                                aiding the recovery of oyster populations for the              in the upper harbor, mostly originating from 1960’s con-
                                                                ecological benefits they provide.                              tamination of New Jersey waters around Newark Bay, are
                                                                                                                               now leveling after an earlier decline. DDT, a contaminant
                                                                                                                               responsible for the extirpation of many raptor species
                                                                                                                               from the Hudson, is likely no longer problematic.

Photos: left: Hudson River Park Trust, middle: Bob Rightmyer, right: NYSDEC                                                                               The State of the Hudson 2020 5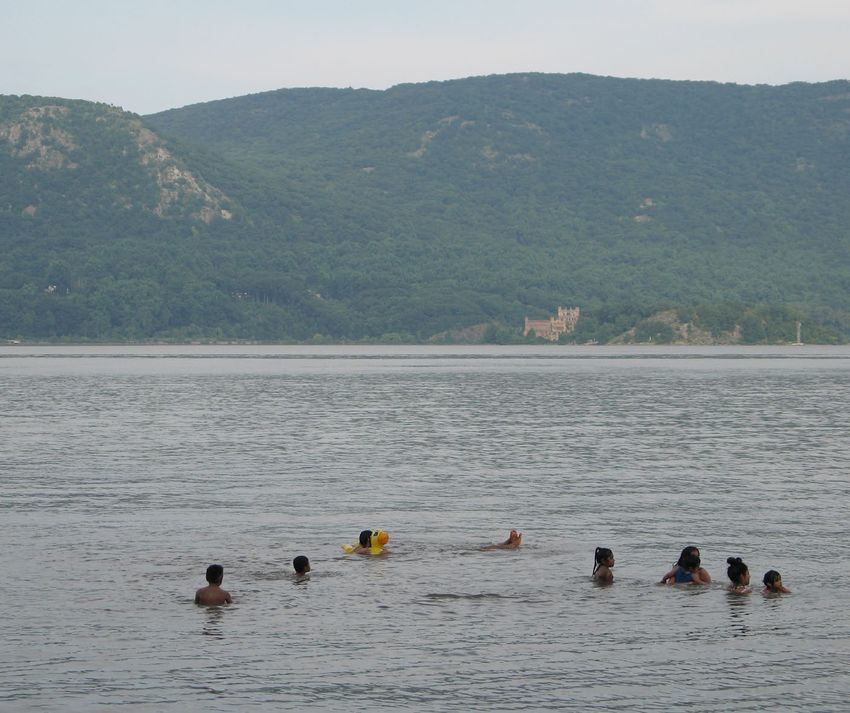
EXECUTIVE SUMMARY

Executive Summary
Findings

Public Access is a wonderful success story—the                   Community Engagement and stewardship events                Climate Change is affecting the Hudson Estuary
result of investments by local, state and federal                are growing in popularity every year. The total number     right now. Key indicators of change (temperature,
agencies and programs. As water quality has improved,            of community members participating in stewardship          precipitation, and sea level) that affect ecosystem health
the number of public parks, boat launches, trails and            events has grown dramatically since 2003, and the          are all exhibiting troubling trends. They show that the
nature preserves has increased with it. More access to           increased number of hours they commit indicates            estuary’s waters are warming, annual rainfall is increasing,
the waters of the estuary exists now than has been the           that people are deepening their engagement in envi-        and sea level is rising. Air temperatures in the region have
case for generations. About 25% of the shoreline is              ronmental stewardship. People of all ages are having a     also increased, and our warming climate has altered the
available to the public, including many new public access        positive effect on their local waterways and the estuary   timing of natural events keyed to seasonal change, such as
sites, walkways and bikeways in New York City. Access            watershed through a wide range of actions. Community       the migratory patterns of fish and birds. Intense storms
across the railroad tracks has vastly increased north of         residents contribute their local knowledge and leader-     matter a great deal. Tropical storms Irene, Lee, and
Manhattan, as has the number of Greenway Water Trail             ship to conservation planning efforts in municipalities    Hurricane Sandy left a lasting mark on the estuary
sites for canoeing and kayaking. Enhanced access is              large and small. Schools are making stewardship events     affecting habitats and sediment. DEC is using the data
allowing more people to enjoy the water and is fostering         a regular part of their curriculum. Dozens of organiza-    contained in this report to better guide and encourage
a stewardship ethic in surrounding communities.                  tions throughout the estuary are conducting community      climate change adaptation by communities.
                                                                 science programming and collecting data. Community
                                                                 engagement empowers people to have an impact on
                                                                 where they live.

Photos: left: Nancy Beard, middle: NYSDEC, right: Steve Stanne                                                                                          The State of the Hudson 2020 6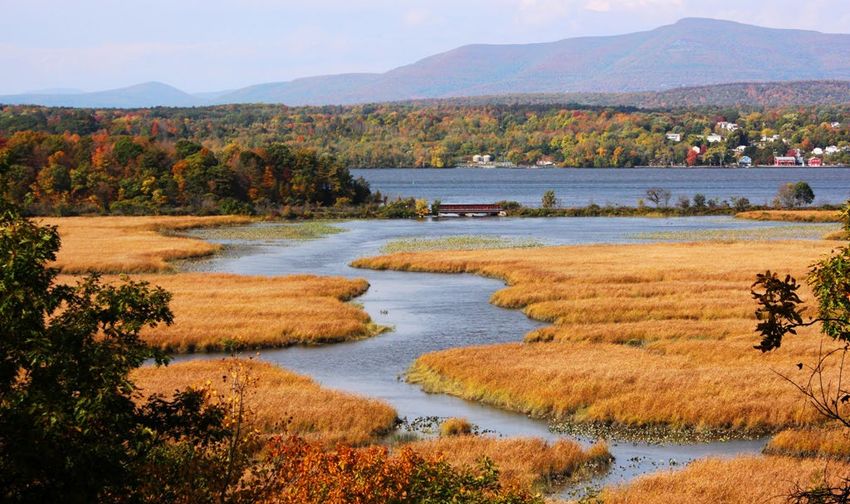
INTRODUCTION

The Estuary
About the Hudson River Estuary and the State and Federal                                    The New York State Hudson River Estuary Program
Estuary Programs                                                                            This program helps people enjoy, protect and revitalize the Hudson River Estuary and
The Hudson River Estuary extends north from New York Harbor to Troy and is influenced       its valley. It was created by state law in 1987 and extends from the head of tide at the
for this entire distance by twice-daily ocean tides. In the southern part of the estuary,   Troy dam on south to the Verrazzano Narrows, including upper New York-New Jersey
freshwater mixes with ocean water and is extremely brackish. The estuary gradually          harbor. The NYSDEC manages the program in partnership with other agencies and is
becomes a more freshwater tidal environment above the harbor, becoming generally            guided by an advisory committee of stakeholders. An Action Agenda specifies measures
freshwater from Poughkeepsie north to the head of tide at the Troy dam. The watershed       to be taken by NYSDEC and many public and private partners to conserve and restore
is the area of land from which water drains into the estuary from the non-tidal upper       the ecosystem. The 1987 law requires the program to provide periodic status reports on
Hudson, the Mohawk River and through tributary streams. The amount of freshwater            the condition and productivity of the estuary, and this State of the Hudson Report is
flowing south in the estuary is influenced by the amount of rainwater in the water-         a response to those requirements. It describes specific chemical, physical, and biologic
shed. After heavy rain storms, the zone where freshwater mixes with saltwater may be        characteristics of the estuary and its watershed and shows how they are changing with
pushed far to the south into New York-New Jersey Harbor. During droughts the mixing         time. The Estuary Program also provides assistance, grants, and scientific research to
zone may extend well north of West Point, occasionally as far as Poughkeepsie.              empower citizens, communities, and agencies to make informed choices. Its collaborative
   The estuary is a unique and highly productive ecosystem that is habitat for a wide       approach achieves real, on-the-ground progress and produces powerful regional results.
variety of fish and wildlife, including some that have provided economic benefit to
people for centuries and others that provide inspiration and ecological benefit. In
particular, the estuary enables a rich biodiversity of migratory fish—shad, striped bass,
sturgeon, and herring—that spawn in the estuary and then spend much of their life in
the ocean. Blue crab, a migratory crustacean, and resident fish such as bass and perch
are also highly valued. Bald eagles, diamondback terrapin, herons and ducks are just
some of the rich wildlife resources of the estuary. All of these species depend on the
chemical, physical, and biological characteristics of the estuary, including a complex
food web of plants and animals, as well as habitats.

Photos: Diamondback terrapin and Atlantic
sturgeon. NYSDEC

                                                                                                                                                     The State of the Hudson 2020 7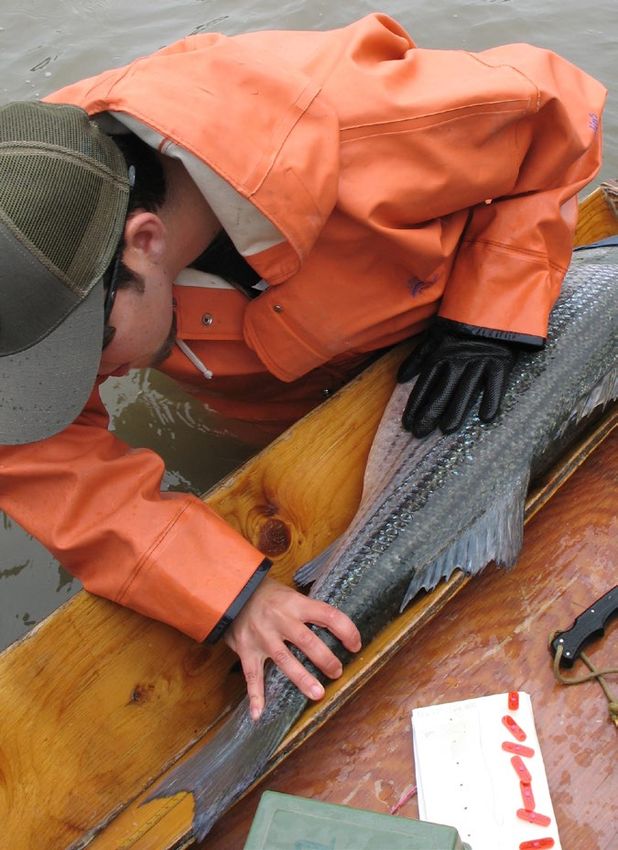
EXECUTIVE SUMMARY

The Estuary

The New York – New Jersey Harbor & Estuary Program
(NY-NJ HEP)
NY-NJ HEP helps bring together diverse stakeholders including scientists, citizens,
and policy makers to work towards the goal of fishable and swimmable waterways for
people and wildlife called for in the Clean Water Act. One of the Nation’s 28 Estuaries
of National Significance, NY-NJ HEP was created in 1988 by the U.S. Environmental
Protection Agency (EPA) at the request of the governors of New York and New Jersey.
The Hudson River Foundation manages the collaborative and provides the non-federal
match to funds received from the EPA under the Clean Water Act. Like the Hudson
River Estuary Program, NY-NJ HEP is charged with assessing trends for key indicators
of the overall health of the estuary. The data and trends illuminated in this document
expands and complements NY-NJ HEP’s 2018 State of the Estuary Report that addition-
ally includes the bi-state waters south of the Mario Cuomo Bridge. This scientific
understanding will be used by NY-NJ HEP and its partners as we implement the
current Action Agenda and identify new priorities in the future.

NEIWPCC
NEIWPCC is a regional commission that helps the states of the Northeast preserve and
advance water quality. It engages and convenes water quality professionals and other
interested parties from New England and New York to collaborate on water, wastewater,
and environmental science challenges across shared regions, ecosystems, and areas
of expertise.

                                             Map: New York State Law defines the estuary
                                             as the tidal waters within its jurisdiction from
                                             the Troy Dam to the Verrazzano Narrows and
                                             the associated shorelands. The upper Hudson
                                             and the Mohawk River are not shown on this
                                             map, nor is the portion of the estuary within
                                             the state of New Jersey.

                                                                                                      The State of the Hudson 2020 8
EXECUTIVE SUMMARY

User Guide
Organization of this Report                                                                  Trend Determination and Scaling
This report is organized around the following goals: water quality, habitat and ecological   The data were analyzed primarily by looking for statistically significant (p

ACRONYM KEY

Acronym Key
       ADA Americans with Disabilities Act                                 NYSDEC 	New York State Department of Environmental Conservation
     CPUE catch per unit of effort                                         NYSDOH New York State Department of Health
       CSC Climate Smart Communities                                       NYSDOS New York State Department of State
     CRRA Community Risk and Resiliency Act                              NYSOPRHP 	New York State Office of Parks, Recreation, & Historic Preservation
       CSO combined sewer overflow                                            PAHs polycyclic aromatic hydrocarbons
       DDT dichlor-diphenyl-trichloroethane                                   PCBs polychlorinated piphenyls
       EPA U.S. Environmental Protection Agency                               PFAS perfluoroalkyl and polyfluoroalkyl substances
        GIS Geographic Information System                                      PIPC Palisades Interstate Parks Commission
   HRECOS 	Hudson River Environmental Conditions Observing System             PPM parts per million
  HRNERR 	Hudson River National Estuarine Research Reserve                     PPT parts per trillion
      HUC hydrologic unit code                                                 PSU practical seawater units
      IPCC Intergovernmental Panel on Climate Change                         QAPP quality Assurance Project Plan
      NGO Non-Governmental Organization                                     REMAP 	Regional Environmental Monitoring and Assessment Program
  NEIWPCC 	New England Interstate Water Pollution Control Commission           SAV submerged aquatic vegetation
     NOAA 	National Oceanic and Atmospheric Administration                    SBA significant biodiversity area
NOAA NCEI 	National Centers for Environmental Information                     SBU Stream Biomonitoring Unit
     NRCC Northeast Regional Climate Center                                     SET surface elevation table
       NRI Natural Resource Inventory                                   TCDD 2,3,7,8 tetrachloro dibenzo-p-dioxin
       NYC New York City                                                        TPL Trust for Public Lands
   NYCDPR 	New York City Department of Parks and Recreation                USFWS US Fish and Wildlife Service
 NY-NJ HEP New York - New Jersey Harbor & Estuary Program                    USGS United States Geological Society
       NYS New York State                                                      YOY young-of-year fish

                                                                                                                             The State of the Hudson 2020 10
WATER QUALITY
1. Water Quality
MonitoringThe
water of the Hudson 2020 11
quality.
State
Hudson River Park TrustWATER QUALITY
Water Quality
Introduction
A number of key parameters are used to measure water quality. They provide important The water quality data used for this report address more recent trends. They were
information on the health of the fish and wildlife living in the waters of an estuary, as well gathered from several sources, including the Cary Institute of Ecosystem Studies
as the human use of the estuary for activities such as boating, swimming, and fishing. Kingston station, the Hudson River Environmental Conditions Observing System
For many years, government agencies and scientists have been measuring various (HRECOS), the Hudson River National Estuarine Research Reserve’s (HRNERR) long-
water characteristics including the parameters reported below, such as nutrients, term data stations, and data from periodic sampling conducted by the NYSDEC’s
dissolved oxygen, pH, macroinvertebrates, temperature and bacteria, in order to better Division of Water and the US Geological Survey (USGS).
understand how the ecosystem functions and to guide regulatory actions. Turbidity
is important for the river and has been monitored as well, but it is highly variable and
is not included in this report. Water temperature data can be found in the Climate
Change chapter.
Water quality data were first collected by New York City’s Metropolitan Sewerage
Commission from 1910-1914. Pollution reported from that time and confirmed
repeatedly in documents through 1979, showed that discharges of municipal sewage,
tannery and paper mill wastes, and industrial chemicals fouled the river from the
Capital District at one end of the estuary to the Hudson’s mouth at New York City
(Hudson River Survey Commission, 1938; Bruce, 1961; Boyle, 1979).
Water quality has improved immensely since then. State and federal actions during
the 1960s and 1970s made pollution control a priority. In 1965, New York State voters
passed a billion-dollar Pure Waters Bond Act to fund sewage treatment. In 1972, the
federal Clean Water Act made clean-up a national priority. In the years following,
industrial and municipal discharges gradually came into compliance with these and
other laws. However, problems remain. Maintaining good water quality will require
addressing on-going infrastructure needs. As of 2017, in the watershed of the estuary
north of New York City, about 11% of sanitary sewer pipes were installed before 1925;
approximately 26% are over 65 years old. There were also 111 combined sewer overflow
(CSO) outfalls discharging into the Hudson River and tributaries during overflow
conditions (NYSDEC databases). Communities are on track to fix the CSOs, but it
will cost millions.
Photo: Swimming in the Hudson. NYSDEC
The State of the Hudson 2020 12WATER QUALITY
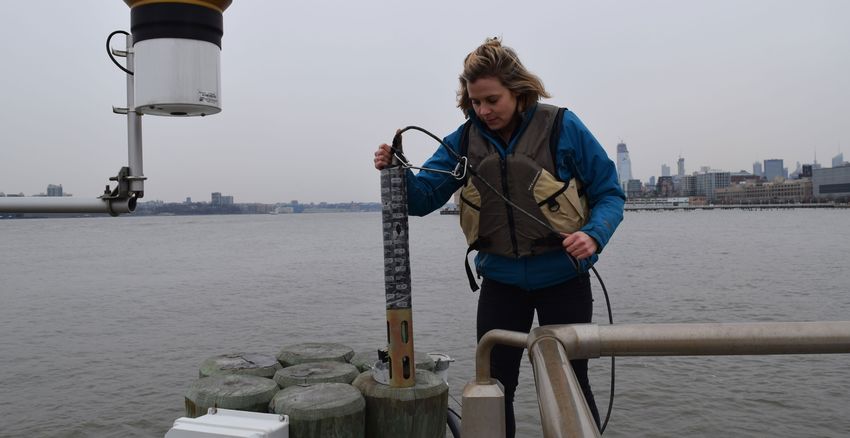
Long-Term Water Lock 8, Mohawk River
Did you know? Sampling Sites
High frequency monitoring is now wide HRNERR 1987 - present
Port of Albany
spread along the estuary. HRECOS 2008 - present
Cary Institute 1987 - present Castleton
Schodack Island
USGS 2002 - present
The Hudson River Environmental Observing System (HRECOS) is an environmental
Poughkeepsie Water
monitoring network operated and managed by a consortium of governmental, Treatment Plant Stockport Creek
Stockport Flats
academic, and private institutions with shared interest in high-frequency monitoring
Hudson
within the lower Hudson River watershed. HRECOS monitoring stations are broadly
distributed along the lower Hudson and Mohawk rivers, and are equipped with sensors
that continuously record a suite of water quality and weather conditions every 15
Tivoli North Stony Creek
minutes, with most stations operating year-round. The system started operating in Tivoli South Sawkill Creek
2008 and has added stations over time. Remote telemetry at each station transmits
Kingston
real-time data that are stored in remote databases and made easily accessible with
the HRECOS mapper application. HRECOS stations which had 5-10 years of data Indian Kill Creek
Norrie Point
collected constantly from the same sampling locations are Lock 8 (Mohawk River), USGS Station at
Poughkeepsie Poughkeepsie Water
Port of Albany, Schodack Island, Tivoli North Bay, Tivoli South Bay, Norrie Point, Marist Marist Treatment Plant
College, and Pier 84 (Manhattan). Poughkeepsie
Newburgh Beacon
West Point
Map: In addition to the HRECOS stations,
water quality is monitored by HRNERR, a Fort Montgomery
Doodletown Brook Iona Island
partnership between the National Oceanic
and Atmospheric Administration (NOAA) Haverstraw
and the NYSDEC that manages four tidal
wetland reserves along the lower Hudson.
Their long-term water quality data have Piermont
Sparkill Creek
been collected monthly at 10 different sites Piermont Marsh
within the wetlands since 1991. The Cary
Institute of Ecosystem Studies has sampled
several stations along the mainstem 1987. A
USGS station at Poughkeepsie has provided
continuous water discharge and suspended Pier 84
sediment data, along with turbidity, water
temperature, specific conductance, and stage
height monitoring since 2002. The Pough-
Photo: HRECOS display for Norrie Point, keepsie Water treatment plant has measured
see Further Reading for website. water temperature daily since 1940.
The State of the Hudson 2020 13WATER QUALITY
Dissolved Oxygen
Long-term Trend (1987-2019): Not trending
Short-term Trend (2008-2019 ): Not trending
Background Analysis
Dissolved oxygen in the water is one of the most important ways that habitat quality A long-term analysis was conducted using data from a station at Kingston maintained
is measured for fish and other aquatic organisms. Fish breathe the oxygen found in by the Cary Institute of Ecosystem Studies starting in 1987. A short-term analysis was
the water column and can be stressed by areas of low dissolved oxygen. Acute hypoxia conducted with HRECOS data (taken every 15 minutes since 2008) and HRNERR main
(very low dissolved oxygen), can result from eutrophication under certain conditions. stem station data collected monthly since 1991. HRNERR stations in tidal marshes were
Acute hypoxia can cause fish kills. Chronic hypoxia can affect predator-prey relation- not used for this analysis since wetlands naturally remove oxygen during tidal exchange
ships in the estuary (Yozzo, 2018). (Findlay and Fischer, 2013). HRECOS data were summarized to monthly median values,
Low dissolved oxygen may be caused by discharges of organic matter and nutrients which represent the middle value of the observed data and will not be skewed by a small
from sewage treatment plants as well as from algae blooms. When algae or other types subset of extreme low or high values, as would be the case with the mean (average). Annual
of organic matter decompose, they can cause biochemical reactions that reduce oxygen. cycles of oxygen levels were then compared to the EPA standard 4.8 mg/L (US EPA, 2000).
Excess nutrients in the water can cause an overgrowth of algae, known as an algae bloom,
Photo: Water celery Vallisneria americana
and this process is called eutrophication. When the algae die, bacteria consume them,
fronds can grow several feet long in large
using available oxygen. However, the Hudson Estuary is naturally turbid (cloudy) from beds, providing oxygen to the river. NYSDEC.
the presence of both sediment and plankton. This turbidity, combined with vertical
mixing, is thought to be a factor that currently suppresses algal blooms in the tidal
Hudson, thereby preventing excess growth and potential oxygen depletion. In addition,
native aquatic plants, primarily American eelgrass (Vallisneria Americana), provide a
source of oxygen to the estuary through photosynthesis (Findlay et al. 2006; also see
habitat chapter). Hypoxia is most problematic in slow-moving tributaries to the Hudson,
deeper parts of the estuary where the water is not well mixed, and in some of the largest
water chestnut beds, where this non-native aquatic plant contributes to oxygen loss (see
habitat chapter). Nutrient-laden water flowing from the Hudson into the ocean is also
a concern for oxygen conditions off-shore in New York Bight.
Historic conditions have been reported in documents that pre-date the 1972 Clean
Water Act (see suggested reading). In the summer of 1970, a consultant study on the
upper reaches of the Hudson Estuary found only a few living fish, and those were seen
“swimming slowly at the surface, gulping air, and disturbing an oil film which covered
the water surface” (Quirk et al., 1971). By 1987, however, when the Hudson River Estuary
Program was established, the benefits of clean water laws, enforcement actions and
state and federal sewer infrastructure investments were already showing results.
Improved oxygen levels and conditions for fish have persisted ever since and are
monitored by HRECOS sites and NYSDEC.
The State of the Hudson 2020 14WATER QUALITY
Dissolved Oxygen
Findings Norrie Point Dissolved Oxygen
For the period of record oxygen levels
at all main stem Hudson River stations
were above 4.8 mg/L, even in the summer
months when oxygen levels are lowest,
as shown in the example graph provided
from the Norrie Point HRECOS station.
4.8 mg/L is the EPA designated threshold
below which continuous exposure
hinders growth of marine life (US EPA,
2000). None of the mainstem Hudson
stations showed a short-term or long-
term trend that would be considered
significant.
EPA threshold
Graph: Annual cycle of oxygen levels at the
HRNERR Norrie Point station are typical
of dissolved oxygen levels at HRECOS and
HRNERR stations on the main stem of the
Hudson. Note that even in August (typically
time of minimum values) levels are well
above the threshold of 4.8 mg/L.
Data Source: HRECOS, HRNERR The State of the Hudson 2020 15WATER QUALITY
Macroinvertebrates
Did You Know?
Tiny Creatures are Excellent Indicators of Water Quality!
The NYSDEC Stream Biomonitoring Unit (SBU) was initiated in May 1972 as mandated (Ephemeroptera), stoneflies (Plecoptera) and caddisflies (Trichoptera), collectively known
by the Federal Water Pollution Control Act. The unit evaluates the relative biological as EPT richness. The EPT are considered to be mostly clean-water macroinvertebrate
health of the State’s surface waters through the collection and analysis of macroinver- organisms. Increasing diversity of EPT follows improvements to water quality (Lenat,
tebrate communities. Macroinvertebrates are larger-than-microscopic invertebrate 1987). In general, a higher EPT richness score indicates better water quality. A BAP score
animals that inhabit stream, river, lake, and wetland bottoms. Freshwater forms are of 7.5 - 10 or better is indicative of non-impacted water quality, while a score of 5.0 - 7.5
primarily aquatic insects, worms, clams, snails, and crustaceans. Macroinvertebrates indicates slightly impacted conditions, and a value below 5 indicates moderate (2.5 - 5.0)
are widely used in biomonitoring because they provide an accurate means of water or severely impacted (0 - 2.5) conditions and suggests biological impairment.
quality assessment. The SBU operates on a 5-year rotational cycle and collects Since monitoring began in 1972, sections of the Hudson have shown substantial
macroinvertebrate community data at sites of agency, regional and/or public interest, water quality improvement. The first stoneflies in the lower Hudson were recorded by
in support of clean water planning and improvement programs and for spatial and the SBU in 1997. These improvements are in stark contrast to anecdotal field records
temporal trend monitoring. from the 1970s, indicating a “gross[ly]” polluted, “slime” and “sewage” filled location,
Assessments of stream and river water quality use a four-tiered system of impact where human hair was found wrapped around the multi-plate bricks (NYSDEC, 1970).
categorization based on the macroinvertebrate community known as the Biological
Assessment Profile (BAP) score. For rivers like the Hudson, the BAP score is calculated Biological Assessment Profile (BAP) and EPT Richness
based on four metrics, but a key one is the combined species richness of mayflies
Photos: Stonefly, Caddisfly, Mayfly, larval
stage macroinvertebrates. NYSDEC.
Graph: The Capital District site on the Hud-
son at Troy has specifically shown positive
improvement since 1973 (Lenat, 1987) and
improved consistently through 2017 where
BAP scores were 9.1 (slightly or non-impact-
ed). Similarly, the Ephemeroptera, Plecop-
tera and Trichoptera (EPT) richness score
at the Troy site has improved from severely
impacted in 1973 to slightly impacted in
2017. In 2012, a slight drop in BAP scores was
most likely caused by Hurricane Irene and
disruption of macroinvertebrate communities
measured in that year.
Data Source: NYSDEC Stream Biomonitoring Unit The State of the Hudson 2020 16WATER QUALITY
Nutrients
Long-term trend nitrate (1987-2019): Improving
Long-term trend phosphorus (1987-2019): Not trending
Short-term trend, both nutrients (2000-2019): Not trending
Background Total Phosphorus (Kingston Station, NY)
Nutrients are essential for the growth of aquatic plants such as the phytoplankton and
rooted submerged aquatic vegetation that serve as important contributors to the food
webs of the Hudson River. Large amounts of nutrients, however, can contribute to several
water quality problems, most commonly, excess growth of algae in the water column, and
ultimately, loss of oxygen from bottom waters as dead algae decompose (see dissolved
oxygen). In most freshwater systems, including the upper estuary, phosphorus is
considered the nutrient of greatest concern. However, nitrogen is often the greatest
concern in marine ecosystems. Nitrogen from the Hudson is also transported to the more
saline portions of the estuary as well as off-shore marine waters, so nitrogen is important
to understand for its impact on the larger ecosystem. Phosphorus inputs to the Hudson
River come from wastewater effluent and fertilizer run-off. Nitrogen also derives from
these sources but also is supplied by snow and rainfall in the watershed.
The observed levels of nutrients in the Hudson are generally high and would
cause much higher levels of algal growth, including algae blooms, than are observed.
However, algae are currently limited in abundance by strong light limitation due to
turbidity (Cole et al., 1992). The turbidity of the Hudson combined with continual
vertical mixing means that algal cells are carried deeper than sunlight penetrates
and spend most of the daylight hours below the top 1-2 meters where light is available.
However, there is still the potential for stratification (lack of vertical mixing) under
certain weather conditions or in shallow areas, and this could allow excess algal
growth. These conditions have not been observed frequently in the mid-Hudson, but
warmer conditions in the future could make them more common. In addition, since
the mid-1990s, filtration by the non-native zebra mussel (Dreissena polymorpha) has
Graph: Total phosphorus (mg/L) measured
limited algal abundance (Strayer, 2011). Nutrients from the Hudson River are delivered during the ice-free season at a station near
to the harbor and beyond into the NY Bight, and these loads, especially nitrogen, Kingston NY. The line shown represents the
represent a significant nutrient supply to downriver and coastal waters that are likely 50th percentile (equivalent to the median),
more vulnerable to excess algal growth. to provide context of how the Hudson River
data at the Kingston station compares to other
sites in the lower Hudson River watershed.
The figure shows that the values for the Hud-
Photo: Sewage treatment plant, Newburgh, son are similar to values for other waterbod-
NY. NYSDEC. ies in the lower Hudson River watershed.
Data Source: Cary Institute of Ecosystem Studies, RIBS The State of the Hudson 2020 17WATER QUALITY
Nutrients
Analysis Nitrate Concentration (Kingston Station, NY)
Nutrient data used for this analysis are from the Cary Institute of Ecosystem Studies.
Cary scientists have collected nutrient samples over the past 25 years at a main-channel
location near Kingston, NY (sampled every two weeks during the ice-free season). The
Kingston station is considered representative of the mainstem Hudson, as there is small
variation among Cary Institute stations. Several forms of nitrogen (organic, nitrate
and ammonium) are routinely measured, but since nitrate (NO3) is the most abun-
dant bio-available form, it is used to represent nitrogen availability. For phosphorus,
Cary measures both phosphate (the most bio-available) and total phosphorus, which
includes phosphorus contained in microscopic organisms like algae (Ohrel and Register,
2006). Comparison data were also collected from the NYSDEC Rotating Integrated
Basin Studies (RIBS) dataset between 2002-2019 to create percentiles shown on the
graph. This total phosphorus and nitrate data represent a mixture of routine and random
sampling locations broadly characterizing the tributaries and mainstem of the lower
Hudson River Basin.
Findings
Concentrations of both nitrogen and phosphorus in the Hudson above the Tappan Zee
area were moderately high compared to other rivers/estuaries (Lampman et al., 1999),
with long-term mean concentrations of ~ 2.0 mg nitrate/L and 0.06 mg phosphorus/L as
total phosphorus. There was a consistent drawdown of both nitrogen and phosphorus Nitrate levels were below the NYSDEC and EPA guidance values/standards of 10 mg/L for
during the warmer growing season, most likely related to biological uptake and the protection of (Class A) drinking waters in this stretch of the Hudson River. However,
denitrification in wetlands and vegetated habitats (Tall et al. 2011; Caraco and Cole, 2002; even nitrate values of 1-2 mg/L can promote the growth of algae, including the potential
Findlay and Fischer, 2013). There were long-term fluctuations in concentrations of both for harmful algae blooms (HABs). Further impacts to aquatic life are usually associated
nitrogen and phosphorus with no consistent trend in phosphorus but an improving with these concentrations as well. However, there are many factors that influence the
trend in average nitrate concentrations. Most values for total phosphorus were between suppression of algal growth and related impacts in the Hudson Estuary.
the eutrophic range of 0.03 - 0.1 mg/L, which is capable of supporting high algal biomass.
However, in the tidal Hudson River algal growth is limited by water turbidity and Graph: Long-term mean concentrations are ~
0.4 mg nitrogen/L as nitrate, well below the 10 lower bound of the highest 10% of values
vertical mixing. Total phosphorus at the Kingston station is similar to the average RIBS
mg/L drinking water standard for this stretch observed at other sites in the lower Hudson
results from the greater watershed, while nitrate is much higher than average. Thus, the of river, but high enough to cause concern for River watershed. Therefore, nitrate values
concentrations at the Kingston station may be reflecting the combined load of nitrate ecological impacts. The line shown represents in the Hudson are clearly higher than the
from all the tributaries to the main stem of the Hudson. the 90th percentile, which represents the majority of other waterbodies in the region.
Data Source: Cary Institute of Ecosystem Studies, RIBS The State of the Hudson 2020 18WATER QUALITY
Salinity
The Hudson River from NY Harbor to Troy is an estuary where saltwater from the ocean Changes in salinity can be the result of movement of the salt front due to weather
meets and mixes with freshwater from the watershed. The very southern end in NY and tides. Localized changes not associated with the movement of the salt front may
Harbor can be almost completely ocean water with high salinity (> 30 PSU; practical reflect human activity, including road salting, wastewater overflow, and agricultural
salinity units) especially during times of low freshwater run-off. However, most of the runoff. Seasonal inputs of rain or snow that freshen the water tend to push salinity
estuary is much less saline. The estuary between NY Harbor and Newburgh is brackish, south in the estuary. Drought tends to allow water with higher salinity to move north
and during low flow, brackish conditions are detectable as far north as Poughkeepsie. in the estuary. Most aquatic organisms have limited tolerance to wide or rapidly
The edge of this saline environment, which moves up or downstream depending on the changing ranges of salt content. The impacts of climate change on sea level, rainfall
amount of freshwater flows, is called the salt front. Above Poughkeepsie and north to and snowmelt may affect the position of the salt front. Understanding the impacts of
Troy, the Hudson Estuary is a freshwater tidal environment. climate change on salinity will have important implications for people and ecosystems.
Salinity: annual averages from mainstem, marsh and tributaries determined from HRECOS and HRNERR observations, 1991-2017
Graph: HRECOS data taken every 15 minutes
since 2008 and HRNERR data (shown here;
taken monthly from 1991) suggest small
changes in salinity which are unlikely to
cause ecosystem disruption. The freshwater
tributaries have become slightly more saline
with time as indicated by the slightly darker
shades of blue starting in 2000 (note Stock-
port Creek and Stony Creek in particular).
The consistent darker shades of blue at Iona
Island and Piermont Marsh are indicative of
the more saline waters in the southern por-
tion of the estuary. Salinity will continue
to be monitored to detect changes that
might be anticipated due to climate change.
Blank cells indicate no data was collected for
those years.
Data Source: HRNERR Monitoring Program The State of the Hudson 2020 19WATER QUALITY
pH (Acidity)
Historic Trend: see text below
Long-term Trend (1987-2019): Improving
Short-term Trend (2000-2019): Improving
Background Findings
Acidity (pH) is represented by a measure of the concentration of hydrogen ions (H+). Records collected show an improving trend (more basic) since 1987. Values remained
The pH spectrum is generally depicted as ranging from 0-14, where a pH of 7 is in the 6.5 - 8.5 range considered healthy for an estuary. This upward trend may be a
considered neutral, pH values below 7 become increasingly more acidic, and values response to recovery from acidification as has been seen in many smaller steams and
above 7 become increasingly more basic. In freshwater rivers and estuaries, the surface waters in New York State in response to the Clean Air Act decreasing sulfur and
expected range of pH is between 6.5 and 8.5. Most aquatic organisms are only tolerant oxidized nitrogen deposition (Sullivan et. al, 2018).
of a specific pH range. Rapid increases or decreases in pH could alter the composition
of the organisms found in a given ecosystem. Globally, most water bodies became Acidity at Kingston, NY, 1987-2019
increasingly acidic from the 1970s until early this century (Sullivan et al., 2018). In
almost all freshwaters the major changes in pH have been due to acidic deposition
from power plant emissions and cars (acid rain). In New York State, dramatic declines
in pH were reported from streams and lakes in the Adirondack region due to acid rain.
With the Clean Air Act amendments of 1990, deposition of hydrogen and other ions
has decreased dramatically in New York State and elsewhere, including the Adirondack
lakes and streams, and pH has increased, representing a clear success of environmental
regulation targeted at sources of acid rain. Because the Clean Air Act does not regulate
CO2, however, ocean waters are becoming more acidic, as high CO2 levels in the
atmosphere from burning fossil fuels upset the pH balance. Though this impact could
extend to estuaries, fortunately, the Hudson River Estuary is considered to be fairly
well-buffered due to limestone geology in parts of the watershed. Changes in pH are
therefore less dramatic in the Hudson Estuary than sensitive lakes and streams.
Analysis
Data for pH were provided by the Cary Institute from their monitoring at Kingston
which has tracked pH during the ice-free season using an Accumet pH meter in the
laboratory on air sealed samples. Trends were determined by using a linear regression
with time. HRECOS stations will be a good source of pH data once the data record is
long enough to determine a trend.
Graph: pH values in the mainstem at Kingston
have been increasing which may be related to
recovery from acidification in the watershed.
Data Source: Cary Institute of Ecosystem Studies The State of the Hudson 2020 20WATER QUALITY
Bacteria
Did you Know? Success Story
Bacteria connected to swimming-related Improving Water Quality in the Major Metro Areas
illnesses have declined in the harbor area. Improvements to water quality are the result of specific actions on the part of local,
When people swim or kayak in rivers and estuaries like the Hudson, they may come in State and federal government actions. The North River sewage treatment plant on
contact with bacteria or other harmful organisms that can cause disease and sickness. the Hudson in New York City came online in 1986 and by 1991 was treating 170 million
Bacteria enter our waterways via sewage and stormwater outfalls flowing into the gallons per day to levels of secondary treatment, a major victory for water quality in the
estuary, especially in urban areas. In less populated parts of the estuary, animal waste lower estuary. In recent decades, because of such actions, conditions have significantly
can be a source of bacteria, as well as failing septic tanks and illegal sewage hookups improved for fish and other river creatures. (New York City Department of Environ-
to storm sewers. mental Protection, Harbor Survey Program). However, combined sewer overflows
Fecal coliform bacteria are commonly used as an indicator to measure levels of (CSOs) have been a persistent problem for water quality on the Hudson, especially in
pathogenic (disease-producing) organisms from fecal contamination in freshwaters. the most urbanized areas of the metro New York region and the Capitol District. When
Fecal coliform information is typically used as an indicator in waterbodies that are it rains, combined sewer systems, which collect both storm water and wastewater,
deemed suitable for primary contact like swimming as well as secondary contact, cause sewage treatment plants to exceed their capacity and overflow.
including on-water recreational activities like kayaking or rowing. Enterococcus are In 2012, NYSDEC and New York City signed an agreement to develop 10 waterbody-
another type of indicator bacteria and are used by New York State in some of the specific, long-term control plans, plus a city-wide plan for CSOs. This agreement should
marine waters of the estuary. reduce CSO discharges into New York City waters by approximately 8.4 billion gallons
The state and local health departments test for fecal coliform and enterococcus annually. In 2008, NYSDEC partnered with the Capital District Regional Planning
regularly at designated swimming beaches. Monitoring for bacteria has been conducted Commission to address more than 100 CSOs in Albany and the surrounding area.
regularly in the waters surrounding New York City since 1985 through the city Department Updated permits now require municipalities in this area to achieve improved water
of Environmental Protection’s Harbor Survey. It shows a significant long-term decrease quality. The plan, announced early in 2014, is expected take 15 years to implement
in bacteria harbor wide. There have been no significant trends since 2007 but seasonal and cost $136 million.
averages were largely below the EPA criteria for offshore sampling stations (Stinnette
et al., 2018). There are limited long-term data available for bacteria that would allow
assessment of trends in the Hudson River north of Yonkers at this time.
Water temperature:
At Poughkeepsie, the river’s annual average water temperature increased by more
than 2ºF between 1940 and 2011 (Seekell and Pace, 2011). See Climate Chapter.
Photo: Swimming near the George
Washington Bridge, New York-New Jersey
Harbor. Angus McIntyre, Riverkeeper
The State of the Hudson 2020 21WATER QUALITY
References
Boyle, R., 1979, The Hudson: A Natural and NYSDEC. 1970. Unpublished field notes. Wetzel, R.G. 1975. Limnology, Philadelphia: W.B. Suszkowski, D. and C.F D’Elia, 2006, The
Unnatural History, New York: Norton Saunders Co., 743p. History and Science of Managing the Hudson
Ohrel, R.L., and K.M. Register, 2006. Volunteer
River, in Levinton, J.S. and J.R. Waldman (eds),
Bruce, Willard A., 1961, Capital District Area Estuary Monitoring A Methods Manual. Yozzo, D. 2018. Review of Climate Change
The Hudson River Estuary, New York:,Cam-
Special Study, NYS Department of Health, Second Edition. Effects on Water Quality and Estuarine Biota
bridge University Press, pp 313-334.
July/August/September 1961 of the NY-NJ Harbor & Estuary. Final report,
Quirk, L., 1971. Environmental effects of Bowline
September, 2018. Levinton, J.S. and J.R. Waldman, 2006. The
Caraco, N. F., and J. J. Cole. 2002. Contrasting generating station on Hudson River. Quirk,
Hudson River Estuary, New York: Cambridge
impacts of a native and alien macrophyte on Lawler & Matusky Engineers.
dissolved oxygen in a large river. Ecological Further Reading University Press
Seekell, D.A. and Pace, M.L. 2011. Climate Boyle, R., 1979, The Hudson: A Natural and
Applications 12:1496–1509. USEPA. 2012. Recreational Water Quality
change drives warming in the Hudson River Unnatural History, New York: Norton Criteria, EPA Office of Water Pub 820-F-12-
Cole et al. 1992. Can phytoplankton maintain a Estuary, New York (USA). Journal of Environ-
Dunwell, F., 2008, The Hudson: America’s River, 058. www.epa.gov/sites/production/
positive carbon balance in a turbid, freshwa- mental Monitoring 13:2321-2327.
New York, Columbia University Press files/2015-10/documents/rwqc2012.pdf
ter, tidal estuary?, Limnology and
Stinnette, I. Taylor, M., Kerr, L., Pirani, R.,
Oceanography. 37 (8):1608-1617 EcoCheck. 2011. Sampling and data analysis
Lipuma, S., Lodge, J. 2018. State of the Estuary.
Findlay, S. E. G., W. C. Nieder, and D. T. Fischer. Hudson River Foundation. New York, NY. protocols for Mid-Atlantic tidal tributary
2006. Multi-scale controls on water quality indicators. Wicks EC, Andreychek ML, Kelsey
Sullivan, T. J., Driscoll, C.T., Beier, C.M., RH, Powell SL (eds). IAN Press, Cambridge,
effects of submerged aquatic vegetation in
Burtraw, D., Fernandez, I.J., Galloway, J.N., Gay, Maryland, USA.
the tidal freshwater Hudson River. Ecosys-
D.A., Goodale, C.L., Likens, G.E., Lovett, G.M.,
tems. 9:84-96. Hudson River Environmental Conditions
Watmouhj, S.A. 2018. Air pollution success
Findlay, S., D. Fischer. 2013. Ecosystem stories in the United States: The value of Observing System (HRECOS). See HRECOS.
attributes related to tidal wetland effects on long-term observations. Environmental org; Dashboard at www.hudsonriver.org/
water quality. Ecology 94:117-125. Science and Policy. https://doi.org/10.1016/j. state-of-the-estuary#current-conditions,
envsci.2018.02.016 mapping application: https://ny.water.usgs.
Hudson River Survey Commission, NYS gov/maps/hrecos/
Division of State Planning, 1938. Basic data Strayer, D., 2011, The Hudson River Primer: The
map of the Hudson River Valley map no.9, Ecology of an Iconic River, Berkeley: Kelly, V. R., Findlay, S. E., Hamilton, S. K.,
Industrial Wastes. University of California Press Lovett, G. M., & Weathers, K. C. 2019.
Seasonal and long-term dynamics in stream
Lampman, G. G., Caraco, N. F., & Cole, J. J. 1999. Tall, L., N. Caraco, and R. Maranger. 2011. water sodium chloride concentrations and
Spatial and temporal patterns of nutrient Denitrification hot spots: dominant role of the effectiveness of road salt best manage-
concentration and export in the tidal Hudson invasive macrophyte Trapa natans in ment practices. Water, Air, & Soil
River. Estuaries, 22(2), 285-296. removing nitrogen from a tidal river. Pollution, 230(1), 13. https://doi.org/10.1007/
Ecological Applications, v 21, p 3104-3114. s11270-018-4060-2
Lenat, D. R. 1987. Water quality assessment
using a new qualitative collection method for USEPA. 2000. Ambient Aquatic Life Water Stanne, S.P., R.G. Panetta, B.E. Forist, 1996. The
freshwater benthic macroinvertebrates. Quality Criteria for Dissolved Oxygen Hudson: An Illustrated Guide to the Living River,
North Carolina DEM Tech. Report. 12 pp (Saltwater): Cape Cod to Cape Hatteras. EPA New Brunswick: Rutgers University Press.
822-R-00-012.
The State of the Hudson 2020 22HABITAT & ECOLOGICAL HEALTH
2.
Habitat and Ecological Health
A bald eagle feeds an eel to its chick from a nest
on the shores
TheofState
the Hudson. 2020 23
Bob Rightmyer.
of the HudsonHABITAT & ECOLOGICAL HEALTH
Habitat and Ecological Health
Introduction
Habitat is the environment in which plants and animals live. The habitat of the Hudson Fortunately, there have been many positive developments in the last 40 years
River Estuary and its watershed can be described in terms of the distribution of the since the passage of the Clean Water Act. Thousands of acres of Hudson River
plants and animals including people that live in the watershed. In a 2013 habitat habitats have been protected and enhanced. Dramatic improvements in water
restoration plan the NYS Department of Environmental Conservation (NYSDEC) quality in the estuary have benefited a host of aquatic and terrestrial species. Both
described the unique habitats and ecological health of the estuary as follows: tidal and freshwater wetlands protection laws and regulations have substantially
reduced direct losses of Hudson River habitats. Several important habitat
The tidal Hudson River is home to a host of fish, from hogchokers to eels, river
complexes have been acquired by New York State, municipalities and conservation
herring and stripers and the river’s resident giant, Atlantic sturgeon. The Hudson’s
organizations and are now managed for public access and habitat protection.
waters and wetlands feed magnificent raptors, including bald eagles and osprey,
Additionally, some highly contaminated sites have been remediated.
and graceful waders, such as the great blue heron and snowy egret. River habitats
—Miller, 2013
support animals on the move: noisy clouds of blackbirds that settle in Hudson
River marshes in the fall, and glass eels—tiny see-through swimmers—that arrive This chapter describes some of the key indicators that are representative of the overall
in spring from the Sargasso Sea. A complex web sustains all life in the Hudson health of the estuary ecosystem. It addresses fish abundance, oyster beds, shoreline
River estuary. The Hudson’s ecosystem is linked to its vast watershed through habitats, tidal wetlands, and submerged aquatic vegetation. It also addresses the condition
tributary streams, adjoining uplands at the shoreline and the Atlantic Ocean of natural areas in the watershed and tributary streams that flow to the estuary.
through currents and tides that reach far inland, all the way to Troy. The center-
piece of this ecosystem is the estuary’s mosaic of diverse habitats.
Despite recent improvements to the Hudson River and its generally healthy
condition, there is a profound need for habitat restoration. The river is vastly
different from what it was like when Europeans first settled the valley. The estuary’s
habitats and ecological processes were disrupted by human activities, especially
between 1800 and 1972. Shorelines and wetlands have been altered, relocated and
eliminated along the 152-mile length of the estuary. Between Catskill and Troy, the
river’s flow has been directed to a single channel and over a third of the river’s
historic surface area has been filled with sediments dredged from the federal
navigation channel. Hundreds of dams have been built in tributaries leading to the
Hudson, many preventing migratory fish movement and degrading water quality.
Water and sediments have been contaminated with toxins, and invasive plant and
animal species have established and spread throughout the estuary. As a result of
these and other factors, many populations of native fishes and wildlife have
declined, and several have been listed as threatened or endangered.
Photo: Tivoli North Bay. NYSDEC
The State of the Hudson 2020 24HABITAT & ECOLOGICAL HEALTH
Fish Abundance
Migratory Species Historic trend: See text below
Long term trend (1983-2018): Declining
Short term trend (2000-2018): Not trending
The analysis for this indicator focuses largely on migratory ocean fishes that use the Background
estuary ecosystem for spawning and as nurseries during important parts of their life Historical accounts of the estuary from precolonial times through World War II describe
cycle. These species are the foundation of historic commercial and sport fisheries for our waters as teeming with fish. Native Americans thrived along the estuary, utilizing
the Hudson, and sufficient data are available to track trends in abundance over time. fish as an important food source. Robust fish populations supported a booming
To a lesser degree, freshwater resident species, invasive species, and ecological commercial fishing industry during the late 1800s through the 1950s. Today, fish
relationships are discussed. populations are a fraction of what they once were and only a few commercial fisheries
currently exist. Fish populations can be influenced by habitat modifications such as
dramatically altered shorelines, extensive wetland loss, a proliferation of dams on
tributaries, as well as water quality and impacts related to climate change. However,
fish populations are also affected by factors beyond habitat quality, such as directed
fishing and by-catch, disease, species invasions, and shifts in predator-prey distribu-
tion. Historic overfishing in the river and on the coast, as well as contaminants such a
PCBs have been major contributors to the closure of commercial fisheries within the
Hudson River. The presence of power plants and other facilities that withdraw river
water for cooling have also had an enormous impact on fish populations.
Illustrations: left: American shad, NYSDEC;
middle: Atlantic sturgeon, Kraft et al, Inland
Fishes of New York, 2006; right: striped bass,
NYSDEC.
The State of the Hudson 2020 25You can also read