TRYING TO ERASE THE RED LINE: National Lessons from a New York Homeowner Policy - The ...
←
→
Page content transcription
If your browser does not render page correctly, please read the page content below
TRYING TO ERASE THE
          RED LINE:
          National Lessons from
          a New York
          Homeowner Policy

REPORT BY NAOMI ZEWDE, RAZ EDWARDS,
AND ERINN BACCHUS
FEBRUARY 2022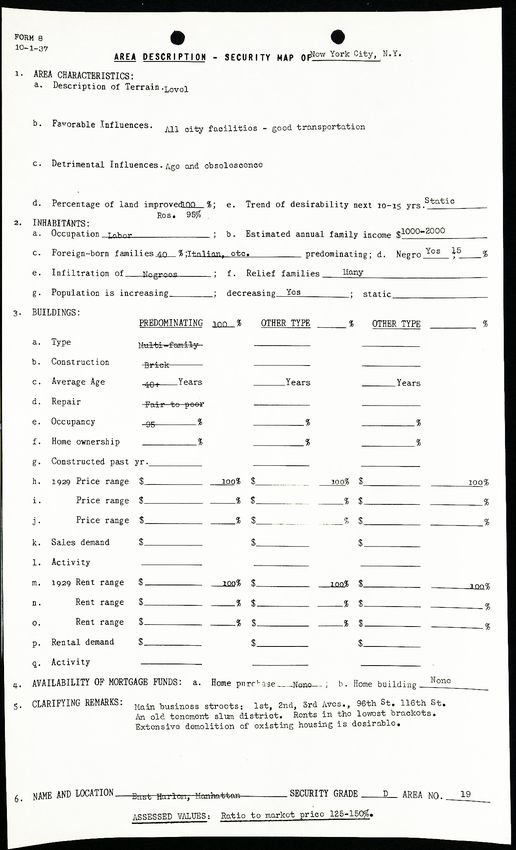
ABOUT THE ROOSEVELT INSTITUTE

The Roosevelt Institute is a think tank, a student network, and
the nonprofit partner to the Franklin D. Roosevelt Presidential
Library and Museum that, together, are learning from the past
and working to redefine the future of the American economy.
Focusing on corporate and public power, labor and wages, and
the economics of race and gender inequality, the Roosevelt
Institute unifies experts, invests in young leaders, and
advances progressive policies that bring the legacy of Franklin
and Eleanor into the 21st century.
ABOUT THE AUTHORS                                                 ACKNOWLEDGMENTS
Naomi Zewde is a fellow at the Roosevelt Institute and an         The authors would like to thank Sophia House and Susan
assistant professor in health policy at the Graduate School of    Saegert for their comments on the manuscript and Ellen
Public Health and Health Policy of the City University of New     Gould, Alanna McCargo, and Kilolo Kijakazi for their
York. She holds a PhD in health policy, with a concentration      feedback on the study design. Redlining maps of New
in economics, from Penn State University and an MPH and BA        York City overlaid with HDFC co-op units were produced
from Emory University. Zewde is a faculty affiliate and was       by Timothy Gilman, MS candidate at Northeastern
formerly a post-doctoral research scientist with the Center on    University, and Vicky Bu at the City University of New
Poverty and Social Policy at the Columbia University School       York mined real estate data for the project. Alexander
of Social Work. Zewde’s research focuses on public policy         Roesch and Samantha Kattan at UHAB, Cea Weaver at
solutions to issues in inequality in wealth and in health. She    Housing Justice for All, and Dean M. Roberts, Esq. were
has worked closely with advocates and legislators at the local,   interviewed for the project. Roosevelt Institute staff
state, and federal levels on the policies she studies. Her work   Suzanne Kahn and Sonya Gurwitt; and Beryl Frishtick
has been published in Health Affairs, the Journal of Risk and     also contributed to this project.
Insurance, and the American Journal of Public Health, and has
also appeared in the New York Times, Ms. Magazine, and on
PBS Newshour.

Raz Edwards is a health policy research consultant with
over 10 years of research experience in academic, government,
and nonprofit settings. They are currently contracted with the
City University of New York Graduate School of Public Health
and Health Policy and the University of Arkansas for Medical
Sciences Fay W. Boozman College of Public Health. They hold
an MA in psychology from Wesleyan University and an MPH
in health policy and management from the City University
of New York. Edwards’ research broadly explores barriers to
accessing health care among underrepresented populations,
including sex workers, religious minorities, incarcerated
individuals, and trans and queer communities.

Erinn Bacchus is a third-year doctoral student and social
epidemiologist at the City University of New York Graduate
School of Public Health and Health Policy, where she serves
as the inaugural Haviland Fellow pursuing research in
migrant health. Bacchus holds an MPH in epidemiology from
Columbia University’s Mailman School of Public Health. She
currently works with Dr. Nicholas Freudenberg at Healthy
CUNY evaluating programs and policies to promote health
within CUNY and across NYC communities. She also serves as
a contributing writer at Brown Girl Magazine, a multimedia
company dedicated to South Asian self-expression, cultural
anchoring, and dialogue. She is broadly interested in
generating and analyzing policies that address racial
disparities in health. Her current research investigates
policies affecting those incarcerated in NYC jails, student
access to health insurance, and the effects of COVID-19 on
CUNY students. Prior to pursuing her PhD, Bacchus worked in
breast cancer research at Memorial Sloan Kettering Cancer
Center and did radiology research at Columbia University
Medical Center.
EXECUTIVE SUMMARY
Federal housing policy in the 20th century catalyzed the racial wealth gap,
establishing the net worth chasm that still exists today between middle-class white
families and their Black counterparts. Even though explicit racism was removed from
federal policies in the 1960s, contemporary mortgage markets still exclude more than
half of Black American households from homeownership. The importance of home
equity in building household wealth and the oppressive legacy of racial exclusion
necessitates the creation of anti-racist policies designed to build lasting equity for
Black and brown families.

For most Americans, especially lower- and middle-income Americans, the lion’s share
of household wealth is held in home equity. Among households below the median,
approximately 70 percent of net worth is held in home equity.1 As this report will
discuss, the federal government expanded the population for whom home equity could
serve as an avenue for wealth building by encouraging the design of home mortgage
terms built around the means of middle-income families and by promising to back
banks that expanded into this frontier. The National Housing Act of 1934 created
the Federal Housing Administration (FHA) and instituted the 20- to 30-year home
mortgages we see today. The legislation was hugely successful—resulting in lasting
wealth for future generations of American families. This policy formed a pillar of the
New Deal, the collection of Depression-era economic relief and recovery policies enacted
by President Franklin D. Roosevelt.

Despite the immense success of federally insured mortgages among families who
were able to make use of them, the FHA’s mortgage underwriting practices of the
1930s and 1940s were explicitly racially exclusionary. As a result, the practices’ legacy
of generational wealth is highly racialized. As of 2019, 72 percent of white American
households owned their homes, while only 45 percent of Black American households
did. The median white family has approximately 10 times the wealth of the median
Black family—much of it held in housing.

The original instrument of racial exclusion in federal housing policy was called
redlining. During the New Deal–era of the 1930s and 1940s, this process of racial
exclusion was highly formalized: Federal housing authorities used four colors to
delineate a neighborhood’s desirability as a function of residents’ race (see Figures 1

1
    Authors’ calculations based on the 2019 Survey of Consumer Finances.

CR E AT I V E CO M M O N S CO P Y R I GHT 20 22        |   R O O S E VE LTINS TITUTE . O R G   1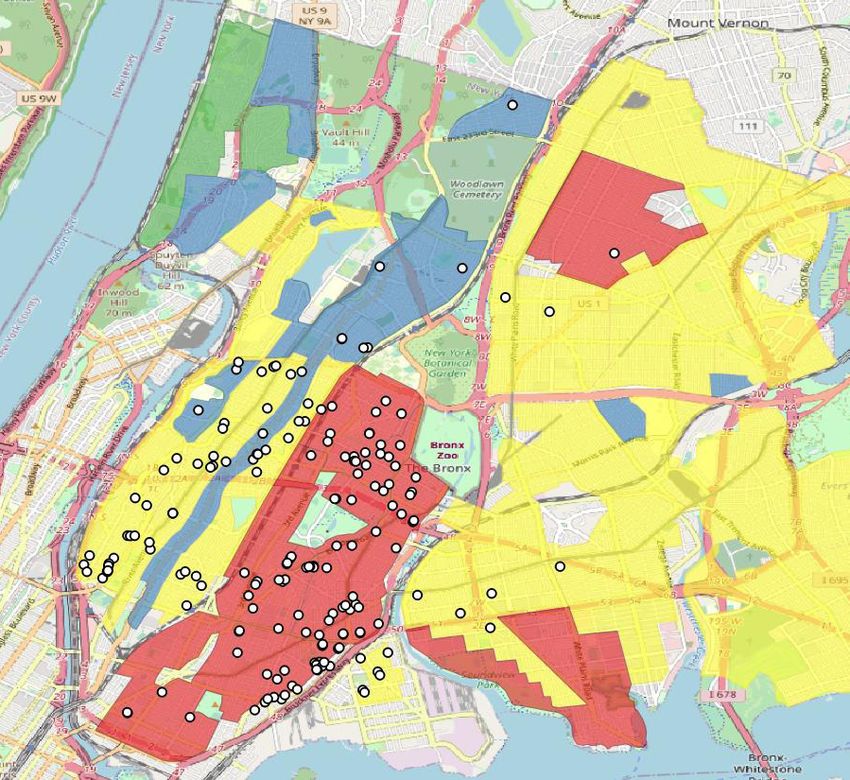
and 2). Neighborhoods that were majority non-white or were in the process of racial
integration would be circled on the map in red, denoting a “hazardous” area, or in
yellow to designate the area as “definitely declining” (Nelson et al. n.d.). The practice
was seemingly crude and banal, due to its imprecise measures and highly bureaucratic
process, but was nonetheless effective in maintaining residential segregation.

The Fair Housing Act of 1968 marked the official end of redlining, but real estate
segregation lived on. Exclusionary lending practices became less conspicuous but
remained persistent, as did the racism and profit motives underlying real estate
segregation. After the end of redlining, and in the midst of the Great Migration of
Black Americans, urban centers nationwide lost wealthy residents who fled to racially
homogenous suburban developments, home equity intact (Boustan 2010). These urban
centers fell into disrepair, leaving the abandoned buildings in the custody of cities
with already overextended budgets and leaving remaining inhabitants with the safety
hazards of neglected buildings.

This report connects the dots from that era to today. It explores a limited-income
homeownership policy in New York City that grew out of the aftermath of redlining,
and draws lessons for the contemporary design of intentional anti-racist housing
policy that can redress past harm.

Like many urban centers in the 1970s, New York City had its share of abandoned
buildings, which were concentrated in segregated, formerly redlined districts from
which the middle class had fled. One way New York dealt with its abandoned buildings
was through a policy that allowed the remaining tenants to form limited-equity
co-operatives called Housing Development Fund Corporations (HDFCs). HDFCs operate
under the purview of a local nonprofit, then transition to the joint ownership of the
tenants. Under the policy, low- and middle-income households could buy one of the
co-operatively owned apartments at a low cost, and if they eventually decided to sell,
would do so at restricted prices to other low-income buyers. The goal was to create
affordable housing in perpetuity while also building home equity for the tenants of the
abandoned buildings.

Today, however, HDFCs’ combination of equity restrictions, income rules, and limited
mortgage options prevent the program from achieving its intended purpose of true
affordability. We estimate that buyers must set aside $93,000 as a down payment, but
cannot earn more than $95,520 in income annually to purchase the median-priced

CR E AT I V E CO M M O N S CO P Y R I GHT 20 22   |   R O O S E VE LTINS TITUTE . O R G     2
home under this policy. We also find that the impacts of these financing terms are
racially disparate. More than three-quarters of income-eligible Black households will
not have the wealth for such a down payment, according to our estimate, compared
with about 4 in 10 white households. This asset-centric design negates the purpose of
HDFCs—to help historically disadvantaged families build home equity—though the
policy itself is ostensibly colorblind. Indeed, one local real estate law expert with whom
we spoke referred to the program as the “trust fund baby housing act” (D. M. Roberts,
personal communication, December 10, 2020).

What’s more, the income- and price-restricted structure of the policy limits the equity
that co-op owners can retain for themselves and their families or that they can access
for repairs. Over time, as residents have lacked the capital to keep up with maintenance
investments, thousands of apartment units have been seized by the city and sold to
third parties to pay off taxes and to pay down debts for repair and maintenance, once
again failing to build housing wealth for the formerly redlined co-op owners.

This report highlights key lessons for anti-racist home financing policies moving
forward. First, programs to expand homeownership cannot expect purchasers to bring
large quantities of financial assets to the table, an approach that effectively excludes
Black participation. The New Deal–era FHA that expanded homeownership to lower-
income white Americans targeted down payment levels of as little as 5 percent of the
buyer’s annual income (Taylor 2019, 33–34), a figure far more attainable than the 97
percent of annual income mandated in today’s New York City co-op policy.

Second, an intentional policy design should consider the limitations of low-
and middle-income households to finance home repairs and improvements.
Historically, white working-class families were more likely to move into homes
in new developments, so once a home needed repairs, its owners had had time to
build up equity. Today, many new homeowners will purchase existing homes with
maintenance needs, such as repairs to boiler rooms, pipes, and building facades. In
urban centers in particular, the housing stock tends to be older and in need of more
intensive investment. Financing schemes for both the initial purchase and for physical
improvements should be well-tailored to family budgets and designed to deliver equity
for formerly excluded homeowners.

Finally, the housing stock in most American cities requires sustainability
improvements to slow and adapt to climate change. Intentional policies must take
this reality into account. This will mean a range of subsidies and other publicly funded
strategies to meet the problems at scale. At every level of government, from federal

CR E AT I V E CO M M O N S CO P Y R I GHT 20 22   |   R O O S E VE LTINS TITUTE . O R G      3
funding to municipal implementation, these policies can function reparatively,
ensuring that adequate financial and technical support are invested in the well-being
of Black, Latinx, and other historically segregated persons and communities (Hendricks
et al. 2021). These investments can actively help to build lasting household wealth
when they are designed intentionally to do so. We can achieve our public policy goals
of affordable housing and an updated, climate-ready housing stock without penalizing
the equity of the formerly redlined.

The following section discusses the ways in which wealth and homeownership are
important for household financial stability and how federal agencies in the 20th
century established a pathway to home equity for white middle- and low-income
families—but not Black families. Next, we describe the goal and the design of the New
York City co-op policy, and its overlap with the legacy of New Deal–era redlining. We
present evidence mined from real estate listings showing the income restrictions and
required down payments for co-op purchases, relative to a typical family’s budget. We
find that the New York City co-op policy is racially exclusionary due to the demands it
places on buyers to have modest income and substantial assets. Finally, we conclude
with lessons for building anti-racist policy, including designing parameters (like
down payment assistance) around the capacity of low-income and Black residents and
designing municipal actions that funnel federal dollars and infrastructure support to
historically excluded communities.

CR E AT I V E CO M M O N S CO P Y R I GHT 20 22   |   R O O S E VE LTINS TITUTE . O R G   4
BACKGROUND
Wealth is a key driver of a family’s financial stability. For most American families,
homeownership is the primary route to building wealth. Unlike the income used to
meet immediate needs, wealth enables households to plan for and invest in major life
decisions, like moving to a new city, continuing higher education, or starting a business
(Braga et al. 2017). As wages have stagnated over the past few decades, wealth has played
a growing role in shaping households’ financial stability (Emmons and Ricketts 2015).

Homeownership can be a practical tool for building wealth, especially among lower-
and middle-income households that lack the ability to set aside savings with each
paycheck. Housing already constitutes a major component of most household budgets,
at one-third of households’ total spending on average. Retaining that expenditure
through purchasing housing rather than renting can be a practical way to accumulate
savings. By contrast, the next largest components of household budgets are food
and transportation, and cannot be retained as savings as readily (Bureau of Labor
Statistics 2020).

In addition to allowing for the retention of savings, home values tend to appreciate
over the long term as real incomes rise and total land availability remains fixed.
This holds true on average in both larger and smaller cities, and among Black and
white homeowners. While Black homeowners often receive smaller rates of equity
appreciation on average relative to their white counterparts, they nevertheless have
net positive returns (Bogin, Doerner, and Larson 2019; Fesselmeyer, Le, and Seah 2013;
Herbert, McCue, and Sanchez-Moyano 2013).

This trend of long-run appreciation contains short-term volatility in prices that poses
risks to households who may want to liquidate their asset at a given point in time.
Still, evidence suggests these risks are not prohibitive to realizing equity gains for
most house-holders (Goodman and Mayer 2018). For example, Wainer and Zabel (2020)
find that low-income households that purchased a home in a stable market realized
substantial increases to net worth, while those that bought just prior to the housing
crash realized no net change in wealth over a 10-year period. Given that 2008 to 2012
were the only years since 1940 in which home prices depreciated on average (Federal
Housing Finance Agency n.d.), purchasing a home offers a reasonable level of risk and
an appropriate entry point for households looking to gain equity and accrue assets over
time while circumventing the cost of rent (Herbert, McCue, and Sanchez-Moyano 2013).

In addition to the wealth returns associated with homeownership, a longstanding body
of economics literature examines the non-financial benefits gained both privately

CR E AT I V E CO M M O N S CO P Y R I GHT 20 22   |   R O O S E VE LTINS TITUTE . O R G     5
by the homeowner as well as by the neighborhood and community in which the
household is located. Rental leases are typically defined over one year or occasionally
over two or more years, while homeownership has no associated time limit. Longer
tenure in one home, which is facilitated by homeownership, is tied to favorable
educational and social outcomes for children (Hanushek, Kain, and Rivkin 2004; Green
and White 1997; Aaronson 2000). Children of low-income homeowners in urban centers
have shown longer-term economic gains into adulthood than their peers in families
that rent (Harkness and Newman 2002).

Beyond benefits to individual households, homeownership incentivizes the formation
of stronger ties and more community investment. Homeowners are more likely to vote
(Harding, Miceli, and Sirmans 2000; DiPasquale and Glaeser 1999), and urban low-
income homeowners show greater awareness of local politics, increased participation
in community activities, and more informally bonded networks (Brisson and Usher
2007; Roskruge et al. 2013). These households report a greater sense of control and trust
in their neighbors, and fewer adverse mental health outcomes than matched renters
(Manturuk 2012).2 They have a greater incentive to invest in home maintenance and
beautification, which evidence suggests translates into higher home prices. Owner-
occupied dwellings and neighborhoods with more owner residents appreciate in value
more quickly (Coulson and Li 2013) than otherwise similar rented units.3

Because of the importance of housing for household well-being, the large proportion
of a household’s budget it often accounts for, and the positive spillover effects of
homeownership for society, all levels of government have been deeply involved in
financing housing. Most prominently, during recovery from the Great Depression, the
federal government created the Federal Housing Administration. During the 1930s
and 1940s, this agency shored up a new kind of mortgage contract in which debt could
be gradually and incrementally paid off over decades (a process called amortization),
supplanting the volatile 5- to 10-year interest-only mortgages of the pre-FHA era. The
FHA-instituted practice of amortization has continued to be the standard even into
today’s housing market (Federal Housing Administration 1940, 8; Rose and Snowden
2013). Additionally, under the FHA, the federal government could protect lenders
against the risk that borrowers might default on their long-term amortized mortgages
by insuring the loans.

2
    Importantly, the mental health relationship only held true for low-income homeowners with no mortgage delinquencies.
    Those with delinquencies had mental health concerns at a frequency not distinguishable from renters. This highlights the
    importance of making sure the financing is “done right” to protect the benefits of homeownership.
3
    The literature expends considerable effort disentangling causal effects from selection effects—are homeowners
    better off in ways unobserved by the researcher that are actually causing these outcomes? Yet the theory and several
    instrumental variables analyses support the links. See Coulson and Li (2013) and Green and White (1997) for further detail.

CR E AT I V E CO M M O N S CO P Y R I GHT 20 22           |   R O O S E VE LTINS TITUTE . O R G                                   6
As Keeanga-Yamahtta Taylor (2019) describes in her authoritative book Race for Profit, the FHA of the 1930s and 1940s challenged lenders to make homeownership possible for low-income families. An FHA leader contended that offering “reasonable terms” for home buying was a “direct responsibility of business and government,” (Taylor 2019, 33) and the federal government would be ready to assist by insuring those mortgages. In turn, lenders designed reasonable terms based on their knowledge of consumers’ expenditures. If families with annual incomes below $2,000 were buying cars and refrigerators, they should be able to buy homes, too. Lenders boasted about being able to offer terms with only $100 down and monthly mortgages equal to 15 percent of the buyer’s income over the mortgage life. The bulk of the federally insured mortgages did, in fact, have reasonable enough terms. In 1945, about a quarter of all FHA-insured homes were sold to households making between $2,000 and $2,500 annually, with another 6 percent going to families earning under $2,000 (Federal Housing Administration 1946, 85). This represents the 35th percentile of (non-farm) household income for that year (US Census Bureau 1948a, 8). On average, households in that income bracket put 10 percent down on a home worth twice their income, for a down payment of 20 percent of their annual income, and they paid about 16 percent of their income on the monthly mortgage payment (Federal Housing Administration 1946, 24–25). Today, using data from the 2019 Survey of Consumer Finances, that percentile of income would correspond to a family making approximately $42,000. Following the same lending terms, such a family would put $8,400 down and pay $560 a month, including taxes, to own their home. However, though well-designed to bring low-income Americans into homeownership, these terms were implemented in a long nadir of US race relations and were explicitly exclusionary. The United States as a whole—not just the officially segregated South— excluded Black Americans and other non-white Americans from much of public life. The federally structured and federally backed mortgage program of the 1930s and 1940s was no different (Hannah-Jones 2020). Racism and racial segregation were explicitly and intentionally constructed through such strategies as reducing the score of a loan application if the home was in a neighborhood with racial heterogeneity, as well as entirely excluding redlined neighborhoods with substantial non-white populations (Taylor 2019). To the architects of these "residential security” maps and the lenders that relied on them, a few non-white people living in a neighborhood was an issue, but many in one area was insurmountable. Any new non-white residents would thus jeopardize a neighborhood’s standing with banks. Racial integration risked barring future buyers from accessing federally insured mortgages for home purchases in the CR E AT I V E CO M M O N S CO P Y R I GHT 20 22 | R O O S E VE LTINS TITUTE . O R G 7
neighborhood, making it difficult to sell property there and potentially forcing down
home prices. As a result, due to federal policy, home values depended on maintaining
racial segregation.

Moreover, segregation was profitable. Suburban developers could sell whiteness at pure
profit, whereas an extra bathroom would cost time and materials to build (Taylor 2019).
Conversely, residents redlined into segregated, poor communities were—and continue
to be—a captive audience for tenant exploitation (Desmond and Wilmers 2019). In
these communities, landlords were (and still are) able to rent sub-par housing in poor
condition at high prices with little threat of competition.

For those households eligible to participate (that is, white households), the new,
liberalized loan amortization program of the New Deal was hugely successful. By 1960,
over 60 percent of Americans were homeowners, up from about 44 percent in 1940
(DQYDJ n.d.). FHA-insured mortgages are largely credited with building out the (white)
middle class (Hannah-Jones 2020). But only 2 percent of these loans were given to non-
white families (Hannah-Jones 2020), despite at least 40 percent of non-white households
having incomes as high as $2,000 in 1945 (US Census Bureau 1948b).

While these discriminatory lending practices were solidified 80 years ago, their
racialized legacy continues today. White American families have housing wealth that
acts as a source of intergenerational support, while Black families reside in a stock
of housing in which no program has invested at scale, the vestige of the exploitative
segregated market that morphed from de jure redlining into a period of “predatory
inclusion” that failed to open access to New Deal–era terms (Taylor 2019). Black
households are still far less likely than white households to own the homes in which
they live (42.1 percent versus 73.3 percent respectively in 2019 [US Census Bureau n.d.]).

      While these discriminatory lending practices were
      solidified 80 years ago, their racialized legacy
      continues today.

There are many policy solutions that could be implemented today to redress this
legacy of discrimination and inequality. Such policies could be modeled after the
successful government programs of the 20th century, but carefully devoid of either
de jure or de facto racism. Based on this legacy, anti-racist home financing could be
designed to include reasonable terms that would fit within the typical Black family’s
budget, for example requiring low down payments given the disproportionate lack
of wealth resulting from the previous federal policy, and with sustainable monthly

CR E AT I V E CO M M O N S CO P Y R I GHT 20 22   |   R O O S E VE LTINS TITUTE . O R G      8
mortgage costs. Furthermore, given the deterioration and age of historically segregated neighborhoods, a comprehensive plan for financing would include resources for families to make capital improvements while building their home equity. This way, the appreciation of housing assets would enable new homeowners to benefit from their purchase. In the next section, we look at a policy in New York City that primarily operates in previously redlined neighborhoods. We will see the ways in which its current financing structure, which relies on high down payments, and its insufficient planning for quality improvement may act to recreate racial gaps in housing wealth. CASE STUDY: NEW YORK CITY New York City’s Housing Development Fund Corporation (HDFC) policy grew out of the aftermath of redlining. Urban centers nationwide suffered during the post-redlining 1970s era as the tax base fled neighborhoods where integration was occurring, leaving abandoned buildings in their wake. In a 1978 study conducted by the US Comptroller General, 113 of 149 cities that responded to the survey reported having an abandonment problem (Reiss 1996; Comptroller General 1978). New York City lost 114,000 residential units between 1965 and 1968, in the early days of the crisis. The city and its advisors carefully assessed the range of landlord incentives at its disposal, primarily various levels of tax abatement and low-interest municipal loans, and concluded that the asset values of buildings, measured in rents received, needed to increase (Rydell 1970; Clapp 1976). In 1970, the city enacted a law to sunset its policy of rent control. However, the move was largely unsuccessful in preventing abandonment and outmigration: New York City lost 800,000 residents over the following decade (Chall 1983). Although it was the well-off who were fleeing, and fleeing from the most desirable neighborhoods, residents of the poorest and most stigmatized areas suffered most from abandonment—a phenomenon that occurred in urban areas throughout the United States over this period. When the wealthy fled, those for whom the most desirable neighborhoods had previously been just out of reach swooped into the now cheaper apartments in these more desirable locations. Those in the next highest economic rung filled their spots in turn, and this continued until the process filtered all the way down to the least desirable neighborhoods (Reiss 1996), which, in the US real estate market, meant the poorest and most racially segregated (Taylor 2019). CR E AT I V E CO M M O N S CO P Y R I GHT 20 22 | R O O S E VE LTINS TITUTE . O R G 9
Though many fled these neighborhoods, inevitably some lacked the resources to
leave and got stuck with the hot potato of abandonment. Once landlords were unable
to fill a building, it was often financially advantageous to recoup as much of the
initial investment as possible by continuing to collect rent without investing in any
maintenance or paying any taxes until the building was foreclosed. One or more
abandoned buildings on a block could reduce the value of other nearby properties,
ultimately pulling down entire neighborhoods as investments gradually appeared to
be “financially hopeless” (Rydell 1970). Ultimately, the city foreclosed on over 100,000
abandoned apartments by 1979, making it the largest landlord in the New York market
(Furman Center for Real Estate and Urban Policy 2006).
Beginning in the late 1970s, tenants in these abandoned
buildings organized a social movement that, through
protest and negotiation, allowed them to gain control
over their buildings at affordable rates
But here is where New York City diverged from other urban centers of the era. Beginning
in the late 1970s, tenants in these abandoned buildings organized a social movement
that, through protest and negotiation, allowed them to gain control over their
buildings at affordable rates (Starecheski 2019). Though initially wary of prohibitive
prices, and understandably skeptical of future real estate values, tenants organized and
lobbied to ensure affordable terms when rental buildings converted to co-operative
ownership (Holtzman 2017). What emerged was Article XI of New York State’s Private
Housing Finance Law. Under the law, the city sold derelict apartments to residents for
$250 each—well below the New York City average for the decade, which was $65,000
(Miller 2012).4 The buildings, collectively owned and operated by residents, were
termed Housing Development Fund Corporation (HDFC) co-operatives, a nod to the
former tenants’ new roles as joint shareholders. The co-ops were concentrated in non-
white areas deemed in the New Deal–era to have been “declining” or “hazardous” (see
Figures 1 and 2, below), which were those most vulnerable to abandonment.
4
At this time NYC apartments were being sold for $45 per square foot and in 1991, the average size of NYC apartments
was about 1,400 square feet and trending downwards (Miller 2016).
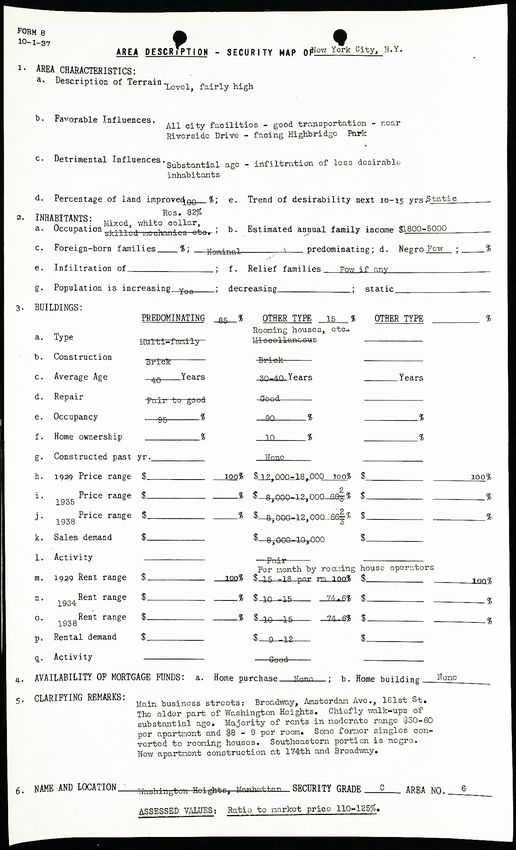
CR E AT I V E CO M M O N S CO P Y R I GHT 20 22 | R O O S E VE LTINS TITUTE . O R G 10Figure 1 : Examples of Federal Housing Administration Forms Describing “Declining” and “Hazardous” Areas “Declining” (Yellow) “Hazardous” (Red) Note: Documents developed by the federal government’s Home Owners’ Loan Corporation (HOLC) describing demographic characteristics of two neighborhoods in northern Manhattan. Based on these characteristics, most notably the racial composition of the population, neighborhoods were assigned security grades and outlined in corresponding colors on HOLC’s “Residential Security Maps.” Provided by the University of Richmond Mapping Inequality project (Nelson et al. n.d.). (Highlighted boxes added to show the neighborhood influences and inhabitant characteristics leading to the final determination of Security Grade.) CR E AT I V E CO M M O N S CO P Y R I GHT 20 22 | R O O S E VE LTINS TITUTE . O R G 11
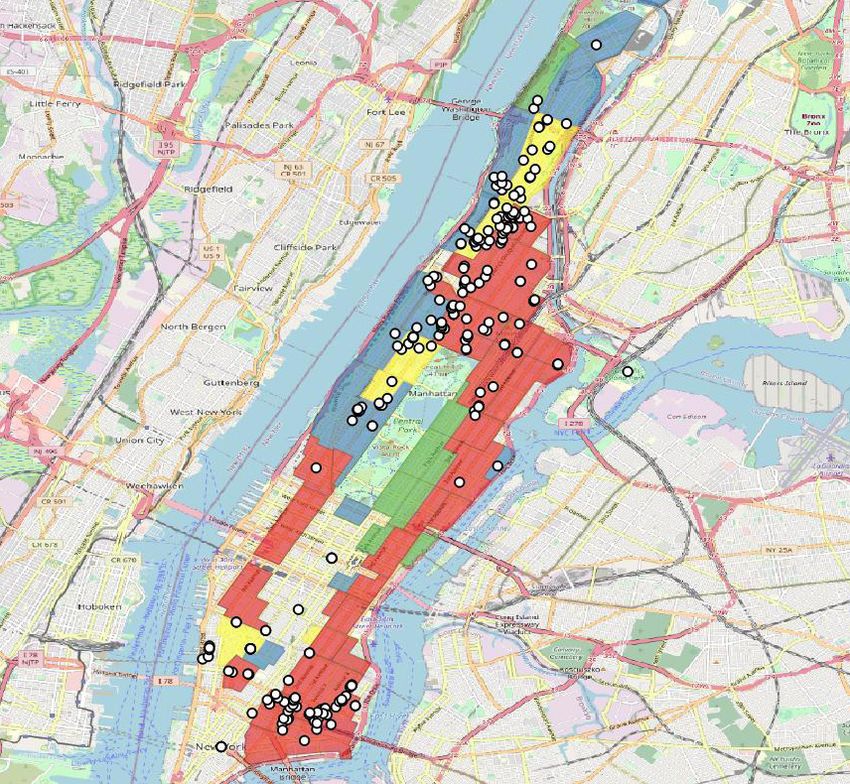
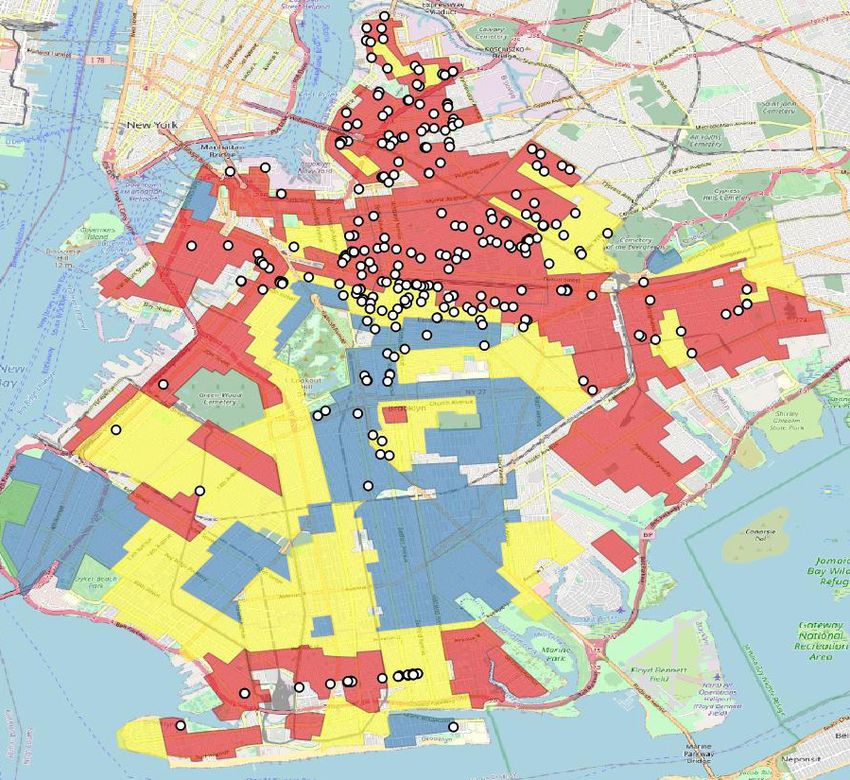
Figure 2 : Federal Housing Administration Districts and Housing
Development Fund Corporation Co-op Locations

Bronx                                                        Brooklyn

Manhattan

                                                             Key
                                                               HDFC co-op unit locations
                                                               “Best” zone
                                                               “Still Desirable” zone
                                                               “Definitely Declining” zone
                                                               “Hazardous” zone

Note: These maps show the overlap of the FHA’s neighborhood grading system for three New York City boroughs
with HDFC locations. As depicted, HDFC units were largely concentrated in the yellow (“definitely declining”) and red
(“hazardous”) zones. Maps were created by Timothy Gilman using data on HDFC addresses from ACRIS and Home Owners’
Loan Corporation neighborhood grades from the University of Richmond Mapping Inequality project (Nelson et al. n.d.).

CR E AT I V E CO M M O N S CO P Y R I GHT 20 22      |   R O O S E VE LTINS TITUTE . O R G                              12
For the first several years of cooperative ownership, residents would gain access to
incentives similar to those designed to entice private landlords, like tax abatement
and municipal loans, at the comptroller’s discretion (Private Housing Finance Law
2021). The law establishing HDFCs also established a fund that would advance money
to residents for immediate repairs when they assumed ownership. That fund was to be
replenished by co-op residents over time and thus made available for future HDFCs
(Private Housing Finance Law 2021). When residents initially sought ownership, they
entered into a collective agreement with the city over the specific terms for repaying
up-front building investment costs, usually through some combination of installment
payments and dedicating a share of any profits realized upon resale, though each
individual building’s agreement varied. When agreement terms ended, residents
would either continue operating the building or, in the event that they had failed to
pay off investment costs in full, would enter into a new agreement to restructure
remaining debts.
While the incentives resembled municipal tactics developed for private landlords,
HDFCs were established as affordable housing, rather than as asset-building tools.
At the time of purchase, all future co-op purchasers would be subject to income
restrictions. Buyers could make no more than 165 percent of the Area Median Income
($131,340 in 2020 [New York City Department of Housing Preservation and Development
n.d.]), though buildings could choose to go lower. The income limit was not heavily
restrictive, given that more than half of households in the area would always be
eligible under a cutoff that exceeds 100 percent of the area median. However, the resale
restriction would apply to the building in perpetuity. These same resale restrictions,
along with the majority of other HDFC regulations, currently remain in effect.
Low- and mid-income buyers are asked to pay
tens of thousands or even hundreds of thousands
of dollars in cash in order to own a supposedly
“affordable” HDFC co-op.
Critically, the HDFC plan set no limit on buyers’ assets nor on the down payments
required for purchase, which left a gaping hole in the pathway to affordable
homeownership. While monthly mortgage costs must be affordable relative to income—
no more than 30 percent of monthly earnings—sellers can easily meet this restriction
and then ask for a large down payment. Some even ask for full cash up front. In
other words, low- and mid-income buyers are asked to pay tens of thousands or even
hundreds of thousands of dollars in cash in order to own a supposedly “affordable”
HDFC co-op.
CR E AT I V E CO M M O N S CO P Y R I GHT 20 22 | R O O S E VE LTINS TITUTE . O R G 13Even among the majority of co-op sales that ask for only the standard 20 percent down
payment, buyers have limited access to financing and cannot use federal first-time
homebuyer grants toward the purchase. Though most co-ops allow for the buyer to
obtain external financing for the purchase of an HDFC apartment, mainstream banks
are unfamiliar with the byzantine municipal and state rules outlined in Article XI, and
are wary of the limited equity imposed by resale restrictions and capital repayment
agreements. Additionally, co-operative apartment buildings, where residents own
shares in a building as a whole and lease their individual apartment unit, are not
eligible for federal home loans or the down payment assistance these loans offer
(unlike condominiums, where each resident owns their apartment outright, which are
eligible). This leaves income-limited buyers to finance mortgages without assistance
on the down payment and with only a small pool of specialty banks potentially able
to help—or they must find the cash themselves. By requiring a limited income but a
substantial down payment, the HDFC policy effectively privileges intergenerational
wealth. The absence of asset restrictions further enables this selectivity. One real estate
expert we spoke with summed up the Article XI policy as the “trust fund baby housing
act” (Roberts, Esq. 2020).
Below, we look at how this policy works in practice by scraping the HDFC homes for sale
from the housing site StreetEasy. We ask: Are the homes affordable? Are they affordable
for Black families? And how might a different design be more empowering?
METHODOLOGY
Data
We collected the data on home prices and income restrictions from the website
StreetEasy, a subsidiary of Zillow that lists homes for sale and for rent in New York City.
To identify the income-limited co-operative units, we filtered for co-ops with the
word “HDFC” or “income” anywhere in the unit description. We mined the search
results for the listing’s URL, the listing address, asking price, and textual description of
the listing, including the sales pitch and any advertised financing terms. Our search
returned a total of 217 active listings, spanning three New York City boroughs:
155 from Manhattan, 41 from Brooklyn, and 21 from the Bronx. We excluded listings
with incomplete information on the income threshold for eligibility, which left a total
of 164 listings (118 in Manhattan, 34 in Brooklyn, and 12 in the Bronx).
CR E AT I V E CO M M O N S CO P Y R I GHT 20 22 | R O O S E VE LTINS TITUTE . O R G 14Price Verification Before running analyses, we verified our sample against public records of home sales. These records report the address and sale price of each unit sold in New York City. However, because they do not report on the income restrictions or down payment terms, we removed these listings prior to conducting the final empirical analyses, as described below. The sale records were retrieved from the New York City Automated City Register Information System (ACRIS), which lists property records. We then matched ACRIS records, using their addresses, to a list of known HDFC co-op buildings compiled by the Department of Housing Preservation and Development and provided to us by the nonprofit Urban Homesteading Assistance Board (UHAB). We subset the ACRIS home- sale data to include only those matching the HDFC list of addresses. Finally, we compared the public and scraped datasets, and found that our scraped data represented only a subset of those that are publicly available. We gathered approximately half of the overall listings—roughly half in Manhattan and Brooklyn,but only 12 of 104 total listings in the Bronx. We then performed a simple t-test to assess whether the prices of our scraped listings were representative of the larger public records sample. We were unable to find a statistically significant difference in mean price between the public and scraped samples for all boroughs combined and for Manhattan (see Table 1). However, we did find significant differences in Brooklyn and in the Bronx, despite having smaller sample sizes in these two boroughs. Below, we show density plots of the price distribution by data source for each borough (see Figure 3). Means overlap in the overall and Manhattan plots. In Brooklyn, the public data distribution shows a node at a lower price—approximately $175,000—that does not appear in the scraped data. In the Bronx, the public data mean falls between $25,0000 and $50,0000 less than the scraped mean As a result, we used only the data from Manhattan for the study. A majority of listings were from Manhattan, both in our scraped sample and in the public records. Additionally, our data appear sufficiently representative within that borough. The listings in Manhattan have higher prices on average than do the listings in the other boroughs. Nevertheless, the phenomenon we describe in this study, wherein the income-restricted listings require high levels of cash contributions relative to income, does not appear to be confined to Manhattan. HDFC listings in each borough can require substantial assets at purchase. For example, the final panel of Table 1 shows that approximately 5 percent of scraped listings in Manhattan mentioned that the seller either requires or prefers a full cash purchase; the same is true for 9 percent of CR E AT I V E CO M M O N S CO P Y R I GHT 20 22 | R O O S E VE LTINS TITUTE . O R G 15
listings in Brooklyn and 50 percent in the Bronx. These listings thus require low-income
households to put down tens or even hundreds of thousands of dollars or more
to purchase one of these units. Because we used only samples from Manhattan, we
do not conclude that listings in other boroughs are definitively more likely to require
a cash deal. However, the evidence also does not suggest that the practice is more
likely in Manhattan.

               TABLE 1. STATISTICS OF SAMPLES FROM PUBLIC RECORDS
                               AND SCRAPED LISTINGS

                                                           Public               Scraped                Difference
                                                             (1)                   (2)                   (1) - (2)

                           All Boroughs                     448                   217                     231

                           Manhattan                        278                   118                     160
       Sample Size
                           Brooklyn                          66                    34                      32
                           The Bronx                        104                    12                      92

                           All Boroughs                   $387.944              $435,781                -$47,837

                             Std Dev                   (1,037,389)              (189,469)               p = 0.558

                           Manhattan                      $526,055              $486,869                $39,186
      Mean Price,
 Standard Deviation, and     Std Dev                   (1,292,652)              (180,932)               p = 0.743
       P-Value of
    Mean Differences       Brooklyn                       $302,948              $371,456                -$68,508

                             Std Dev                      (169,020)             (97,719)                p = 0.032

                           The Bronx                      $72,700               $115,667                -$42,966

                             Std Dev                      (46,842)              (50,300)                p = 0.003

                           All Boroughs                       -                   9.1%                      -

  Percentage of Listings   Manhattan                          -                   5.1%                      -
  That Prefer or Require
    All-Cash Purchase      Brooklyn                           -                   8.8%                      -

                           The Bronx                          -                  50.0%                      -

Note: This table compares sample sizes and mean prices in public records and listings scraped from a home sales website.
Public records were retrieved from ACRIS and are a subset of addresses matching a known list of HDFC income-restricted
co-operative buildings. The scraped data were mined from StreetEasy.

CR E AT I V E CO M M O N S CO P Y R I GHT 20 22       |     R O O S E VE LTINS TITUTE . O R G                              16
Figure 3. Visual Comparison of Public and Scraped Data
All Boroughs Manhattan
2.500e-06
2.500e-06
Public Public
Scraped Scraped
2.000e-06
2.000e-06
1.500e-06
1.500e-06
Density
Density
1.000e-06
1.000e-06
5.000e-07
5.000e-07
0
0
0 5,000,000 1.00e+07 1.50e+07 2.00e+07 0 5,000,000 1.00e+07 1.50e+07 2.00e+07
Price Price
Kernel = epanechnikov, bandwidth = 6.8e+04 Kernel = epanechnikov, bandwidth = 6.5e+04
Brooklyn The Bronx
4.000e-06
8.000e-06
Public Public
Scraped Scraped
3.000e-06
6.000e-06
2.000e-06
4.000e-06
Density
Density
1.000e-06
2.000e-06
0
0
0 200,000 400,000 600,000 800,000 0 50,000 100,000 150,000 200,000 250,000
Price Price
Kernel = epanechnikov, bandwidth = 6.3e+04 Kernel = epanechnikov, bandwidth = 1.6e+04
CR E AT I V E CO M M O N S CO P Y R I GHT 20 22 | R O O S E VE LTINS TITUTE . O R G 17Income Restrictions
Using our sample of 118 scraped Manhattan listings, we manually identified and then
standardized the income restrictions from within the text descriptions. While the city
requires some income limit be set, and imposes a cap at 165 percent of the Area Median
Income (AMI), each building can set a lower limit. First, we searched for the terms
“income” and “AMI” in the listing description, then manually checked each listing URL
to verify. We standardized each listing to show the income restrictions as a percent of
AMI. For example, if a listing imposed an income limit of $79,600 for a single adult or
$131,340 for two, we converted both to 100 percent AMI in our data.
TABLE 2. AREA MEDIAN INCOME IN NEW YORK CITY, 2020
Family Size 100% AMI 120% AMI 165% AMI
1 79,600 95,520 131,340
2 91,000 109,200 150,150
3 102,400 122,880 168,960
4 113,700 136,440 187,605
5 122,800 147,360 202,620
6 131,900 158,280 217,635
7 141,000 169,200 232,650
8 150,100 180,120 247,665
Note: Data are from the New York Department of Housing Preservation and Development.
https://www1.nyc.gov/site/hpd/services-and-information/area-median-income.page
CR E AT I V E CO M M O N S CO P Y R I GHT 20 22 | R O O S E VE LTINS TITUTE . O R G 18Down Payments
We similarly identified listing-specific down payment requirements from the
description text. However, most listings (77 percent) did not specify a required down
payment. We assumed a down payment of 20 percent and validated the assumption
in two ways. First, we asked several experts on NYC real estate, and on this co-op policy
in particular, and scoured available reports. Each expert suggested a 20 percent down
payment would be standard. Next, we compared our assumption to the actual down
payments required in those listings that specify an amount and found that the
20 percent assumption was closest to the listed down payment. When we assumed a
20 percent down payment, we found a $0 difference at the median between that
assumed amount and the actual down payment where noted. We found a mean
difference of -$14,707, which suggests that our assumption was approximately $15,000
lower than the listed down payment at the mean. By comparison, the 25 percent
assumption appears too high with a median difference of +$29,250 and a mean
difference of +$9,071, and the 15 percent assumption appears too low, with a median
difference of -$17,500 and a mean difference of -$38,486. Given some form of error with
any assumption, we selected 20 percent, which aligned with expert advice, had a $0
median difference, and appears to slightly understate the mean difference and thus
will not overstate the down payment required.
TABLE 3. DIFFERENCE BETWEEN ASSUMED AND REPORTED
DOWN PAYMENT
25 Percent 20 Percent 15 Percent
Median Difference +29,250 0 -17,500
Mean Difference +9,071 -14,707 -38,486
Note: This table shows differences between the down payment noted in the listing, available for only 27 of the 118
Manhattan listings, and the down payment assumed in this study (20 percent of asking price) as well as other alternative
down payment assumptions we could have made (25 percent or 15 percent). The difference is reported as assumed minus
noted, and is thus a positive number when the assumption is larger than the noted amount on average.
CR E AT I V E CO M M O N S CO P Y R I GHT 20 22 | R O O S E VE LTINS TITUTE . O R G 19FINANCING THE PURCHASE: HOW BLACK FAMILIES
ARE LARGELY EXCLUDED FROM BUYING INTO THE
NEW YORK CITY POLICY
Among the homes for sale in Manhattan through this income-limited New York City
policy, the median price was $465,000, shown below in Table 4. This amount is somewhat
higher than the median home price in the United States for 2020 ($333,975) (US Census
Bureau and US Department of Housing and Urban Development 2021), but much lower
than the median for Manhattan ($999,000 in 2018 [Vasquez 2019]).
In order to be eligible to purchase one of these “affordable” homes, a buyer cannot
make more than the income limit. These vary somewhat, as co-op boards are allowed
to set lower income limits. Few go below 120 percent of the area median, or $95,520 for
a single adult, which is the median income requirement and the 25th percentile. Other
co-ops exceed that amount, up to $131,340 at the 75th percentile, which represents the
maximum allotment of 165 percent of Area Median Income. These amounts translate
to between $136,440 and $187,605 of income allowed for families with four persons. In
effect, the co-ops function as middle-income, rather than low-income, housing.
TABLE 4. DISTRIBUTION OF ASKING PRICE, REQUIRED DOWN PAYMENT,
AND INCOME THRESHOLD FOR INCOME-CONSTRAINED CO-OPS
FOR SALE IN NEW YORK CITY, 2020
Listing Costs ($) Income Limit ($)
Price Down Payment Single Family of 4
Mean 490,409 98,082 121,424 173,442
25th Percentile 350,000 70,000 95,520 136,440
Median 465,000 93,000 95,520 136,440
75th Percentile 599,000 119,800 131,340 187,605
Note: Data represent listings scraped from StreetEasy, and represent HDFC (income-limited co-operative) listings in 2020.
CR E AT I V E CO M M O N S CO P Y R I GHT 20 22 | R O O S E VE LTINS TITUTE . O R G 20More striking, at the median, a buyer would have to put down $92,900 in order to
purchase a unit in one of these income-constrained co-operative buildings in 2020.
What’s more, the $70,000 down payment at the 25th percentile suggests that while
25 percent of the listings have down payments below that amount, 75 percent of listings
require more than a $70,000 down payment to make the purchase. Unlike its income
and mortgage payment rules, the HDFC policy puts no limit on buyers’ assets or on the
required down payment.
The required down payments nearly reach the level of income allowed. For example, at
the median, income cannot exceed $95,520 for a single adult, while the down payment
reaches $93,000. By contrast, the New Deal–era FHA, which was designed to bring white
working-class families into homeownership, afforded its lower-income homebuyers
a down payment at 20 percent of annual household income. Here, the down payment
reaches approximately 97 percent of annual income at the median.
Given the racial disparity in wealth, which holds across different levels of income, we
anticipate that Black families who are income-eligible, whose earnings do not exceed
the income limit, may be less likely to have the assets to meet the down payment
required to buy into this homeownership policy. To examine this, we compared listing
prices and down payments to publicly available data on the household incomes and
wealth of city dwellers by race. We assessed whether households in the 2017 Panel
Study of Income Dynamics who live in a metropolitan area and who fall below the
income threshold for a given listing would have the assets needed to make the down
payment.5 To be generous in our interpretation, we allowed any form of asset to be used
to contribute to the down payment, including, for example, retirement accounts and
vehicle equity.
5
In the absence of any data on the distribution of wealth in New York City by race, we use nationally representative data
on all US households who are defined by the Census Bureau as living in a metropolitan statistical area. Local data on
wealth by race could be useful in informing program design.
CR E AT I V E CO M M O N S CO P Y R I GHT 20 22 | R O O S E VE LTINS TITUTE . O R G 21TABLE 5. SHARE OF INCOME-ELIGIBLE HOUSEHOLDS WITH
NET WORTH BELOW MEDIAN DOWN PAYMENT
Income Eligible but Income Eligible but Lack
Income Eligible
Lack Wealth Wealth, with Parents' Wealth
White 82.9 51.4 44.8
Black 94.7 83.3 80.5
Latinx 93.5 72.9 68.9
Note: Table compares income eligibility with ability to meet down payment requirements for HDFC home-buying policy for
income-constrained buyers in New York City. Table shows that most households meet the median income requirement,
but a majority of non-white households have wealth below the necessary down payment. Wealth and income data are
nationally representative for households in a metropolitan area from the 2017 Panel Study of Income Dynamics.
As suspected, we find that Black families are the most likely to be excluded from
purchasing an HDFC co-op due to down payments in excess of household net worth.
The down payments of HDFC co-op listings exceed the total net worth of 83 percent of
income-eligible Black families in US cities (Table 2). More than 7 in 10 Latinx households
will be excluded from participation on the basis of wealth. By comparison, just over half
of income-eligible white families will lack the wealth needed to buy a co-op apartment.
Given the potential for disparate access to parental financial support through
monetary gifting and other forms of intergenerational financial assistance (Charles
and Hurst 2002), we additionally examine disparities after accounting for parental
wealth. We sum the value of assets held by the household’s living parents and the
value of assets held by the household itself, and reassess whether families are then
able to meet the down payment requirements. We find a small change in the expected
direction (Table 2). Six additional percentage points of white families can become able
to afford one of the HDFC co-op units, making a majority of income-eligible white
people capable of participating. But only three percentage points of Black households
are pushed over the edge by parental wealth. Even incorporating parental assets,
80.5 percent of listings for which Black families are income-eligible will still exclude
them from participating on the basis of down payment, while only 44.8 percent of
listings for which white families are income-eligible will require down payments that
are prohibitively expensive to the family.
CR E AT I V E CO M M O N S CO P Y R I GHT 20 22 | R O O S E VE LTINS TITUTE . O R G 22The figures below illustrate these findings. As shown in Figure 4 a majority of
households meet the income eligibility threshold for the median HDFC listing. Nearly
every Black family has income below the maximum allowed, as do a substantial
majority of Latinx and white households. For all three groups, the 75th percentile of
the income distribution, illustrated by the top of the shaded gray box, falls below the
median income threshold. This means that at least 75 percent of the population has
income below the constrained level imposed by the policy, reflecting the way in which
the policy functions more effectively as middle- rather than low- income housing. This
contrasts with New Deal–era FHA-insured mortgages, which were designed for lower-
income households, specifically those at 35th percentile of the income distribution.
The median “affordable” listing requires families
to have $93,000 in cash to put down on the
purchase, thereby excluding the vast majority of
non-white families.
In order to purchase one of these homes, a household’s income must therefore fall
below the income threshold (most do), while at the same time its wealth must exceed
the needed down payment. As shown in Figure 5, very few Black families have the
wealth that HDFCs require. The median listing, again, in a policy considered a pathway
to affordable homeownership for formerly redlined communities, requires families to
have $93,000 in cash to put down on the purchase, thereby excluding the vast majority
of non-white families from Article XI’s purview without ever referencing their race.
CR E AT I V E CO M M O N S CO P Y R I GHT 20 22 | R O O S E VE LTINS TITUTE . O R G 23Figure 4. Income Distribution of US Households Versus
250,000
200,000
Median Income Threshold
Median HDFC
income limit
150,000
Family Income
100,000
50,000
0
White Black Latinx
Figure 5. Wealth Distribution of Income-Eligible Households Versus
Median Down Payment
1,000,000
500,000
Median HDFC
Wealth
down payment
0
-500,000
White Black Latinx
Note: HDFC purchasers must have income below the limit, with the median shown in Figure 4, and a net worth above
the down payment, also shown at the median in Figure 5. While income eligibility is common for all races, net worth
is particularly unlikely to lie above the median down payment line for Black and Latinx American households. Data
on HDFC income restrictions and down payments are scraped from Street Easy for HDFC listings in 2020. Household
income and wealth are nationally representative of households in a metropolitan area from the 2017 Panel Study of
Income Dynamics.
CR E AT I V E CO M M O N S CO P Y R I GHT 20 22 | R O O S E VE LTINS TITUTE . O R G 24Resident Expenses
The HDFC housing policy started in response to the problem of abandoned and
unmaintained apartment buildings—those left in disrepair by owners who had
stopped investing in ongoing maintenance. Since federal funds for home buying went
almost exclusively to white families in segregated neighborhoods in the early 20th
century, formerly redlined residents were left with blighted buildings, safety hazards,
and infrastructure sorely in need of habitability investment. However, the co-op
ownership policy left the issue of habitability largely unresolved. The state has made
available a sum of funds from which HDFCs could draw, which would be replenished
by ongoing payments or upon resale by a share of any profits that may have accrued
within the limited-income strictures. Usually, habitability loans were set up to be paid
off collectively over time. Because the buildings were set up as co-operatives, the cost of
taxes, capital investments, ongoing maintenance, and debt repayment would have to be
divided among each of the families in the co-op. This problem has persisted into today.
If a household lacks the capacity to contribute to these costs (often the case among
limited-income residents without ready access to their equity), the financial stability of
the whole co-op can be jeopardized.
The result is that many HDFCs have been, or are currently in danger of being, in arrears
or financially unmanageable disrepair, amassing hundreds of thousands of dollars in
unpaid bills, fines, and taxes. In 2018, the average HDFC pending disclosure had accrued
78 violations and owed $972,000 in unpaid debt (Stewart 2018). Eventually, the city seizes
these indebted properties and transfers ownership to a third party whom they charge
with creating affordable rental housing. From 1996 to 2008, the city seized 1,669 HDFC
units.6 This process entirely divests co-op owners of even the limited equity that would
have been available to them under the policy’s strictures.
The financial stakes are high and growing: Most of the HDFCs facing third-party
transfer of ownership are located in rapidly gentrifying neighborhoods (Swarts 2019).
And co-op owners often lack the resources for independent representation, given their
limited incomes and lack of access to wealth. As a result, the problem of “deed theft”
has grown in the HDFC sector, with private developers aggressively pursuing third-party
ownership transfer (Frost and Abruzzese 2019; Montgomery 2019; Partnow 2019).
This process thus creates another avenue whereby ownership of HDFC co-ops
transitions over time from the tenant organizers to the individuals and organizations
that have capital to offer.
6
According to reporting from the New York Times and Al Jazeera, the city forgives the back debts of seized buildings
and sells them to the third party for less than $10,000 per home, in addition to providing low-interest municipal loans for
construction improvements (Stewart 2018; Swarts 2019).
CR E AT I V E CO M M O N S CO P Y R I GHT 20 22 | R O O S E VE LTINS TITUTE . O R G 25You can also read