MANAGEMENT'S DISCUSSION AND ANALYSIS - 2021 Annual
←
→
Page content transcription
If your browser does not render page correctly, please read the page content below
MANAGEMENT’S
DISCUSSION
AND
ANALYSIS

2021 Annual

FORWARD‐LOOKING STATEMENTS
         SUMMIT INDUSTRIAL INCOME REIT                                                                                  This Management’s Discussion
Certain statements   in this MD&A
          Management’s               are “forward‐looking
                             Discussion    and Analysis statements” within the meaning of applicable                     2021   – Analysis
                                                                                                                              and Annualof results of
securities laws. These statements reflect Management’s expectations regarding the REIT’s future growth,             operations and financial condition
results of operations, performance and business prospects and opportunities including expectations for               of Summit Industrial Income REIT
the current financial year, and include, but are not limited to, statements with respect to Management’s                     relates to the year ended
beliefs, plans, estimates and intentions, and similar statements concerning anticipated future events,                    December 31, 2021, and was
results, circumstances, performance or expectations that are not historical facts. Statements that contain                   approved by the Board of
the words such as “could”, “should”, “would”, “can”, “anticipate”, “expect”, “does not expect”, “believe”,                          Trustees, upon the
“plan”, “budget”, “schedule”, “estimate”, “intend”, “project”, “will”, “may”, “might”, “continue” and                     recommendation of its Audit
similar expressions or statements relating to matters that are not historical factors constitute forward‐           Committee, on February 16, 2022.
looking statements. Such forward‐looking statements reflect Management’s current beliefs and are based
on information currently available to Management.                                                                       This MD&A has been prepared
                                                                                                                              with an effective date of
These statements are not guarantees of future events or performance and, by their nature, are based on                February 16, 2022, only includes
the REIT’s current estimates and assumptions, which are subject to significant risks and uncertainties. A             material information and should
number of factors could cause actual results to differ materially from the results discussed in the forward‐           be read in conjunction with the
looking statements including, but not limited to, risks associated with real property ownership, debt                            Financial Statements.
financing, interest and financing, capital requirements, credit risk, general uninsured losses,
developments, future property acquisitions, competition for real property investments, environmental                  Financial data provided has been
matters, land leases, potential conflicts of interest, governmental regulations, the relative illiquidity of real    derived from financial statements
property, taxation, reliance on key personnel, and the pandemic caused by the spread of the novel                           that have been prepared in
coronavirus (“COVID‐19”). These risks, and others, are more fully discussed under Appendix F | Risks and            accordance with IFRS, which is the
Uncertainties in this MD&A. Material factors and assumptions that were applied in drawing a conclusion              REIT’s GAAP, with the exception of
or making an estimate set out in the forward‐looking information may include, but are not limited to:                 certain non‐GAAP measures that
interest rates; access to equity and debt capital markets to fund, at acceptable costs, the future growth of               are identified as such in this
the REIT and to enable it to refinance debts as they mature; the REIT’s ability to maintain occupancy and                MD&A (see Appendix A |Non‐
to lease or re‐lease space at current or anticipated rents; and the availability of purchase opportunities for                        GAAP Measures).
growth in Canada. Given the impact of the COVID‐19 pandemic, and government measures to contain it,
there is inherently more uncertainty associated with any assumptions made. The REIT has attempted to                     Certain investment properties
identify important factors that could cause actual results, performance or achievements to be other than              were classified as held for sale in
as expected or estimated and that could cause actual results, performance or achievements to differ                        periods reported within this
materially from current expectations. These factors are not intended to represent a complete list of the                      MD&A. These investment
factors that could affect the REIT. Although the forward‐looking statements contained in this MD&A are                  properties were excluded from
based upon what Management believes to be reasonable assumptions, the REIT cannot assure investors                    certain operational measures for
that actual results will be consistent with these forward‐looking statements.                                            the periods during which they
                                                                                                                        were classified as held for sale,
The forward‐looking statements contained herein are expressly qualified in their entirety by this                       including property count, GLA,
cautionary statement and readers should not place undue reliance on such forward‐looking statements.                    occupancy, and same property
In addition, certain statements included in this MD&A may be considered a “financial outlook” for                       NOI. The number of properties
purposes of applicable securities laws, and such financial outlook may not be appropriate for purposes               and associated GLA of investment
other than in this MD&A. These forward‐looking statements are made as at the date of this MD&A and                  properties held for sale is reported
the REIT assumes no obligation to update or revise them to reflect new events or circumstances unless                        by quarter in Appendix B |
otherwise required to do so by applicable securities legislation.                                                           Summary Financial Results.

                                                                                                                       Except for per unit amounts and
NON‐GAAP MEASURES*                                                                                                          where otherwise noted, all
                                                                                                                             amounts in this MD&A are
Readers are cautioned that certain terms used in this MD&A are non‐GAAP or other financial measures
                                                                                                                    reported in thousands of Canadian
(“non‐GAAP measures”), as defined in National Instrument 52‐112 Non‐GAAP and Other Financial                              dollars. Where presented in a
Measures Disclosure, which do not have any standardized meaning prescribed under IFRS and, therefore,                tabular format, GLA and sq. ft. are
should not be construed as alternatives to net income or cash flow from operating activities calculated in              reported in thousands of sq. ft.
accordance with IFRS. Such terms do not have a standardized meaning prescribed by IFRS and the
computation of these non‐GAAP measures may not be comparable to similarly titled measures presented
by other publicly traded entities. See Appendix A | Non‐GAAP Measures for more information on the non‐
GAAP measures used in this MD&A and their associated reconciliations. Non‐GAAP measures are
referenced with an asterisk footnote “*” throughout this MD&A.

The REIT’s significant accounting policies are described Note 3 to the Financial Statements. The
preparation of financial statements requires the REIT to make estimates and judgements that affect the
reported results. For a detailed discussion of the critical estimates refer to Note 5 to the Financial
Statements.

Additional information relating to the REIT, including the latest AIF, is filed on SEDAR and can be
     1 | BUSINESS
accessed              OBJECTIVES
         electronically            AND STRATEGY
                        at www.sedar.com.                                                                                                     2
SUMMIT INDUSTRIAL INCOME REIT
  Management’s Discussion and Analysis                                                               2021 – Annual

                                                                                     CONTENTS

        1 | BUSINESS OBJECTIVES AND STRATEGY .......................................... 10
        2 | STRATEGIC VALUE DRIVERS .......................................................... 11
        3 | FINANCIAL AND OPERATING HIGHLIGHTS ..................................... 12
        4 | KEY PERFORMANCE INDICATORS .................................................. 15
        5 | RESULTS OF OPERATIONS ............................................................. 16
        6 | PROPERTY PORTFOLIO .................................................................. 19
        7 | DEVELOPMENT AND EXPANSION .................................................. 22
        8 | OPERATIONS ................................................................................. 26
        9 | LIQUIDITY AND CAPITAL ............................................................... 31
        10 | DISTRIBUTIONS ........................................................................... 38
        11 | MARKET OVERVIEW AND OUTLOOK ........................................... 40
        APPENDIX A | NON‐GAAP MEASURES ................................................ 43
        APPENDIX B | SUMMARY FINANCIAL RESULTS ................................... 50
        APPENDIX C | BALANCE SHEET ANALYSIS ........................................... 51
        APPENDIX D | RELATED PARTY TRANSACTIONS ................................. 52
        APPENDIX E | TAXATION .................................................................... 54
        APPENDIX F | RISKS AND UNCERTAINTIES .......................................... 55
        APPENDIX G | OTHER DISCLOSURES ................................................... 65
        APPENDIX H | GLOSSARY OF TERMS .................................................. 67

1 | BUSINESS OBJECTIVES AND STRATEGY                                                                                 3
SUMMIT INDUSTRIAL INCOME REIT
      Management’s Discussion and Analysis                                           2021 – Annual

Founded in 2012, Summit is the only publicly‐traded pure‐play industrial
REIT with 100% of its properties located in Canada. Summit owns, manages
and develops light industrial properties located in key major urban markets.
  D
Summit is headquartered in Markham, Ontario and has 5 property
management offices.

The light industrial sector is a vital part of the Canadian              Q4 2021
economy and is a stable long‐term asset class with
numerous opportunities for growth. Summit’s portfolio                    SNAPSHOT
encompasses distribution facilities, warehouses,
cold storage and light manufacturing, with a focus
on larger single‐tenant properties.

Summit is listed on the TSX under
the symbol SMU.UN and is a
                                                                           $128.2 million
constituent of the S&P/TSX                                                     NET INCOME
Capped REIT Index.

Number of Properties:
156
(20.7 million sq. ft)
                                                                                 +4.1%
Total Assets:                                   $41.3 million
$4.5 billion                                 NET RENTAL INCOME           SAME PROPERTY NOI
                                                                             GROWTH*

                                                                               $3.0 billion
                     99.2%                          $0.178
                                                                           UNENCUMBERED
                  OCCUPANCY                      FFO PER UNIT*
                                                                               ASSETS

                                                                                  8.3x
                     28.5%                           71.9%
                               *
                                                                          DEBT‐TO‐ADJUSTED
                   LEVERAGE
   1 | BUSINESS OBJECTIVES AND STRATEGY      UNSECURED DEBT %                                        4
                                                                               EBITDA*
SUMMIT’S             PORTFOLIO
 SUMMIT INDUSTRIAL INCOME    REIT
 Management’s Discussion and Analysis                                                                    2021 – Annual

ATTRACTIVE LIGHT INDUSTRIAL ASSET CLASS

                                                                                                      LOW CAPITAL
     LOW RENT                                                                                        MAINTENANCE,
                                                                     GENERIC AND
   VOLATILITY WITH                        REDUCED                                                      LEASEHOLD
                                                                       HIGHLY
    HIGH TENANT                        OPERATING COSTS                                              IMPROVEMENT &
                                                                   MARKETABLE SPACE
     RETENTION                                                                                           TENANT
                                                                                                  INDUCEMENT COSTS

Historically, vacancy rates in the industrial sector over the long term have been
low, with a tenant base that is generally a reflection of the broader economy and
increasingly includes e‐commerce and logistics tenants. Property location, access
to major highway infrastructure, as well as strong labour pools are key value
drivers for industrial real estate.

REIT PORTFOLIO
The REIT’s portfolio focuses on well‐maintained larger properties in key target
markets in Canada, encompassing distribution facilities, warehouses, light
manufacturing and cold‐storage. The majority of the REIT’s properties
encompass “Triple‐Net” lease structures.

2300 Émile Bélanger Steet & 3665 Poirier Boulevard, Montreal, QC

                                                                        566 Aero Drive, Calgary, AB
1 | BUSINESS OBJECTIVES AND STRATEGY                                                                                     5
SUMMIT’S            EASTERN
 SUMMIT INDUSTRIAL INCOME REIT CANADIAN FOCUS
  Management’s Discussion and Analysis                       2021 – Annual

The REIT’s geographic focus is on Eastern Canada
in the key target markets of the GTA and GMA.

GREATER TORONTO AREA ‐ ONTARIO
                                                             QUEBEC
       ONTARIO                                     ONTARIO

   50% of Total GLA

GREATER MONTREAL AREA ‐ QUEBEC

       QUEBEC
   22% of Total GLA

1 | BUSINESS OBJECTIVES AND STRATEGY                                         6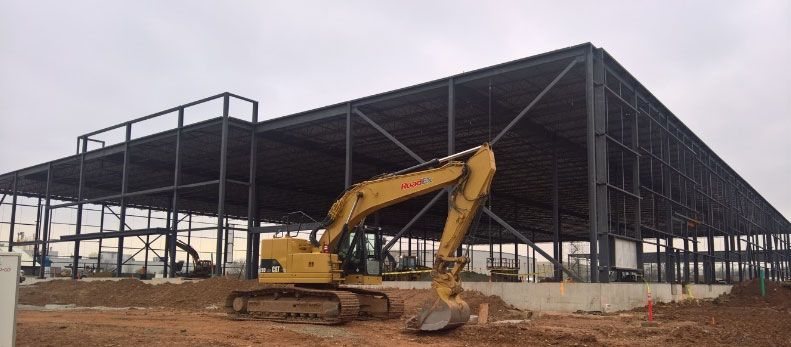
DEVELOPMENT
SUMMIT INDUSTRIAL INCOME REIT AND EXPANSION
Management’s Discussion and Analysis 2021 – Annual
Active development, expansion and re‐development program.
On balance sheet (100% REIT‐owned) as well as through JV partnerships with
third‐party developers.
Source of brand new environmentally responsible properties upon project
completion.
5.0 million sq. ft. of redevelopment and/or expansion potential in the REIT’s
existing portfolio.
425 Bingemans Centre Drive, Kitchener, ON
Key target markets of
GTA and GMA
4225 North Service Road, Burlington, ON
48% REIT
52% JV Partnerships
Current Development Projects
90% Ontario
10% Quebec PLANNING AND
PERMITTING
% of Planned GLA 46% 1,429,115
SF
UNDER
CONSTRUCTION
54%
1 | BUSINESS OBJECTIVES AND STRATEGY 7
CORPORATE
SUMMIT INDUSTRIAL INCOME RESPONSIBILITY,
REIT SUSTAINABILITY
Management’s Discussion and Analysis 2021 – Annual
AND ESG FOCUS
The REIT’s ESG philosophy:
ENVIRONMENTAL SOCIAL GOVERNANCE
Sustainability and corporate responsibility = long‐term business success.
Prioritizing ESG generates long‐term value by minimizing the REIT’s
environmental impact and carbon footprint, through responsible investing,
promoting equity, diversity and inclusion, and supporting social and
community initiatives while striving for top‐tier governance.
ESG considerations are a priority across all of the REIT’s activities
including operations as well as at its Board of Trustees.
Executive compensation is scorecard based and
includes ESG criteria.
The REIT solicits and encourages
ongoing stakeholder engagement
in its ESG policies and
disclosures.
1 | BUSINESS OBJECTIVES AND STRATEGY 8
SUMMIT’S ESGREIT
SUMMIT INDUSTRIAL INCOME ACCOMPLISHMENTS
Management’s Discussion and Analysis 2021 – Annual
ENVIRONMENTAL
Green Financing Framework Issued Green Financing Framework in April 2021 with second‐party opinion provided by DNV, a
global leader in providing ESG research and analysis.
Green Bond IPO Closed $250 million senior unsecured debenture offering in April 2021. One of only six TSX‐listed
REITs to have Green Bonds outstanding.
Green Unsecured Implemented $75 million green unsecured revolving credit facility to fund green development
Development Line projects, the first labelled Green Loan of its kind in Canada.
LEED Certified Buildings 5 buildings, comprising almost 750,000 total sq. ft., are LEED Certified.
First refrigerated warehouse in Canada to achieve LEED Gold Certification.
Buildings with Solar Panels 6 buildings with solar panels.
Energy Efficiency / Resource Upgrade all properties to energy efficient lighting on tenant turnover where not already in place.
Management All toilet replacements completed by the REIT are low flow.
4 properties with electric vehicle charging stations, and actively promoting transportation
options such as walking, cycling and public transportation.
100% paperless Board materials.
Green Organization Member of Canada Green Building Council, a leading not‐for‐profit national environmental
Membership organization.
SOCIAL
Market Leading Recognition Honouree in the Report on Business (Globe and Mail) Women Lead Here list, 2021 recipient.
Equity, Diversity and 40% of Named Executive Officers, approximately 60% of employees and 1/3 of Independent
Inclusion Trustees are female.
Written Employment Equity Policy, Diversity Policy, Privacy Policy and Accessibility Policy.
Tenant Support Supported eligible tenants through COVID‐19 pandemic through participation in Canada
Emergency Commercial Rent Assistance (CECRA) program and rent deferral programs.
Employees Ensure safe working conditions through adherence to jurisdictional occupational health, safety
and labour standards.
Regularly conduct employee surveys for feedback and improvement.
Community Involvement Trustee and employee participation in and support of numerous community and charitable
initiatives.
Wellness Support and promote continuing education for employees and Trustees.
Employee fitness initiatives and COVID‐19 pandemic‐related wellness support and programming.
GOVERNANCE
ESG Priority and Focus Dedicated ESG Committee on Board of Trustees (comprised of 100% Independent Trustees).
Cross‐functional Green Finance Working Group consisting of members from various departments
of the REIT.
Trustee who sits on the Committee on the Future of Corporate Governance in Canada created by
TMX Group and the Institute of Corporate Directors (ICD).
Executive Compensation Executive bonus incentive compensation is scorecard‐based and includes ESG criteria.
Ethical Business Conduct Written Code of Business Conduct and Ethics, Whistleblower Policy, Insider Trading,
Confidentiality Walls and Anti‐Hedging Policy and Anti‐Bribery and Corruption Compliance Policy.
Risk Management Cyber security and information technology policies and procedures.
COVID‐19 pandemic task force.
Internal signatory and financial controls.
Board Composition Ongoing review for potential Board renewal, equity, diversity and inclusion and formal Trustee
Skills Matrix.
Board Alignment Minimum Unit Ownership Policy and Majority Voting Policy.
86% of Trustees are considered Independent.
Independent Chair of Board of Trustees.
1 | BUSINESS OBJECTIVES AND STRATEGY 9
Audit, ESG and Compensation and Nominating Committees are 100% Independent.
Significant Board ownership at 7.4%.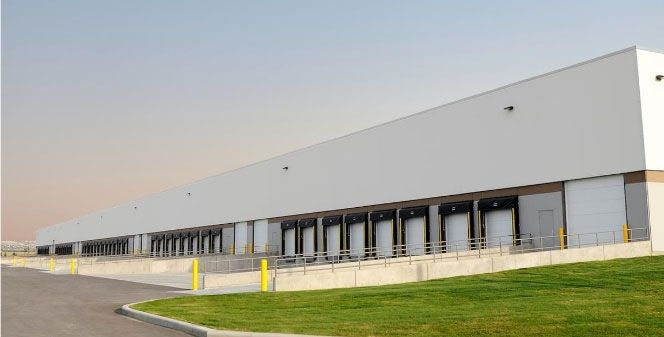
SUMMIT INDUSTRIAL INCOME REIT
Management’s Discussion and Analysis 2021 – Annual
1 | BUSINESS OBJECTIVES AND STRATEGY
Summit Industrial Income REIT is an unincorporated mutual fund trust governed by the laws of the Province of Ontario
pursuant to the terms of its Declaration of Trust.
The REIT’s strategy is to provide “best‐in‐class” services to its tenants while delivering solid, stable, and secure returns
to its Unitholders in an environmentally and socially responsible manner. Over the long term, the REIT is dedicated to
maximizing FFO* through effective property management, realizing on efficiencies and synergies from critical mass,
accretive acquisitions, innovative financings, selective development opportunities as well as active portfolio
management through strategic dispositions.
To achieve its goals, the REIT has developed the following key objectives:
Generate Generate accretive growth while acquiring real estate at or below replacement cost.
superior, Strategically maximize development and expansion opportunities and returns.
dependable Consistently deliver growth in FFO* over the long term by achieving operating
returns over the synergies and increasing economies of scale.
long term Alignment of corporate responsibility and ESG policies with all REIT activities to
maximize returns.
Leading landlord Continue to add critical mass in target markets through acquisitions, expansion of
owned properties and direct and third‐party JV, development and redevelopment
in target markets
projects.
Leverage economies of scale, local relationships, market data and pricing power as a
significant player in respective markets.
A top manager of Be a “best‐in‐class” service provider to tenants through innovative programs that focus
on tenant retention, standardization of operations, operating efficiencies,
industrial real
implementation of technology and positive long‐term relationships.
estate in Canada
Through its strong reputation as a leading service provider and continuing to meet the
needs of its tenants, the REIT will continue to optimize occupancy, rental rates, tenant
retention and other lease parameters over the long term.
Opportunistically and proactively manage its tenant base to anticipate and maximize
strategic leasing situations based on current and expected future market conditions.
1 | BUSINESS OBJECTIVES AND STRATEGY 10SUMMIT INDUSTRIAL INCOME REIT
Management’s Discussion and Analysis 2021 – Annual
2 | STRATEGIC VALUE DRIVERS
The REIT’s strategic value drivers are governed by its ESG philosophies and encompass various financial and operational
considerations relating to its existing real estate portfolio, as well as acquisitions, expansion and development activities.
PROPERTY STRATEGIES REIT STRATEGIES
Actively manage tenant relationships. Act as responsible stewards of capital.
Balance occupancy, tenant retention and Maximize total return while minimizing risk.
turnover costs while maximizing rent.
Ensure adequate levels of liquidity.
Strategic leasing considering renewals, term,
annual rental steps, maximizing rental rates. Balancing leverage* and debt metrics with FFO
Payout Ratios* and FFO per Unit* growth.
Target diversification of tenant base and lease
maturities. Well‐balanced debt maturity schedule.
Focused capital expenditure program to ensure Ongoing assessment of secured versus
well‐maintained properties that remain unsecured debt financing alternatives and
competitive while achieving environmental exposure to floating rate debt.
efficiencies. Continue to grow the REIT through a disciplined
Identify expansion potential within existing approach and strategic combination of organic
tenant base. growth, acquisitions, and development.
2 | STRATEGIC VALUE DRIVERS 11SUMMIT INDUSTRIAL INCOME REIT
Management’s Discussion and Analysis 2021 – Annual
3 | FINANCIAL AND OPERATING HIGHLIGHTS
The REIT continued to experience strong operating results during the fourth quarter of 2021, including strong leasing
activity, occupancy and rent collection, and continued to build its investment property portfolio through income‐
producing and development property acquisitions. The REIT’s financial and operating highlights for the fourth quarter
and year ended December 31, 2021 and subsequent events are outlined below.
FINANCIAL
Revenue from investment properties increased by 11.0% in Q4 2021 and 13.7% in 2021 driven by portfolio growth,
high stable occupancies and rent increases.
Net rental income increased by 11.9% in Q4 2021 and 15.2% in 2021.
Fair value gains on investment properties of $98.0 million ($0.557 per Unit) in Q4 2021 and $1.0 billion ($6.05 per
Unit) in 2021.
During 2021, the REIT strategically repaid $329.5 million of variable rate secured term mortgages that were fixed
using interest rate swaps and set to mature between 2023 and 2029 using the proceeds from the Series C and
Series D senior unsecured debenture offerings. A non‐recurring payment of $20.0 million was incurred as a result
of the repayment. The secured term mortgages that were repaid carried a weighted average interest rate of 3.90%,
and the REIT expects annual interest rate savings of approximately $4.5 million. The repayment also increased the
REIT’s pool of unencumbered assets.
FFO* of $31.2 million ($0.178 per Unit) in Q4 2021 and $100.0 million ($0.587 per Unit) in 2021 including the non‐
recurring secured mortgage prepayment costs of $20.0 million for 2021, as discussed above.
FFO per Unit* of $0.178 per Unit in Q4 2021 and $0.587 per Unit in 2021. Excluding the prepayment costs, discussed
above, FFO per Unit* would have been $0.705 per Unit in 2021.
Entered into a $75 million Green Unsecured Development Credit Facility to finance current and future industrial
property developments, the first labelled Green Loan of its kind in Canada. The total credit facility size including
the conventional tranche is $100 million and has a 3‐year term to maturity.
Extended the term of the $300 million unsecured revolving credit facility by one year to March 23, 2024.
On April 12, 2021, the REIT completed its inaugural Green Bond offering of $250 million, 2.25% Series C senior
unsecured debentures, maturing on January 12, 2027.
On July 14, 2021, the REIT completed an offering of $225 million Series D senior unsecured debentures at a fixed
rate of 2.44% per annum, maturing on July 14, 2028.
On September 17, 2021, DBRS changed the trends on the REIT’s Issuer Rating and Senior Unsecured Debentures
rating to Positive from Stable and confirmed the ratings at BBB (low).
Completed a bought‐deal equity offering of REIT Units for gross proceeds of $126.7 million on September 22,
2021. The proceeds from the offering were used to finance the 725,000 square foot logistics centre and adjacent
trailer parking site (the “Crosspointe Logistics Centre”) near Calgary, Alberta that closed on October 29, 2021.
Collected entire deferred proceeds of $28.8 million from the sale of the DC2 data centre in May 2020, which
resulted in the recognition of an additional realized gain on sale of $4.7 million ($0.028 per Unit).
3 | FINANCIAL AND OPERATING HIGHLIGHTS 12SUMMIT INDUSTRIAL INCOME REIT
Management’s Discussion and Analysis 2021 – Annual
Strong liquidity position at December 31, 2021, with approximately $1.1 billion of available liquidity* including
cash, borrowing capacity on the REIT’s unsecured revolving credit facility and Green Unsecured Development Credit
Facility, and potential new financing that could be placed on a portion of the REIT’s $3.0 billion of unencumbered
assets.
OPERATIONS
Strong occupancy at 99.2% compared to 98.0% at December 31, 2020, with an average lease term of 5.4 years and
1.9% average annual contractual rent steps.
Same property NOI* increased 4.1% in Q4 2021 and 4.8% in 2021, with Ontario, Quebec, and Alberta each
contributing 6.6%, 2.8% and 1.1%, respectively, in Q4 and 6.5%, 3.4% and 3.4%, respectively, in 2021.
Completed 2.1 million sq. ft. of 2021 lease renewals and new lease deals during the year with a strong 74.3%
retention rate, generating a 27.9% overall increase in rents (excluding contractual renewals).
Substantial pre‐leasing on development projects of over 590,000 sq. ft or 41% of sq. ft. under development.
Future lease commitments on 97,878 sq. ft. or 61.3% of 2021 vacancy.
PROPERTY PORTFOLIO
Acquired five income‐producing properties during the year for a total of 1.8 million sq. ft. for a purchase price of
$380.9 million at an average cap rate of 4.3%.
Acquired interests in three development properties during the year, totalling 29.1 acres for a purchase price of
$32.6 million, with the potential to add 541,610 sq. ft. of GLA to the REIT’s portfolio.
Disposed of 0.4 million sq. ft. of non‐core investment properties for gross proceeds of $64.2 million.
On January 17, 2022, completed the acquisition of the remaining 50% interest in two recently constructed
properties in Guelph, Ontario totalling 441,921 sq. ft. from the REIT’s joint venture partner for a purchase price of
$54.9 million. When combined with its existing ownership interest in the properties, the REIT's total investment is
approximately $84.6 million, generating a consolidated cap rate of approximately 4.7%.
On January 20, 2022, acquired a 12‐acre parcel of land with the potential to construct a 180,000 square foot light
industrial building, located at the intersection of Appleby Line and Highway 407 in Burlington, Ontario, for a
purchase price of $27.5 million.
On February 3, 2022, acquired a 50% interest in a 19.5‐acre development site in Kitchener, Ontario, for a purchase
price of $5.5 million. This project will be completed with the REIT’s joint venture partner and has the potential to
develop a 360,000 square foot building.
ESG
Issued Green Financing Framework, which allows the REIT to issue green financing instruments to finance or re‐
finance Eligible Green Initiatives. Received Second Party Opinion from DNV.
Recognized for its commitment to equity, diversity and inclusion by earning a spot on the Globe and Mail's 2021
Report on Business “Women Lead Here” list.
Achieved the REIT’s stated Board diversity target ahead of 2022 target.
3 | FINANCIAL AND OPERATING HIGHLIGHTS 13SUMMIT INDUSTRIAL INCOME REIT
Management’s Discussion and Analysis 2021 – Annual
OTHER
Insider ownership fully aligned with 7.6% of REIT Units outstanding held by management and Trustees at December
31, 2021.
On May 11, 2021, the REIT announced a 4.4% increase in monthly cash distributions to $0.047 per Unit ($0.564 per
Unit annualized).
4455 North Service Road, Burlington, ON
3 | FINANCIAL AND OPERATING HIGHLIGHTS 14SUMMIT INDUSTRIAL INCOME REIT
Management’s Discussion and Analysis 2021 – Annual
4 | KEY PERFORMANCE INDICATORS
Annual
Q4 2021 Q4 2020 2021 2020 2019
Portfolio Performance
Occupancy 99.2% 98.0% 99.2% 98.0% 98.5%
Revenue from i nves tment properties $ 56,911 $ 51,253 $ 216,971 $ 190,906 $ 142,193
Property opera ti ng expens es $ 15,649 $ 14,392 $ 55,544 $ 50,796 $ 39,118
Net renta l income $ 41,262 $ 36,861 $ 161,427 $ 140,110 $ 103,075
Fina nce cos ts (2) $ 8,948 $ 9,819 $ 57,210 $ 41,535 $ 36,068
Fai r va l ue a djus tments to i nves tment properti es $ 97,967 $ 70,584 $ 1,031,385 $ 90,762 $ 188,617
Net income $ 128,240 $ 95,586 $ 1,131,994 $ 206,502 $ 147,586
Operating Performance
(1)(2)
FFO $ 31,277 $ 25,436 $ 100,040 $ 94,389 $ 67,156
(1)(2)
FFO per Uni t $ 0.178 $ 0.159 $ 0.587 $ 0.651 $ 0.582
Net income per Uni t ‐ ba s i c $ 0.729 $ 0.597 $ 6.644 $ 1.423 $ 1.278
Distributions
Di s tri butions decla red to Uni thol ders (3) $ 24,841 $ 21,976 $ 95,024 $ 79,252 $ 70,649
Di s tri butions per Uni t decl a red to Unithol ders (3) $ 0.141 $ 0.135 $ 0.556 $ 0.540 $ 0.602
FFO pa yout ra ti o wi thout DRIP benefi t(1)(2) 79.3% 85.0% 94.7% 83.0% 103.5%
FFO pa yout ra ti o wi th DRIP benefit(1)(2) 60.3% 68.8% 73.8% 67.6% 80.1%
Wei ghted a vera ge Units outs ta ndi ng (i n thous a nds ) 175,909 160,195 170,390 145,089 115,465
Liquidity and Leverage
Tota l a s s ets $ 4,542,994 $ 3,172,213 $ 4,542,994 $ 3,172,213 $ 2,608,679
Tota l unencumbered a s s ets $ 2,996,333 $ 1,054,481 $ 2,996,333 $ 1,054,481 $ 219,753
Tota l debt $ 1,293,573 $ 1,186,572 $ 1,293,573 $ 1,186,572 $ 1,127,919
Wei ghted a vera ge effective i nteres t rate 2.51% 2.99% 2.51% 2.99% 3.72%
Wei ghted a vera ge term to ma turity (yea rs ) 4.7 4.5 4.7 4.5 4.0
Levera ge (1) 28.5% 37.4% 28.5% 37.4% 43.2%
Interes t covera ge (1) 4.3x 3.5x 4.1x 3.2x 2.8x
Debt s ervi ce covera ge (1) 3.3x 2.3x 2.9x 2.1x 1.8x
Debt‐to‐adjus ted EBITDA(1) 8.3x 8.5x 8.5x 8.8x 11.0x
DBRS Is s uer Ra ti ng BBB (low) Positive BBB (l ow) Sta bl e BBB (low) Positive BBB (l ow) Stabl e ‐
Investment Properties
Property a cqui s i tions 2 14 5 23 42
Property di s pos iti ons 1 1 7 2 1
Number of properti es 156 156 156 156 146
Tota l GLA 20,651 19,360 20,651 19,360 17,492
(1)
Non‐GAAP Measure. Refer Appendix A | Non‐GAAP Measures for information and reconciliations.
(2)
Finance costs and FFO includes strategic non‐recurring mortgage prepayment costs of $20.0 million ($0.118 per Unit) for 2021. Excluding the prepayment costs, FFO per Unit
was $0.705 per Unit for 2021. FFO payout ratio without DRIP benefit excluding the prepayment costs was 78.9% (61.5% including DRIP benefit) for 2021.
(3)
2019 results include a special distribution of $8.4 million ($0.070 per Unit), which was declared and paid as a result of the sale of an investment property.
4 | KEY PERFORMANCE INDICATORS 15SUMMIT INDUSTRIAL INCOME REIT
Management’s Discussion and Analysis 2021 – Annual
5 | RESULTS OF OPERATIONS
Revenue from Investment Properties
Q4 2021 2021 The increase in revenue from investment
properties in both Q4 2021 and 2021 is
primarily due to continuing strong occupancies,
$56,911 $216,971 higher overall rental rates on leasing activities
Q4 2020 $51,253 +11.0% 2020 $190,906 +13.7% and the acquisitions completed over the prior
12 months.
Net Rental Income
Q4 2021 2021 The increase in net rental income in both Q4
2021 and 2021 is primarily due higher overall
rental rates on leasing activities and
$41,262 $161,427 acquisitions completed over the prior 12
Q4 2020 $36,861 +11.9% 2020 $140,110 +15.2% months, in addition to $0.1 million and $1.1
million in recoveries of allowances for expected
credit losses during Q4 2021 and 2021,
respectively, due to successful rent collection
efforts over the course of the pandemic.
Finance Costs
Q4 2021 2021 The increase in finance costs in 2021 is primarily
due to the non‐recurring mortgage prepayment
costs of $20.0 million resulting from the
$8,948 $57,210 strategic early repayment of certain secured
Q4 2020 $9,819 ‐8.9% 2020 $41,535 +37.7% term mortgages, which the REIT expects to
result in annual interest savings of
approximately $4.5 million (see Debt Profile).
The decrease in finance costs in Q4 2021 is a
result of these interest savings.
As a result of strategic debt restructuring
activities completed over the prior 12 months,
the increase in finance costs was partially offset
by a reduction in the REIT’s weighted average
interest rate from 2.99% at December 31, 2020
to 2.51% at December 31, 2021.
5 | RESULTS OF OPERATIONS 16SUMMIT INDUSTRIAL INCOME REIT
Management’s Discussion and Analysis 2021 – Annual
Fair Value Adjustments to Investment Properties
Q4 2021 2021 The increase in fair value gains on investment
properties in both Q4 2021 and 2021 is
primarily due to strong market conditions in the
$97,967 $1,031,385 GTA and GMA, including compression in
Q4 2020 $70,584 2020 $90,762 capitalization rates and increasing market
rents.
Net Income
Q4 2021 The increase in net income in both Q4 2021 and
2021
2021 is primarily due to the increase in fair
value gains on investment properties and net
$128,240 $1,131,994 rental income, discussed above, and was
Q4 2020 $95,586 2020 $206,502 partially offset by higher general and
administrative costs primarily due to fair value
increases on deferred unit compensation
resulting from a significant increase in the
REIT’s Unit price over the prior 12 months, and
higher finance costs due to the non‐recurring
mortgage prepayment costs, discussed above.
Same Property NOI*
The REIT experienced growth in same property
+4.1% +4.8% NOI* in all regions of the portfolio in both Q4
2021 and 2021. Growth in Ontario and Quebec
Q4 2021 $33,958 2021 $127,570
was driven primarily by 2021 lease renewals
Q4 2020 $32,632 2020 $121,687 and new lease deals, which generated an
average 53.8% and 29.5% increase over expiring
rents in Ontario and Quebec, respectively (see
Q4 2021 2021 Leasing). Growth in Alberta was driven largely
by increased occupancy (see Occupancy).
Ontario +6.6% Ontario +6.5%
Quebec +2.8% Quebec +3.4% Same property NOI* represented approximately
Alberta +1.1% Alberta +3.4% 82.3% and 79.0% of the total portfolio NOI*, and
Other Canada +1.0% Other Canada +0.3% 83.8% and 80.2% of total GLA for Q4 2021 and
2021, respectively.
5 | RESULTS OF OPERATIONS 17SUMMIT INDUSTRIAL INCOME REIT
Management’s Discussion and Analysis 2021 – Annual
FFO*, FFO per Unit* and FFO Payout Ratio*
Q4 2021 2021 FFO*, FFO per Unit* and FFO Payout Ratio* in
2021 were impacted by the non‐recurring
mortgage prepayment costs of $20.0 million
$0.178 per Unit $0.587 per Unit ($0.118 per Unit), related to the strategic early
($31,277) ($100,040) repayment of certain secured term mortgages
in Q2 and Q3 2021 (see Debt Profile). No
Q4 2020 $0.159 ($25,436) 2020 $0.651 ($94,389)
prepayment costs were incurred in Q4 2021.
Q4 2021 2021 Excluding the prepayment costs noted above,
FFO per Unit* increased 8.3% to $0.705 per Unit
79.3% (60.3% with DRIP benefit ) 94.7% (73.8% )
with DRIP benefit in 2021. Excluding the prepayment costs,
growth in FFO* and FFO per Unit* for Q4 2021
Q4 2020 85.0% (68.8%) 2020 83.0% (67.6%) and 2021 resulted from continuing strong
occupancies, higher overall rental rates on
leasing activities and the acquisitions
completed over the prior 12 months.
FFO Payout Ratio* without the DRIP benefit,
excluding the prepayment costs noted above,
was 78.9% (61.5% including the DRIP benefit)
for 2021.
5 | RESULTS OF OPERATIONS 18SUMMIT INDUSTRIAL INCOME REIT
Management’s Discussion and Analysis 2021 – Annual
6 | PROPERTY PORTFOLIO
INCOME‐PRODUCING INVESTMENT PROPERTIES
The following table outlines the growth in Summit’s portfolio since inception of the REIT in 2012. At December 31,
2021, the REIT’s property portfolio was comprised of 156 income‐producing investment properties totalling 20.7 million
sq. ft. with a fair value of $4.4 billion.
The following table provides information regarding the REIT’s income‐producing investment property portfolio at
December 31, 2021:
No. of No. of % of Prov. GLA % of Total Occupancy
Province Properties Tenants Single Tenant Multi‐Tenant Sq. Ft. of GLA GLA (%)
Onta rio 78 137 71% 29% 10,275 49.8% 99.9%
Quebec 29 42 76% 24% 4,583 22.2% 100.0%
Al berta 48 112 51% 49% 5,751 27.8% 97.4%
Other Cana da 1 1 100% 0% 42 0.2% 100.0%
Total 156 292 66% 34% 20,651 100.0% 99.2%
6 | PROPERTY PORTFOLIO 19SUMMIT INDUSTRIAL INCOME REIT
Management’s Discussion and Analysis 2021 – Annual
FAIR VALUE OF INVESTMENT PROPERTIES
At December 31, 2021, the total fair value of income‐producing investment properties was $4.4 billion ($213 per square
foot) with a weighted average capitalization rate of 3.8%.
The following chart outlines the fair value of the REIT’s income‐producing investment properties at December 31, 2021,
including some of the significant assumptions applied in the determination of fair value (refer to Note 6 of the Financial
Statements for more detail):
Fair Value of Investment Properties by Region
(% of Total Fair Value)
The REIT recognized fair value gains on investment properties for Q4 2021 and 2021 of $98.0 million and $1.0 billion,
respectively (Q4 2020 and 2020 ‐ fair value gains of $70.6 million and $90.8 million, respectively).
6 | PROPERTY PORTFOLIO 20SUMMIT INDUSTRIAL INCOME REIT
Management’s Discussion and Analysis 2021 – Annual
ACQUISITIONS
The following table outlines the REIT’s income‐producing property acquisitions for the year:
No. of Ownership Date of Purchase
Property City Province Properties (%) Acquisition GLA Price
Ba yl y Street Aja x Onta ri o 1 100% Ja nua ry 18, 2021 343 $ 68,000
Émi l e‐Bél a nger Street & Poi ri er Bouleva rd Montrea l Quebec 2 100% Apri l 9, 2021 765 183,350
Cros s poi nte Logi s ti cs Centre & Tra i l er Pa rki ng Si te Ca l ga ry Al berta 2 100% October 29, 2021 725 129,575
Total ‐ 2021 5 1,833 $ 380,925
Total ‐ 2020 23 1,707 $ 345,085
Crosspointe Logistics Centre, Calgary, AB
DISPOSITIONS
The following table outlines the REIT’s property dispositions for the year:
No. of Ownership Date of Selling
Property City Province Properties (%) Disposition GLA Price
56th Avenue Edmonton Alberta 1 100% Ma rch 31, 2021 30 $ 5,000
La nca s ter & Ba xter Portfol io Otta wa Onta rio 3 100% April 23, 2021 283 49,200
87A Avenue Edmonton Alberta 1 100% June 21, 2021 14 1,975
Cra nbrook Street Cra nbrook Bri tis h Col umbia 1 100% June 23, 2021 8 895
261s t Street Edmonton Alberta 1 100% November 1, 2021 44 7,100
Total ‐ 2021 7 379 $ 64,170
Total ‐ 2020 2 64 $ 7,750
On January 17, 2022, the REIT disposed of a non‐core investment property located on 107th Avenue in Edmonton,
Alberta for gross proceeds of $4.2 million. The property was classified as held for sale at December 31, 2021.
6 | PROPERTY PORTFOLIO 21SUMMIT INDUSTRIAL INCOME REIT
Management’s Discussion and Analysis 2021 – Annual
7 | DEVELOPMENT AND EXPANSION
In addition to the REIT’s income‐producing investment property portfolio, Summit pursues development and
redevelopment projects on a selective basis. Potential projects could include building expansions, greenfield
developments on land owned or acquired by the REIT, intensification projects to add density within the REIT’s existing
industrial portfolio, and via mezzanine financing arrangements to external development partners to fund the
construction of new buildings. In all cases, the objective of the development program is to augment the returns from
the REIT’s core portfolio of stabilized assets and to continue to upgrade the REIT’s portfolio through the addition of
brand new environmentally‐friendly assets, in a manner that minimizes risk to the REIT.
The REIT’s credit facility agreements contain certain restrictive covenants related to the volume of development
projects and mezzanine financing, while still providing ample flexibility to the REIT to pursue development
opportunities. At December 31, 2021, the REIT was in compliance with all covenants pursuant to its credit facility
agreements.
The development focus of the REIT is currently on the GTA, where capitalization rates are at historic lows, and in the
GMA, where the market remains significantly undersupplied.
INVESTMENTS IN DEVELOPMENT
The REIT continued to expand its pipeline of development projects in the GTA during 2021 and into 2022, with
completed acquisitions of five development sites totalling approximately 62 acres with the potential to add
approximately 1.2 million square feet of GLA to the portfolio. At February 16, 2022, the REIT has completed the
acquisition of the five development sites, as follows:
Acquired a 12.7‐acre development site in Burlington, Ontario, for $28.0 million on May 25, 2021. This
development site has the potential to build a 243,828 square foot light industrial building.
Acquired a 50% interest in a 5.3‐acre land parcel from its joint venture partner on July 15, 2021 for a purchase
price of $1.5 million, with the potential to construct a 91,782 square foot light industrial building in Guelph,
Ontario. This project is treated as an equity accounted joint venture in the REIT’s Financial Statements and is
currently under construction.
Acquired a 50% interest in a 11.1‐acre land parcel from its joint venture partner on November 5, 2021 for a
purchase price of $3.1 million, with the potential to construct a 206,000 square foot light industrial building in
Guelph, Ontario. This project is treated as an equity accounted joint venture in the REIT’s Financial Statements.
Acquired a 12‐acre parcel of land on January 20, 2022 for a purchase price of $27.5 million, with the potential
to construct a 180,000 square foot light industrial building, located at the intersection of Appleby Line and
Highway 407 in Burlington, Ontario.
Acquired a 50% interest in a 19.5‐acre development site in Kitchener, Ontario, on February 3, 2022, for a
purchase price of $5.5 million. This project will be completed with the REIT’s joint venture partner and has the
potential to develop a 360,000 square foot building.
7 | DEVELOPMENT AND EXPANSION 22SUMMIT INDUSTRIAL INCOME REIT
Management’s Discussion and Analysis 2021 – Annual
EQUITY ACCOUNTED JOINT VENTURES
In addition to its wholly‐owned development projects, the REIT engages in joint venture development projects with
third‐party developers, which it accounts for under the equity method. Under these joint venture arrangements, the
REIT has the right of first refusal to acquire at fair value the remaining 50% interest in any buildings being developed
over time as they are completed and leased.
At December 31, 2021, the REIT had an equity interest in four buildings in various stages of development, which will
total 739,703 square feet on completion at 100% ownership. Further details are included in the tables below.
On January 17, 2022, the REIT completed the acquisition of the remaining 50% interest in two recently constructed
properties at 65 & 75 Quarterman Road in Guelph, Ontario (Site J1 and J2) totalling 441,921 sq. ft. from the REIT’s joint
venture partner for a purchase price of $54.9 million. When combined with its existing ownership interest in the
properties, the REIT's total investment is approximately $84.6 million, generating a consolidated cap rate of
approximately 4.7%.
CURRENT DEVELOPMENT AND EXPANSION PROJECTS
The following tables summarize the REIT’s development pipeline at December 31, 2021:
No. of Total Total Costs Incurred Est. Remaining
Buildings Planned GLA Est. Costs to Date Costs to Complete
Inves tment properti es under devel opment 7 690 $ 155,885 $ 60,463 $ 95,422
(1)
Equi ty a ccounted joi nt ventures 4 740 24,444 21,386 3,058
Total 11 1,430 $ 180,329 $ 81,849 $ 98,480
(1)
Total planned GLA represents 100% of the planned GLA as the REIT expects to acquire the remaining 50% interest in the properties on completion. Total costs disclosed
for equity accounted joint ventures represent the REIT's expected and incurred equity and mezzaning financing contributions to fund the development projects.
Estimated project costs include land costs, soft and hard construction costs, external leasing costs, tenant inducements,
construction and development management fees, as well as capitalized interest or other borrowing costs, capitalized
development employee compensation and other expenses, but are net of any of estimated cost recoveries. Total costs
disclosed for equity accounted joint ventures represent the REIT’s expected equity and mezzanine financing
contributions to fund the development projects. Total estimated costs are based on the REIT’s best estimates and are
subject to change.
7 | DEVELOPMENT AND EXPANSION 23SUMMIT INDUSTRIAL INCOME REIT
Management’s Discussion and Analysis 2021 – Annual
The following table summarizes the REIT’s development projects at December 31, 2021:
Total No. of Total REIT
Project City Acres(1) Buildings Planned GLA Ownership Type
ONTARIO
(2)
Site J1 a nd J2, 65 & 75 Qua rterma n Roa d Guelph 26.2 2 442 50% Greenfi el d
(2)
Site C, 54 Phel a n Court Guelph 5.3 1 92 50% Greenfi el d
(2)
Site P, 30 Hanl on Creek Boul eva rd Guelph 11.1 1 206 50% Greenfi el d
4216 South Servi ce Road Burl ington 12.7 2 244 100% Greenfi el d
4225 North Service Road Burl ington 7.5 2 148 100% Redevel opment
2445 Surveyor Roa d Mi s s i s s auga 4.9 1 93 100% Redevel opment
5900 14th Avenue Ma rkha m 3.0 1 62 100% Expa ns i on
Total Ontario 70.7 10 1,287
QUEBEC
7101 Notre Da me Street, Eas t Montreal 6.6 1 143 100% Redevel opment
Total Quebec 6.6 1 143
Total 77.3 11 1,430
(1)
In the case of redevelopment / expansion projects, total acres represents the amount of excess land upon which the property is being developed.
(2)
This development project is accounted for as an equity accounted joint venture. Total acreage and planned GLA represents 100% of total acreage and planned GLA as
the REIT expects to acquire the remaining 50% interest in the property on completion.
The following table summarizes the REIT’s current development projects by building stage:
No. of Total Pre‐Leased
Buildings Planned GLA (%)
UNDER CONSTRUCTION
Ontari o 6 775 76%
Quebec ‐ ‐ ‐
Total Under Construction 6 775 76%
PLANNING AND PERMITTING STAGE
Ontari o 4 512 0%
Quebec 1 143 0%
Total Planning and Permitting Stage 5 655 0%
Total Ontario 10 1,287 46%
Total Quebec 1 143 0%
Total 11 1,430 41%
PORTFOLIO INTENSIFICATION POTENTIAL
While land prices continue to rise due to record‐low availability rates in the GTA and GMA, the REIT continues to
monitor its portfolio for potential intensification opportunities as part of its development program. The following table
outlines the REIT’s estimated intensification potential of its existing portfolio at December 31, 2021, excluding any of
the projects already discussed above.
Future Potential Incremental Density
Current Expansion Redevelopment
GLA Acres Site Coverage GLA GLA
Ontari o 10,275 590 40.5% 712 82
Quebec 4,583 249 41.1% 564 ‐
Al berta 5,751 434 27.5% 485 3,141
Other Cana da 42 3 39.2% ‐ ‐
Total 20,651 1,276 36.2% 1,761 3,223
7 | DEVELOPMENT AND EXPANSION 24SUMMIT INDUSTRIAL INCOME REIT
Management’s Discussion and Analysis 2021 – Annual
MEZZANINE FINANCING
Total loans receivable, including accrued interest, for the periods presented were as follows:
December 31 December 31
Financing City Province 2021 2020
Promi s s ory Note, DC2 Ri chmond Hi l l Onta ri o $ ‐ $ 24,095
Mezza ni ne Loan, 544 de l 'Ins pecteur Montreal Quebec 26,011 23,639
Mezza ni ne Loan, Devel opment Projects Guel ph Onta ri o 12,954 ‐
Total $ 38,965 $ 47,734
DC2, Richmond Hill, Ontario
The REIT provided mezzanine financing to a third‐party developer for the construction of a 95,000 square foot single‐
storey data centre. The mezzanine loan had purchase rights, entitling the REIT to convert the loan to equity upon
project completion.
In May 2020, the REIT sold its underlying interest in DC2, which resulted in the repayment of the outstanding balance
of the mezzanine loan of $5.5 million, including accrued interest. The proceeds from the sale were in the form of a
promissory note, which was to be repaid in stages over a period of 12‐15 months as construction on the data centre
was complete. In 2021, construction on the data centre was completed and the REIT received deferred proceeds of
$28.8 million from the sale, which resulted in the recognition of an additional gain on sale of $4.7 million (2020 ‐ $21.0
million), which is included in the fair value adjustments to loans receivable in the Financial Statements, and the
derecognition of the $24.1 million outstanding promissory note.
544 de l’Inspecteur, Montreal, Quebec
The REIT has extended mezzanine loan financing to its joint venture partner, a third‐party developer, for the
development of a 266,000 square foot multi‐storey data centre in Montreal, Quebec. The mezzanine loan has purchase
rights, entitling the REIT to convert the loan to equity upon project completion and lease‐up.
Development Projects, Guelph, Ontario
As part of the acquisition of the Site C and Site P development sites in Guelph, Ontario, the REIT entered into mezzanine
loan agreements to fund ongoing development costs for these development projects.
7 | DEVELOPMENT AND EXPANSION 25SUMMIT INDUSTRIAL INCOME REIT
Management’s Discussion and Analysis 2021 – Annual
8 | OPERATIONS
OCCUPANCY
The REIT works diligently to maximize occupancy throughout its portfolio by leveraging its marketing and leasing
expertise in its target markets (see Leasing section). The following tables outlines the REIT’s total portfolio occupancy
for the periods presented:
At December 31, 2021, occupancy in the REIT’s portfolio remained strong at 99.2%, with nearly full occupancy in
Ontario and full occupancy in Quebec. Occupancy in Alberta continued to improve from 94.6% at December 31, 2020
to 97.4% at December 31, 2021, largely due to successful leasing efforts in Edmonton, which improved occupancy from
91.1% at December 31, 2020 to 97.4% at December 31, 2021. The following tables outlines the REIT’s occupancy by
region for the periods presented:
At December 31, 2021, the REIT had 159,570 square feet of vacant space, with lease commitments in place for 97,878
square feet (61.3%) of vacancy.
8 | OPERATIONS 26SUMMIT INDUSTRIAL INCOME REIT
Management’s Discussion and Analysis 2021 – Annual
LEASING
Lease Maturity Schedule
The following table represents the expected lease maturity schedule at December 31, 2021 for the investment property
portfolio:
2022 2023 2024 2025 2026 Thereafter Total
ONTARIO
Occupi ed GLA 611 1,600 1,439 1,624 481 4,513 10,268
Avera ge i n‐pl a ce rent (ps f) $ 7.21 $ 7.40 $ 6.54 $ 6.70 $ 6.98 $ 7.64 $ 7.24
GLA (%) 6.0% 15.6% 14.0% 15.8% 4.7% 44.0% 100.0%
QUEBEC
Occupi ed GLA 462 499 342 351 318 2,611 4,583
Avera ge i n‐pl a ce rent (ps f) $ 6.59 $ 6.41 $ 7.40 $ 6.88 $ 6.49 $ 8.17 $ 7.55
GLA (%) 10.1% 10.9% 7.5% 7.7% 6.9% 57.0% 100.0%
ALBERTA
Occupi ed GLA 501 734 421 1,007 295 2,641 5,599
Avera ge i n‐pl a ce rent (ps f) $ 8.70 $ 8.34 $ 8.88 $ 7.81 $ 11.63 $ 9.91 $ 9.23
GLA (%) 8.9% 13.1% 7.5% 18.0% 5.3% 47.2% 100.0%
OTHER CANADA
Occupi ed GLA - - - - - 42 42
Avera ge i n‐pl a ce rent (ps f) - - - - - $ 9.42 $ 9.42
GLA (%) - - - - - 100.0% 100.0%
TOTAL PORTFOLIO
Occupied GLA 1,574 2,833 2,202 2,982 1,094 9,807 20,492
Average in‐place rent (psf) $ 7.50 $ 7.47 $ 7.12 $ 7.10 $ 8.09 $ 8.40 $ 7.86
GLA (%) 7.7% 13.8% 10.7% 14.6% 5.3% 47.9% 100.0%
Lease Maturities
At December 31, 2021, the REIT’s portfolio occupancy was 99.2% with a weighted average lease term of approximately
5.4 years.
8 | OPERATIONS 27SUMMIT INDUSTRIAL INCOME REIT
Management’s Discussion and Analysis 2021 – Annual
Lease Renewals and New Deals
During 2021, the REIT successfully completed the following renewal leasing activity for leases that commenced in 2021
and beyond:
(1)
Renewals Contractual Renewals Total
Rental rate Rental rate Rental rate
GLA growth (%) GLA growth (%) GLA growth (%)
Onta ri o 561 67.9% 221 0.0% 782 51.0%
Quebec 302 29.5% ‐ ‐ 302 29.5%
Al berta 206 ‐9.7% ‐ ‐ 206 ‐9.7%
Other Ca na da ‐ ‐ ‐ ‐ ‐ ‐
Total 2021 renewals 1,069 37.3% 221 0.0% 1,290 32.2%
(1)
Contractual renewals are based on respective lease terms.
The renewals completed during 2021 generated an average increase in rents of 32.2% over the expiring rent with a
significant 67.9% increase over expiring rents in Ontario (excluding contractual renewals) and a 29.5% increase in
Quebec, at a strong retention rate of 74.3%.
During 2021, the REIT successfully completed the following new deals for leases that commenced in 2021:
Rental rate
GLA growth (%)
Onta ri o 215 65.5%
Quebec ‐ ‐
Al berta 454 ‐9.6%
Other Ca na da ‐ ‐
Total 2021 new leases, before exclusions 669 10.9%
2021 new l ea s es on s pa ce va ca nt for grea ter tha n 24 months a nd new devel opments 183 ‐
Total 2021 new leases 852 ‐
(1)
The REIT entered into new leases on 183,000 sq. ft. of space that was vacant for greater than 24 months for which rental rate growth is not meaningful.
The approximately 852,000 sq. ft. of vacant space that was leased during 2021 carried an average lease term of 8.9
years.
The following table outlines the blended growth in rental rates from renewals and new lease deals that were completed
during 2021:
Renewals and New Leases Contractual Renewals Total
Rental rate Rental rate Rental rate
GLA growth (%) GLA growth (%) GLA growth (%)
Onta ri o 776 67.3% 221 0.0% 997 53.8%
Quebec 302 29.5% ‐ ‐ 302 29.5%
Al berta 660 ‐9.6% ‐ ‐ 660 ‐9.6%
Other Ca na da ‐ ‐ ‐ ‐ ‐ ‐
Total 2021 leasing, before exclusions 1,738 27.9% 221 0.0% 1,959 25.4%
2021 new l ea s es on s pa ce va ca nt for grea ter tha n 24 months a nd new devel opments 183 ‐
Total 2021 leasing 2,142 ‐
8 | OPERATIONS 28SUMMIT INDUSTRIAL INCOME REIT
Management’s Discussion and Analysis 2021 – Annual
RENTAL RATES
Average in‐place base rental revenue is contractual base rent and excludes recoverable expense revenue and impact
of lease incentives. The following table outlines the average in‐place base rental revenue per square foot by region and
building type for the REIT’s investment property portfolio at December 31, 2021:
ONTARIO QUEBEC ALBERTA OTHER CANADA TOTAL
% of Avg. rent % of Avg. rent % of Avg. rent % of Avg. rent % of Avg. rent
Building type GLA Total GLA (psf) GLA Total GLA (psf) GLA Total GLA (psf) GLA Total GLA (psf) GLA Total GLA (psf)
Warehouse 4,489 44% $ 6.81 2,457 54% $ 8.20 1,730 31% $ 11.44 - - - 8,676 42% $ 8.13
Distribution 3,961 39% 6.65 1,736 38% 6.39 3,398 61% 6.95 42 100% $ 9.42 9,137 45% 6.72
Light Manufacturing 763 7% 5.87 138 3% 7.14 131 2% 10.40 - - - 1,032 5% 6.61
Cold Storage 506 5% 10.88 - - - - 0% - - - - 506 2% 10.88
Cross-Dock 130 1% 17.29 - - - 267 5% 22.62 - - - 397 2% 20.87
Flex & Office 419 4% 12.52 252 6% 9.35 73 1% 12.02 - - - 744 4% 11.40
Total 10,268 100% $ 7.24 4,583 100% $ 7.55 5,599 100% $ 9.23 42 100% $ 9.42 20,492 100% $ 7.86
% of Total GLA 50.1% 22.4% 27.3% 0.2% 100.0%
8 | OPERATIONS 29SUMMIT INDUSTRIAL INCOME REIT
Management’s Discussion and Analysis 2021 – Annual
TENANTS
At December 31, 2021, the REIT’s tenant base is comprised of 292 tenants, primarily in distribution and warehousing
space, with over 84% of base rental revenue generated from international and national corporate tenants, with the
balance from regional, local and government tenants.
The following table outlines details of the REIT’s top 10 tenants at December 31, 2021:
No. of % of Base
Tenant Province(s) Locations Rental Revenue
Atallah Group Quebec 1 3.8%
Amazon Canada Alberta 1 2.5%
Kuehne + Nagel Quebec, Alberta 2 2.3%
Maple Leaf Foods Ontario 1 2.2%
Pival International Ontario 2 2.2%
Her Majesty The Queen Ontario, Quebec, Alberta 5 2.1%
Impact Auto Auctions Alberta 1 1.9%
Avon Canada Quebec 1 1.8%
FedEx Ontario, Alberta 3 1.8%
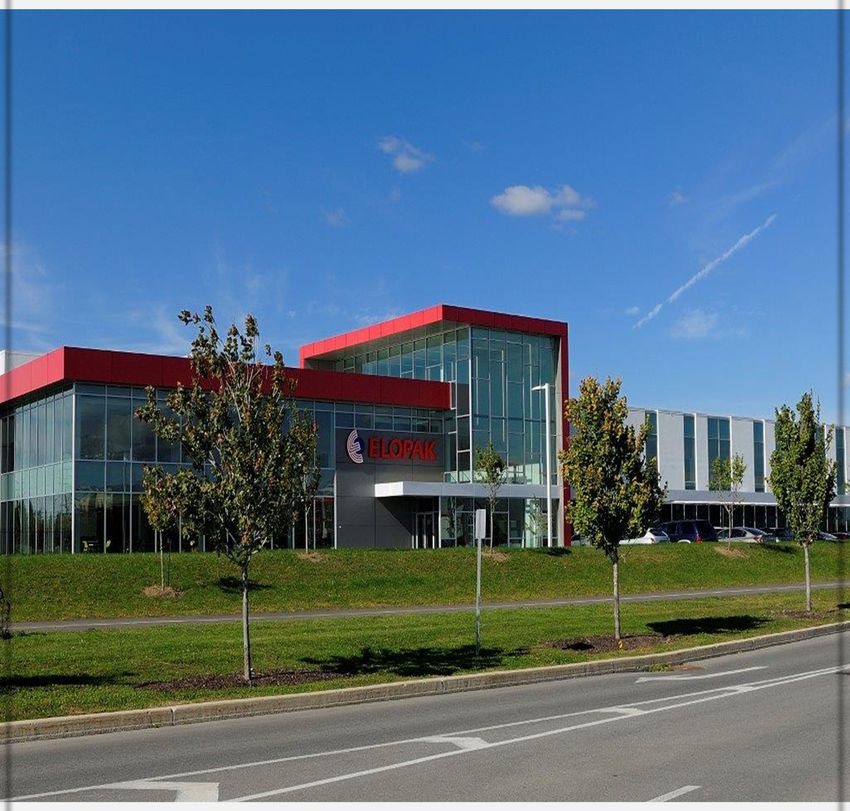
Elopak Canada Quebec 1 1.8%
Total 22.3%
The following table outlines further details of the REIT’s tenant composition at December 31, 2021:
No. of % of Base
Tenant Size Range (GLA) Tenants Rental Revenue
Over 100,000 71 60.1%
50,000 ‐ 100,000 42 16.3%
15,000 ‐ 50,000 93 16.7%
Less than 15,000 86 6.9%
Total 292 100.0%
The REIT’s average tenant size was approximately 71,000 square feet at December 31, 2021.
8 | OPERATIONS 30SUMMIT INDUSTRIAL INCOME REIT
Management’s Discussion and Analysis 2021 – Annual
9 | LIQUIDITY AND CAPITAL
LIQUIDITY
Available Liquidity*
The REIT continues to maintain a strong and flexible financial liquidity position. At December 31, 2021, the REIT’s
available liquidity* was approximately $1.1 billion (December 31, 2020 ‐ $0.5 billion), including cash, borrowing capacity
on its unsecured revolving credit facility and Green Unsecured Development Credit Facility, and potential for new
financing that could be placed on a portion of its $3.0 billion of unencumbered assets.
(1) Non‐GAAP Measure. Refer Appendix A | Non‐GAAP Measures for information and reconciliations.
(2) Assumes 55% LTV on unencumbered assets not required for unsecured debt compliance.
9 | LIQUIDITY AND CAPITAL 31You can also read