TAMIL NADU BLEND OF TRADITION AND TECHNOLOGY - February 2018 - IBEF

Page created by Corey Barton
 
CONTINUE READING
TAMIL NADU BLEND OF TRADITION AND TECHNOLOGY - February 2018 - IBEF
TAMIL NADU
 BLEND OF TRADITION AND TECHNOLOGY

For updated information, please visit www.ibef.org   February 2018
TAMIL NADU BLEND OF TRADITION AND TECHNOLOGY - February 2018 - IBEF
Table of Content

   Executive Summary……………….….…….3

   Advantage Tamil Nadu…………...….……..5

   Vision 2030……….…….……………..…….6

   Tamil Nadu – An Introduction……………..8

   Annual Budget 2017-18………….....……19

   Infrastructure Status..................................20

   Business Opportunities…….………..……41

   Doing Business in Tamil Nadu……...……76

   State Acts & Policies…….………......……77
TAMIL NADU BLEND OF TRADITION AND TECHNOLOGY - February 2018 - IBEF
EXECUTIVE SUMMARY … (1/2)

                                                   Gross state domestic product (GSDP) of Tamil Nadu grew at a CAGR of 11.16% between 2005-06 and 2016-
                                                    17, reaching US$ 207.79 billion in 2016-17.
      Strong growth in GSDP
                                                   Per capita GSDP of US$ 2,568.01 (at current prices) is nearly 1.82 times higher than the national average of
                                                    US$ 1,389.6

      Strong investment
                                                   The cumulative FDI inflows1 in the state during April 2000 to December 2017 amounted to US$ 26.52 billion.
      climate

                                                        Tamil Nadu has a diversified manufacturing sector and features among the leading states in several
                                                         industries like automobiles & components, engineering, pharma, garments & textile products, leather
                                                         products, chemicals & plastics, etc.
      Diversified industrial                            It ranks first among the states in terms of number of factories and industrial workers.
      base
                                                        Due to its achievements as an auto production hub, Chennai has been dubbed as the ‘Detroit of India’.

                                                        Due to its proximity with East Asian countries, Chennai is also endeavouring to become an international
                                                         finance hub.

                                                   IT exports1 from Tamil Nadu have increased from US$ 7.1 billion in 2007-08 to US$ 15.57 billion (E) in 2016-
                                                    17, registering a CAGR of 8.17%.
      Thriving services                            Chennai is a key financial centre in South India, with strong presence of major Indian financial institutions &
      sector                                        foreign banks. The World Bank has its back office in Chennai.

                                                   It has a thriving tourism sector & ranks 3rd in India in terms of number of domestic tourist arrivals & 2nd in
                                                    foreign tourist arrivals.

    Note: E - Expected
    Source: Central Statistics Office, Department of Industrial Policy and Promotion, 1Including Puducherry, News articles

3         TAMIL NADU                                                                                                         For updated information, please visit www.ibef.org
TAMIL NADU BLEND OF TRADITION AND TECHNOLOGY - February 2018 - IBEF
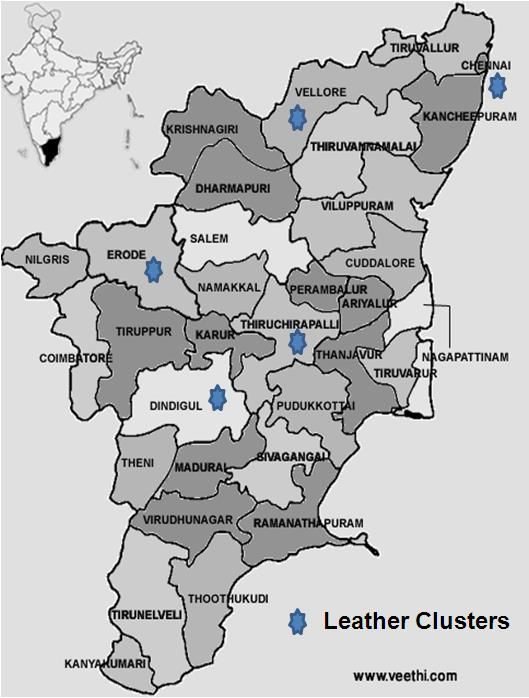
EXECUTIVE SUMMARY … (2/2)

                                                  It has well developed infrastructure with an excellent road and rail network, three major ports, 23 minor ports,
                                                   and seven airports across the state providing excellent connectivity.

                                                  In line with Vision 2023, it aims to step up infrastructure investment from 4-5% of GSDP to about 11.5% by
      Robust infrastructure                        2019.

                                                  Roads & highways, ports, railways, education and healthcare are likely to see major investments.

                                                  The state also plans to develop 2 industrial corridors – Chennai-Bengaluru & Madurai-Tuticorin.

      Strong human resource                       Tamil Nadu has 59 universities, 40 medical colleges, 517 engineering colleges, 447 polytechnics & 20 dental
      pool                                         colleges.

    Source: Ministry of Tourism, News article, 1Including Pondicherry

4         TAMIL NADU                                                                                          For updated information, please visit www.ibef.org
TAMIL NADU BLEND OF TRADITION AND TECHNOLOGY - February 2018 - IBEF
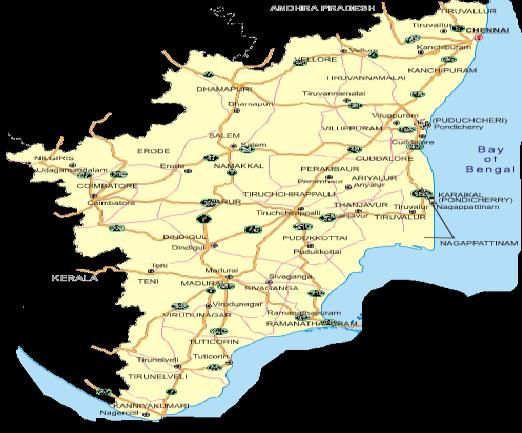
ADVANTAGE: TAMIL NADU

        2016-17                              High economic growth                                                      Rich talent pool                        2023 Target
                               Tamil Nadu’s GSDP grew at a CAGR of 11.80%                          The state has a highly qualified, skilled, disciplined,
       Per capita               between 2005-06 and 2016-17.                                         productivity-oriented and English-speaking human           Per capita
      GSDP: US$                The state recorded the fourth-largest GSDP among all                 resource pool.                                            GSDP: US$
       2,735.29                 states in India in 2014-15 (at current prices).                     Tamil Nadu produces nearly 4 lakh engineering &             10,000
                               The state’s exports totalled US$ 27.9 billion in 2014-15,            polytechnic students every year, the highest in the
                                grew at a CAGR of 4.7% between 2007-08 and 2014-                     country.
                                15.

                                                                                      Advantage
                                                                                      Tamil Nadu
                                                   Infrastructure                                                  Large industrial base
                               Tamil Nadu has well-developed social, physical and                  Tamil Nadu has a range of manufacturing industries
                                industrial infrastructure and virtual connectivity.                  such as automobiles & components, castings &
                               Excellent road and rail network, three major ports, 23               forgings, pumps & motors, garments & textile products,
                                minor ports and seven airports provide excellent                     leather products, chemicals & plastics.
                                connectivity.                                                       Tamil Nadu ranks first among all states in terms of the
                               It is one of the first states in India to have 100%                  number of factories and industrial workers.
                                metalled road connectivity.                                         India and China have agreed to develop Chennai-
                                                                                                     Chongqing as sister cities.

    Source: Ministry of Statistics and Programme Implementation, March 2015. Tamil Nadu Vision 2023 at 2010 Prices; News articles

5         TAMIL NADU                                                                                                    For updated information, please visit www.ibef.org
TAMIL NADU BLEND OF TRADITION AND TECHNOLOGY - February 2018 - IBEF
VISION 2023 … (1/2)

                                                             To nurture a culture of             To be India’s most
                                                             responsive and                        economically
                                                             transparent governance                prosperous state by
                                                             that ensures progress,                2023 and achieve six-
                                                             security and equal                    fold growth in per
                                                             opportunity to all                    capita income.
                                                             stakeholders.

                      To address the causes of                                                Growth                           To exhibit a highly inclusive
                                                                           Opportunity
                       vulnerability arising due to                                                                              growth pattern, leading to be
                       natural calamities and economic                                                                           a poverty free state with
                       downturns, among others, and                                                                              opportunities for gainful and
                                                               Reduce
                       mitigate their adverse effects.                                                                           productive employment.
                                                             vulnerability                              Opportunities
                                                                                   Vision 2023
                       To ensure peace, security and
                        prosperity for all citizens and     Trade & Heritage                            Development             To become the leading state
                        businesses, facilitating free trade                                                                      in social development, with
                        movement between the state, rest                                                                         the highest Human
                        of India & the world.                             Investment      Infrasturcture                         Development Index among all
                       To preserve and care for the                                                                             Indian states.
                        state’s ecology and heritage.

                                                    To become one of the top three           To provide the best infrastructure
                                                     preferred investment destinations         services in India in terms of access
                                                     in India and Asia.                        to housing, water & sanitation,
                                                    To be India’s innovation hub and          energy, transportation, irrigation,
                                                     knowledge capital.                        connectivity, healthcare and
                                                                                               education.

    Source: Government of Tamil Nadu

6        TAMIL NADU                                                                                            For updated information, please visit www.ibef.org
TAMIL NADU BLEND OF TRADITION AND TECHNOLOGY - February 2018 - IBEF
VISION 2023 … (2/2)

      The state targets attracting investments to the tune of US$ 248.84                                                Proposed investment
                                                                            Sector
       billion between 2012-2023. The summary of the proposed sectoral                                                       (US$ billion)
       investments as per the phase-II of Vision 23, released in February   Energy                                               64.59
       2014 is as follows:
                                                                            Transport                                            61.07

                                                                            Industrial and commercial infrastructure             28.41

                                                                            Urban infrastructure                                 43.69

                                                                            Agriculture                                          20.14

                                                                            Human development (health & education)               9.81

                                                                            Sub-total                                           227.71

                                                                            General and social infrastructure projects           12.44

                                                                            Capital improvements to existing projects            8.69

                                                                            Sub-total                                            21.13

                                                                            Grand total                                         248.84

    Source: Vision Tamil Nadu 2023

7        TAMIL NADU                                                                            For updated information, please visit www.ibef.org
TAMIL NADU BLEND OF TRADITION AND TECHNOLOGY - February 2018 - IBEF
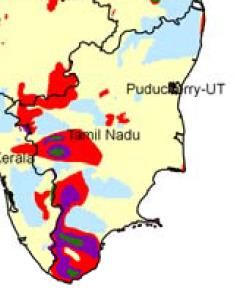
TAMIL NADU FACT FILE

                                                                                     Chennai, Coimbatore, Madurai, Thiruchirappalli, Salem, Tirunelveli
                                                                                      & Erode are some of the key cities in the state.

                                                                                     The climate ranges from dry sub-humid to semi-arid. Major rivers
                                                                                      flowing through the state include Palar, Cheyyar, Ponnaiyar, Kaveri,
                                                                                      Bhavani, Vaigai and Tamaraparani.

                                                                                    Parameters                                         Tamil Nadu

                                                                                    Capital                                              Chennai
                                                                                    Geographical area (sq km)                            130,058
                                                                                    Administrative districts (No)                           32
                                                            Source: Maps of India
                                                                                    Population density (persons per sq km)                 555
     Tamil Nadu is the southern-most Indian state, surrounded by Andhra            Total population (million)                            72.14
      Pradesh on the north, Karnataka & Kerala on the west, Indian Ocean
                                                                                    Male population (million)                             36.13
      on the south, and Bay of Bengal on the east.
                                                                                    Female population (million)                           36.00
     Tamil Nadu is among the most industrialised states in the country.
      Tamil is the state language; English is also commonly used for                Sex ratio (females per 1,000 males)                    996
      communication & as a medium of education.                                     Literacy rate (%)                                     80.09

    Source: Government of Tamil Nadu website, Census 2011

8      TAMIL NADU                                                                                       For updated information, please visit www.ibef.org
TAMIL NADU BLEND OF TRADITION AND TECHNOLOGY - February 2018 - IBEF
TAMIL NADU IN FIGURES … (1/2)

    Parameter                                     Tamil Nadu    All states      Source

    Economy                                        2016-17       2016-17

       GSDP as a percentage of all states’ GSDP      8.78         100.0         Central Statistics Office

       GSDP growth rate (%)                         10.40         11.52         Central Statistics Office

       Per capita GSDP (US$)                       2,735.29       1,611         Central Statistics Office

    Physical Infrastructure

       Installed power capacity (MW)              29,457.69     334,399.83      Central Electricity Authority, as of January 2018

                                                                                Telecom Regulatory Authority of India, as of
       Wireless subscribers (No)                  87,029,047   1,167,435,645
                                                                                December 2017
                                                                                Telecom Regulatory Authority of India, as of
       Internet subscribers (No)                  34,470,000   429,230,000
                                                                                September 2017
                                                                                NHAI & Road & Building Department, as of July
       National Highway length (km)                 5,381         115,435
                                                                                2017

       Major and minor ports (No)                   3 + 23        13 + 187      India Ports Association

       Airports (No)                                  7              125        Airports Authority of India

9      TAMIL NADU                                                              For updated information, please visit www.ibef.org
TAMIL NADU IN FIGURES … (2/2)

     Parameter                                                      Tamil Nadu                   All states              Source

     Social Indicators

        Literacy rate (%)                                               80.09                        73.0                Census 2011

        Birth rate (per 1,000 population)                                15.0                        20.4                SRS Bulletin

     Investments

                                                                                                                         Department of Industrial Policy & Promotion, From
        FDI equity inflows (US$ billion)                               26.521                      367.93
                                                                                                                         April 2000 to December 2017

     Industrial Infrastructure

                                                                                                                         DEA, Ministry of Finance, Government of India,
        PPP projects completed & operational                              67                        1,534
                                                                                                                         February 2018
                                                                                                                         Ministry of Commerce & Industry, Department of
        Exporting SEZs (no)                                               37                         222
                                                                                                                         Commerce, December 2017

 Note : Public Private Partnership, SEZ: Special Economic Zone, SRS: Sample Registration System, 1 Includes Puducheery

10      TAMIL NADU                                                                                                  For updated information, please visit www.ibef.org
ECONOMIC SNAPSHOT – GSDP

                                                                                                                GSDP of Tamil Nadu at current prices
      At current prices, Tamil Nadu’s GSDP* was about US$ 207.79
       billion in 2016-17.                                                                                                 (US$ billion)

      The GSDP of the state grew at a CAGR of 7.87% between 2011-                                 250.00
                                                                                                                                           CAGR 7.87%
       12 and 2016-17.
                                                                                                   200.00

                                                                                                                                                                             207.79
                                                                                                                                                                   185.25
                                                                                                   150.00

                                                                                                                                                         161.20
                                                                                                                  142.30

                                                                                                                                               141.70
                                                                                                                                 137.10
                                                                                                   100.00

                                                                                                    50.00

                                                                                                      0.00

                                                                                                                  2011-12

                                                                                                                                 2012-13

                                                                                                                                               2013-14

                                                                                                                                                         2014-15

                                                                                                                                                                   2015-16

                                                                                                                                                                             2016-17
 Source: Directorate of Economics & Statistics of Tamil Nadu, Central Statistics Office, GSDP* - Tamil Nadu Budget Speech 2016-17

11      TAMIL NADU                                                                                                          For updated information, please visit www.ibef.org
ECONOMIC SNAPSHOT – NSDP

      Tamil Nadu’s net state domestic product (NSDP)# was about US$                                                NSDP of Tamil Nadu at current prices
       185.26 billion in 2016-17.                                                                                              (US$ billion)

      NSDP of the state grew at a CAGR of 8.41% between 2011-12                                      200.00
       and 2016-17.                                                                                                                           CAGR 8.41%
                                                                                                      180.00

                                                                                                                                                                                185.26
                                                                                                      160.00

                                                                                                                                                                      165.05
                                                                                                                                                            161.20
                                                                                                      140.00

                                                                                                                                                  145.90
                                                                                                      120.00

                                                                                                                                    128.00
                                                                                                                     123.70
                                                                                                      100.00
                                                                                                        80.00
                                                                                                        60.00
                                                                                                        40.00
                                                                                                        20.00
                                                                                                         0.00

                                                                                                                     2011-12

                                                                                                                                    2012-13

                                                                                                                                                  2013-14

                                                                                                                                                            2014-15

                                                                                                                                                                      2015-16

                                                                                                                                                                                2016-17
 Source: Directorate of Economics & Statistics of Tamil Nadu, Central Statistics Office, NSDP# - calculated using per capita NSDP x Population in million

12      TAMIL NADU                                                                                                             For updated information, please visit www.ibef.org
ECONOMIC SNAPSHOT – PER CAPITA GSDP

      The state’s per capita GSDP was US$ 2,735.29 in 2016-17.                                         GSDP per capita of Tamil Nadu at current prices (US$)
      Per capita GSDP increased at a CAGR of 5.41% between 2011-
       12 and 2016-17.                                                                                 3,000.0
                                                                                                                                              CAGR 5.41%

                                                                                                                                                                                  2,735.3
                                                                                                       2,500.0

                                                                                                                                                                        2,568.0
                                                                                                                                                             2,339.9
                                                                                                       2,000.0

                                                                                                                       2,102.3

                                                                                                                                                   2,068.7
                                                                                                                                    2,013.7
                                                                                                       1,500.0

                                                                                                       1,000.0

                                                                                                         500.0

                                                                                                             -

                                                                                                                       2011-12

                                                                                                                                   2012-13

                                                                                                                                                   2013-14

                                                                                                                                                             2014-15

                                                                                                                                                                        2015-16

                                                                                                                                                                                  2016-17
 Source: Directorate of Economics & Statistics of Tamil Nadu, Central Statistics Office, Per Capita GSDP^ - calculated using GSDP million US$ / Population in million

13      TAMIL NADU                                                                                                           For updated information, please visit www.ibef.org
ECONOMIC SNAPSHOT – PER CAPITA NSDP

      The state’s per capita NSDP& was US$ 2,438.7 in 2016-17.                                        NSDP per capita of Tamil Nadu at current prices (US$)
      The per capita NSDP increased at a CAGR of 5.12% between
       2011-12 and 2016-17.                                                                          3,000.0
                                                                                                                                            CAGR 5.12%
                                                                                                     2,500.0

                                                                                                                                                                               2,438.7
                                                                                                                                                                     2,287.9
                                                                                                     2,000.0

                                                                                                                                                           2,118.0
                                                                                                                     1,900.0

                                                                                                                                                 1,869.0
                                                                                                                                  1,816.0
                                                                                                     1,500.0

                                                                                                     1,000.0

                                                                                                       500.0

                                                                                                           -

                                                                                                                     2011-12

                                                                                                                                 2012-13

                                                                                                                                                 2013-14

                                                                                                                                                           2014-15

                                                                                                                                                                     2015-16

                                                                                                                                                                               2016-17
 Source: Directorate of Economics & Statistics of Tamil Nadu, Central Statistics Office, Per capita NSDP & - Geometric mean of YoY calculation from 2004-05 to 2014-15

14      TAMIL NADU                                                                                                         For updated information, please visit www.ibef.org
ECONOMIC SNAPSHOT – PERCENTAGE
                  DISTRIBUTION OF GSVA

      In 2016-17, the tertiary sector contributed 55.82 % to the state’s           Visakhapatnam
                                                                                         Percentageport
                                                                                                    distribution
                                                                                                        traffic (million
                                                                                                                  of GSVAtonnes)
       GSVA at current prices, followed by the secondary sector at 31.71%.

      The tertiary sector grew at an average rate of 13.35% between 2011-   100%
       12 and 2016-17, driven by trade, hotels, real estate, finance,                        50.48%                      55.82%
                                                                                                           CAGR
       insurance, transport, communications & other services.                90%

      The secondary sector grew at an average rate of 8.07% between         80%
       2011-12 & 2016-17, mainly driven by manufacturing & construction
                                                                                                           13.35%
       sectors.                                                              70%

      The primary sector grew at an average rate of 9.94% between 2011-     60%
       12 & 2016-17.
                                                                             50%
                                                                                             36.39%
                                                                                                           8.07%
                                                                             40%                                         31.71%

                                                                             30%

                                                                             20%
                                                                                                           9.94%
                                                                             10%             13.13%                      12.47%

                                                                              0%
                                                                                             2011-12                    2016-17

                                                                                              Primary   Secondary   Tertiary

 Source: Ministry of Statistics and Programme Implementation

15      TAMIL NADU                                                                        For updated information, please visit www.ibef.org
ECONOMIC SNAPSHOT – AGRICULTURAL
                  PRODUCTION

      Tamil Nadu is one of the leading producers of bananas, flowers,                                                          Annual production in 2016-17 (‘000
                                                                                            Crop
       tapioca, mango, coconut, groundnut, coffee, tea & sugarcane.                                                                         tonnes)

      Rice production in the state stood at 4.04 million tonnes during 2016-                Fruits                                           6,079.75
       17.                                                                                   Vegetables                                       6,304.84
      In 2016-17, total production of food grains was recorded to be 6.22                   Coconut
                                                                                                          2
                                                                                                                                              4,247.12
       million tonnes.
                                                                                             Flowers                                          416.63
      Onion production in the state reached 380.95 thousand tonnes in
       2016-17 whereas the production of potato in the state reached 72.23                   Aromatic and Medicinal                           192.54
       thousand tonnes during 2016-17.                                                                3
                                                                                             Cotton                                             350
      In December 2017, MASHAV - Israel’s Agency for International                          Tomato                                            645.7
       Development Cooperation, has come up with a three year action                      Source: Ministry of Agriculture

       plan for the Indo-Israeli Agriculture Project (IIAP) till 2018.                       Spices                                           192.50

      In March 2017, a special scheme for development of rainfed                            Plantation crops                                 4,176.33
       agriculture was coined by the Chief Minister as a part of the                         Honey                                              1.52
       measures to improve agriculture. Under the scheme, 10,000
       hectares of rainfed area will be developed over a period of four years
       at an estimated cost of US$119.44 million.

 Note: Million nuts, 2Includes pepper, 33000’ bales (170 kg each),
 Source: 2nd Advance Estimates, Department of Agriculture Cooperation & Farmers Welfare

16      TAMIL NADU                                                                                                  For updated information, please visit www.ibef.org
ECONOMIC SNAPSHOT – FDI INFLOWS &
                       INVESTMENTS

       According to the DIPP, cumulative FDI inflows1 in Tamil Nadu during
                                                                                                  FDI equity inflows, 2008-09 to 2017-18* (US$ million)1
        April 2000 to December 2017 stood at US$ 26.52 billion.

       During the financial year 2016-17, the state ranked 3rd in terms of
                                                                                                 5,000
        actual FDI inflow in the country. The total FDI inflow in the state                      4,500
                                                                                                 4,000

                                                                                                                                                                                      4,528
        stood at US$ 2.21 billion during this period. Mumbai & Delhi stood at                    3,500

                                                                                                                                                                            3,818
        1st & 2nd position with inflow of US$ 19.65 billion and US$ 5.88                         3,000
                                                                                                 2,500

                                                                                                                                                        2,807

                                                                                                                                                                                                           2,756
        billion respectively.                                                                    2,000

                                                                                                                                                                                                2,218
                                                                                                                             1,123

                                                                                                                                                                  2,116
                                                                                                 1,500

                                                                                                         1,724
                                                                                                                   774
       The FDI inflow between April-December 2017 amounted to US$ 2.76

                                                                                                                                        2011-12 1,422
                                                                                                 1,000
                                                                                                   500
        billion for the state of Tamil Nadu.                                                        -

                                                                                                                                                                                                           2017-18*
                                                                                                         2008-09

                                                                                                                   2009-10

                                                                                                                              2010-11

                                                                                                                                                        2012-13

                                                                                                                                                                  2013-14

                                                                                                                                                                            2014-15

                                                                                                                                                                                                2016-17
                                                                                                                                                                                      2015-16
       In January 2016, the state’s Chief Minister launched 14 new projects
        worth US$ 1.47 billion, with major investments flowing in for energy
        sector & industrial sector.
                                                                                                                                                              Note: 1Including Pondicherry
       In January 2017, the state government stated that 62 MoUs worth                                                                 Source: Department of Industrial Policy & Promotion

        US$ 9.40 billion, out of 98 MoUs, which were signed during Global                     Urban development projects- As of March 2015
        Investors Meet (GIM) in 2015, have been implemented.

       In April 2017, the Japan International Cooperation Agency (JICA)                        Projects sanctioned                                                                                       65
        decided to provide a loan of US$199.36 million for the second phase                     Number of projects completed                                                                              24
        of Tamil Nadu Investment Promotion Programme, which aims to
        boost the investment opportunities in the state.

     Note: * - data from April-December 2017, 1Including Pondicherry
     Source: Directorate of Economics & Statistics of Tamil Nadu, Central Statistics Office

17        TAMIL NADU                                                                                               For updated information, please visit www.ibef.org
ECONOMIC SNAPSHOT – EXPORT TRENDS

      Tamil Nadu is a major exporter of a variety of goods such as                       Exports from Tamil Nadu (US$ billion)
       automobiles, auto components, black granite, engineering goods,
       textiles, garments, tobacco, handicrafts, yarn, spices, coffee, tea &
                                                                               40.00
       leather products.                                                                                              CAGR 4.7%
                                                                               35.00
      Tirupur and Erode are the country's largest exporters of knitwear.

                                                                                                                                                        35.90
                                                                                                                                    35.20

                                                                                                                                              33.20
       The state’s total knitwear exports reached a total of US$ 7.81          30.00
       billion during the period of April 1, 2016 to February 28, 2017.

                                                                                                                                                                  27.90
                                                                               25.00

                                                                                                                          27.60
                                                                                                  27.00

                                                                                                            25.30
      Application software accounts for a majority share in the software      20.00

                                                                                       20.20
       exports from Tamil Nadu. Over the last 3 years software exports         15.00
       from the state have grown phenomenally.
                                                                               10.00
      Exports of floriculture products from the state were recorded to be
                                                                                5.00
       US$ 21.21 million during 2017-18 (April-October) whereas value
                                                                                0.00
       exports of fruits and vegetables seeds reached US$ 0.53 million,

                                                                                       2007-08

                                                                                                  2008-09

                                                                                                            2009-10

                                                                                                                          2010-11

                                                                                                                                    2011-12

                                                                                                                                              2012-13

                                                                                                                                                        2013-14

                                                                                                                                                                  2014-15
       during the same period. Moreover, exports of pulses from the state
       were recorded at around US$ 5.67 million during 2017-18 (April-
       October).

 Source: Tamil Nadu Industrial Policy, Economic, Ministry of Commerce, APEDA

18      TAMIL NADU                                                                               For updated information, please visit www.ibef.org
ANNUAL BUDGET 2017-18

                                                                                                             Budget allocation
                                     Major heads of development
                                                                                                               (US$ million)
                                                Agriculture                                                       1,765.32

                                           Rural Development                                                      722.65

                                       Irrigation and Flood Control                                               218.19

                                                  Energy                                                          1,428.13

                                         Industry and Minerals                                                    487.45

                                                Transport                                                         279.65

                                Science, Technology and Environment                                                  2

                                  Education, Sports, Arts and Culture                                             4,873.51

                                       Health and Family Welfare                                                  1,454.35

                      Water Supply, Sanitation, Housing & Urban Development                                       798.16

                                     Information and Broadcasting                                                  11.92

           Welfare of Scheduled Castes, Scheduled Tribes and Other Backward Classes                               652.74

                                      Labour and Labour Welfare                                                    88.23

                                      Social Welfare and Nutrition                                                1939.60

      In March 2017, Finance Minister of Tamil Nadu presented a tax-free budget for the year 2017-18. The revenue deficit for 2017-18 has been
       proposed at US$ 2.47 billion and the total expenditure is expected at US$ 27.21 billion.

 Source: Government of Tamil Nadu, Finance Department

19      TAMIL NADU                                                                            For updated information, please visit www.ibef.org
PHYSICAL INFRASTRUCTURE – ROADS … (1/2)

                                                                                               Under the Comprehensive Road Infrastructure Development
                                                                                                Programme, the Government of Tamil Nadu invested US$ 40.69
                                                                                                million for the development of the road network in the state. Tamil
                                                                                                Nadu Vision 2023 envisages an investment of US$ 27.7 billion1 for
                                                                                                improving highways. Chennai is slated to get 17 new projects worth
                                                                                                US$ 334.8 million.

                                                                                                                         Work                                   Length (km)

                                                                                              Four laning of Gobi-Erode section                                     30.60

                                                                                              Four laning of Oddanchatram - Dharapuram-
                                                                                                                                                                    68.92
                                                                   Source: Maps of India      Tirupur section

                                                                                              Four laning of Tirunelveli –
      Tamil Nadu has 28 national highways running through it. It is an                                                                                             45.60
                                                                                              Tenkasi section
       important terminus in the Golden Quadrilateral road link of NHAI.
       District centres are linked via 187 state highways.
      The state government has laid the foundation for construction of a                    Category of Roads                                     Length (km) (2017)
       total of 3971 new buildings. In Salem 462 buildings worth US$17.21
       million, in Namakkal 1,479 buildings worth US$9.11 million, in
       Dharmapuri 113 buildings worth US$8.97 million & in Krishnagiri                       National highways (NH)^                                       5,381
       1,917 buildings worth US$13.91 million will be constructed.
                                                                                             Total length of roads network                                193,918
      As per the 2017-18 budget, an amount of US$ 1.61 billion has been
       allocated to the Highways department. The Government will
       undertake construction of bridges with NABARD assistance worth
       US$ 32 million during 2017-18.

 Note: ^ - June 2017
 Source: Ministry of Road Transport & Highways, Government of Tamil Nadu, Tamil Nadu Policy Note on Roads, Bridges, Vision 2023, 1At 2011-12 rates, News articles

20      TAMIL NADU                                                                                                  For updated information, please visit www.ibef.org
PHYSICAL INFRASTRUCTURE – ROADS…(2/2)

     Highways:

      In 2015-16, the state government has taken up the work on construction of phase II of Tamil Nadu Road Sector Project with the assistance of
       World Bank at an estimated amount of US$ 802.61 million. As per budget 2017-18, the state government allocated US$ 234.06 million for this
       project during 2017-18.

      As per the state budget, the work in progress of various projects being undertaken by the state government during 2016-17 includes:

        •   At a cost of US$ 32.64 million, Four lane Outer Ring Road for Madhurai is at its tender finalization stage.

        •   The Oragadam Industrial Corridor Project and four laning of East Coast Road, at a cost of US$ 146.85 million and US$ 47.99 million,
            respectively, are under progress.

      As per the state budget 2017-18, an allocation of US$ 1.56 billion has been made by the state government for the highways department.

      Investment of US$ 3.20 million is planned to be made by the Government of Tamil Nadu on Chennai Port-Maduravoyal Elevated Expressway
       project, to improve the condition of the expressway.

      In April 2017, Reliance Infrastructure Ltd. bagged the NHAI project for the construction of Vikkaravandi to Sethiyahopu section of NH-45C in Tamil
       Nadu. The project is to be completed in a duration of 24 months at a cost of US$105.76 million.

      Length of National Highways constructed in the current year as on 31st Dec in 2017-18 is 180.73 kms.

 Source: State Interim Budget 2016-17

21      TAMIL NADU                                                                                      For updated information, please visit www.ibef.org
PHYSICAL INFRASTRUCTURE – RAILWAYS

                                                                                A stretch of 21 km out of the 45 km under 1st phase of the Chennai
                                                                                 metro rail project is already operational. Till March 2016, the state
                                                                                 government released a sum of US$ 596.97 million for this project. In
                                                                                 the 2015-16 budget, the state government announced plans to
                                                                                 invest US$ 157.73 million for the completion of this project.
                                                                                In order to assimilate various modes of transport at Central Railway
                                                                                 Station of Chennai, a financial support of US$ 59.48 million has
                                                                                 been provided by Chennai Metropolitan Development Authority
                                                                                 during 2015-16.
                                                                                During 2015-16, the state government constructed 15 RUBs &
                                                                                 ROBs under the Railway Works Programme at a total cost of US$
                                                                                 170.62 million.
                                                                                Metro underground prostretch, between Nehru Park                     &
                                                                                 Thirumangalam, has been operational in the state of Tamil Nadu

      Tamil Nadu’s railway network falls under the jurisdiction of Southern
       Railways, which covers Tamil Nadu, Kerala, Puducherry & a small
       part of Andhra Pradesh. It has 6 divisions, 4 of which are in Tamil                                                            Investment
       Nadu (Chennai, Tiruchirappalli, Madurai & Salem). Coimbatore is         Work
                                                                                                                                   (in US$ million)
       also a key railway junction. Tamil Nadu presently has a 4,181 km rail
       network, with 690 railway stations. Chennai has a well-established      Madurai – Pudukottai – Tuticorin                         248.83
       suburban railway network connecting it to the suburbs &
       neighbouring cities.                                                    Avadi – Sriperumbudur                                    119.42
      Mass-Rapid-Transit System (MRTS) is an elevated line of the             Chennai (Perungudi) –
       suburban railway in Chennai. It runs from the Chennai beach junction    Mahabalipuram – Pudhucherry– Cuddalore                   323.50
       to the Velachery suburb, covering a distance of 25 km over 21
       stations. It is operated by the Southern Railways.

 Note: RUB: Railway Under Bridges; ROB: Railway Over Bridges
 Source: Tamil Nadu Vision 2023, Ministry of External Affairs,

22      TAMIL NADU                                                                               For updated information, please visit www.ibef.org
PHYSICAL INFRASTRUCTURE – AIRPORTS

                                                                                Tamil Nadu airport statistics (2016-17)
      Tamil Nadu has international airports at Chennai, Coimbatore &
       Trichy; it has domestic airports at Tuticorin, Salem, Vellore (non-
                                                                                 Airport               Passenger (nos)         Aircraft movement (nos)
       operational) & Madurai. The Chennai International Airport was the 1st
       in the country to get ISO 9001-2000 certification. In 2016-17,                                     18,362,215
                                                                                 Chennai                                               147,767
       movement of passengers at Chennai Airport increased by 20.66%.
                                                                                 Coimbatore                2,104,904                    20,722
      Tamil Nadu Vision 2023 envisages an investment of US$ 5.2 billion1
                                                                                                                                        11,671
       for developing a greenfield airport near Chennai & upgrading other        Madurai                    978,919
       airports.
                                                                                 Trichy                    1,359,447                     11,65
      Construction work on a new passenger terminal at the Chennai International Airport has been completed. The terminal would have a capacity of 10
       million passengers. Electronic Data Interchange (EDI) facility for customs clearance is available at the Chennai Airport. A new integrated terminal
       building has been constructed at Madurai Airport. Thanjavur is slated to get an airport, as the government has identified 50 locations in smaller
       cities for airport.

      In June 2017, the plan for the development of a new domestic airport in the border town of Hosur, Krishnagiri district has been approved by the
       state government. An MoU was also signed between the state government and the Ministry of Civil Aviation to launch low cost-air services from the
       Hosur Aerodrome.

     Tamil Nadu aircraft statistics for 2017-18 (April-December)

                     Parameter                            Chennai               Coimbatore                   Trichy                    Madurai

        Aircraft movement (nos.)                           113,039                  15,341                     9,508                      9,778

        Passenger traffic (nos.)                          14,880,039               1,738,135                 1,136,329                  1,027,916
        Freight handled (tonnes)                           314,483                   7,880                     4,784                      1,766

 Source: Airports Authority of India, 1At 2011-12 rates

23      TAMIL NADU                                                                                  For updated information, please visit www.ibef.org
PHYSICAL INFRASTRUCTURE – PORTS

      Tamil Nadu has 3 major ports: Chennai, Ennore & V O                      Tamil Nadu’s ports
       Chidambaranar. It has 23 minor ports. Ports at Cheyyur (Panaiyur),                                 •   Chennai
       Marakkanam & a combined port facility at Sirkazhi Taluk are under          Major ports             •   Ennore
       development.                                                                                       •   V O Chidambaranar
      The Chennai port mainly handles container cargo, while the Ennore                                  •   Cuddalore
       & V O Chidambaranar ports handle coal, ores & other bulk minerals.                                 •   Nagapattinam
       Tamil Nadu Vision 2023 envisages an investment of US$ 3.1 billion                                  •   Rameswaram
       for 3 greenfield ports & 5 minor ports, with a cumulative capacity of                              •   Pamban
       150 million tonnes.                                                                                •   Colachel
                                                                                                          •   Valinokkam
                                                                                                          •   Kanyakumari
     Cargo traffic at major ports in Tamil Nadu (‘000 tonnes)                                             •   Ennore
                                                                                                          •   Punnakayal
       Ports                2013-14         2014-15         2015-16   2016-17
                                                                                                          •   Thirukkadaiyur
                                                                                                          •   PY-3 (Oilfield)
       Chennai               51.10           52.54          50.05     50.21
                                                                                  Minor ports             •   Kattupalli
                                                                                                          •   Thiruchopuram
       V.O.
                             28.64           32.41          36.84     38.46                               •   Manappad
       Chidambaranar
                                                                                                          •   Kudankulam
                                                                                                          •   Mugaiyur
       Kamarajar
                             27.33           30.25          32.20     30.02                               •   Silambimangalam Shipyard
       (Ennore)
                                                                                                          •   Parangipettai
                                                                                                          •   Kaveri
       Total                 107.07          115.20         88.19     118.69
                                                                                                          •   Vanagiri
                                                                                                          •   Thirukkuvalai
                                                                                                          •   Udangudi
 Source: Indian Ports Association, Tamil Nadu Vision 2023                                                 •   Chettinad Tharangangapadi

24       TAMIL NADU                                                                             For updated information, please visit www.ibef.org
PHYSICAL INFRASTRUCTURE – POWER … (1/2)

      As of January 2018, the state had a total installed power                                 Installed power capacity (GW)
       generation capacity of 29.46 GW.
      Thermal power contributed 14.99 GW to the total installed power         35.00
       generation capacity, followed by renewable power, hydropower &
       nuclear power with contributions of 10.82 GW, 2.20 GW and 1.45          30.00

                                                                                                                                                                                 29.46
                                                                                                                                                                       29.11
       GW, respectively.                                                       25.00

                                                                                                                                                             25.39
      The private sector was the biggest contributor to the total installed

                                                                                                                                                   22.88
                                                                               20.00

                                                                                                                                         21.19
       power generation capacity in Tamil Nadu with a capacity of 16.27

                                                                                                                               19.43
                                                                                                                     17.60
                                                                               15.00
       GW, followed by 7.17 GW under state utilities and 6.02 GW under

                                                                                                           15.51
                                                                                                 14.41
                                                                                       14.09
       central utilities.                                                      10.00

      Renewable energy is a growing sector in the rural areas of the           5.00
       state. The Tamil Nadu Energy Development Agency (TEDA) is the
                                                                                0.00

                                                                                                                                                                                 1
       nodal agency of the Ministry of New & Renewable Energy

                                                                                       2008-09

                                                                                                 2009-10

                                                                                                           2010-11

                                                                                                                     2011-12

                                                                                                                               2012-13

                                                                                                                                         2013-14

                                                                                                                                                             2015-16

                                                                                                                                                                       2016-17

                                                                                                                                                                                 2017-18
                                                                                                                                                   2014-15
       (MNRE), Government of India, for promoting renewable energy
       schemes in the state.
      In the 2017-18 budget, the state government announced allocation
       of US$ 2.64 billion for the energy sector.
      Tamil Nadu Vision 2023 envisages an investment of US$ 39.6
       billion to expand generation capacity by 30,000 MW.
      As per budget 2016-17, at a cost of US$ 612.58 million, the state
       government has added a total of 252 new sub-stations with high
       tension lines of 7,452 km, during 2015-16.

 Note: 1 - As of January 2018
 Source: Central Electricity Authority, Tamil Nadu Vision 2023

25      TAMIL NADU                                                                                For updated information, please visit www.ibef.org
PHYSICAL INFRASTRUCTURE – POWER … (2/2)

      During 2017-18, with an investment of US$ 778.24 million, work on the project of Tamil Nadu Transmission System Improvement was under
       process. An amount of US$ 151.18 million was provided in budget 2017-18 for this project.
      Till March 2016, the equity share capital assistance and loan provided by the Government of Tamil Nadu across the sector was recorded to be
       US$ 2.30 billion and US$ 1.48 billion, respectively.
      During 2017-18, the state government extended financial support of US$ 3.54 billion to TANGEDCO.
      Kamuthi solar plant, one of the largest solar power plants in the world, consists of 2.5 million individual solar modules, that can produce 648 MW
       of electricity.
      The Tamil Nadu Government is implementing the Green Energy Corridor Project with the assistance of KfW at an estimated cost of US$ 247.25
       billion for improving the transmission infrastructure in the state.
      In September 2017, the government of Tamil Nadu signed memorandums of understanding (MoUs) with four solar power companies for contracts
       of 1,500 MW worth Rs 9,000 crore (US$ 1.39 billion).

 Source: State Budget 2016-17

26      TAMIL NADU                                                                                  For updated information, please visit www.ibef.org
KEY INDUSTRIES

       According to the Telecom Regulatory Authority of India (TRAI), Tamil       Telecom infrastructure (November 2017)
        Nadu had nearly 87.03 million wireless subscribers & 2.38 million
        wire-line subscribers as of December 2017.                                  Wireless subscribers                                   87,029,047
       Tamil Nadu had a high tele-density of 124.55% as compared to an             Wire-line subscribers                                  2,377,118
        all-India average tele-density of 91.90%, as of December 2017.                                                                                   1
                                                                                    Internet subscribers                                  34,470,000
       The Bharti-Singtel submarine cable link between Chennai &                                                                                 2
                                                                                    Telephone exchanges                                      2,330
        Singapore has a bandwidth of 8.4 terabits per second; a 2nd
        submarine cable of 5.12 terabits per second bandwidth has been              Teledensity (in%)                                        124.55
                                                                                                                                                     3
        commissioned by Tata Communications Ltd. (formerly, VSNL)                   Post offices                                            12,131
        between Chennai & Singapore.

       By the end of December 2017, 21,438,244 subscribers had
        submitted requests for mobile number portability in Tamil Nadu.        Major telecom operators in Tamil Nadu
       In order to boost the speed of mobile broadband up to 135 Mbps, in         Bharat Sanchar Nigam Limited (BSNL)
        the state, Bharti Airtel invested in development of 4G advanced            Bharti Airtel
        network services. The investment of US$ 9.16 billion, was made as a        Aircel Limited
        part of “Project Leap”, that the company had deployed for enhancing        Reliance Communications
        network transformation in India.                                           Vodafone Essar
                                                                                   Tata Teleservices
                                                                                   Idea Cellular

     Note: 1As of September 2017, 3As of March 2016
     Source: Telecom Regulatory Authority of India

27        TAMIL NADU                                                                                    For updated information, please visit www.ibef.org
DEVELOPMENT PROJECTS: URBAN
                  INFRASTRUCTURE

      The Jawaharlal Nehru National Urban Renewal Mission (JNNURM) covers the town panchayats that fall within Chennai Metropolitan
       Development Authority & urban agglomeration area of Madurai & Coimbatore. Funds valued at US$ 51.28 million have been released as
       additional central assistance (ACA) from 2014-15 to 2016-17 for 22 projects.

      The thrust areas of development under the JNNURM include water supply and sanitation, sewerage, solid waste management, road network,
       urban transport & redevelopment of inner city areas; also envisaged is the shifting of industrial & commercial establishments to designated areas.
       Tamil Nadu Vision 2023 envisages an investment of US$ 57.4 billion1 for urban infrastructure development.

      As per the state interim budget 2016-17, the implementation of National Urban Livelihood Mission (NULM) was made limited to 40 urban local
       bodies & during 2015-16, the state government sanctioned US$ 26.34 million under NULM for providing financial support to 39,062 identified
       street vendors.

      The state government had allocated US$ 38.19 million for National Urban Livelihood Mission (NULM), during 2016-17. An amount of US$ 42.24
       million has been allocated for National Urban Livelihood Mission in State Budget 2017-18. However, for Tamil Nadu Urban Livelihood Mission, an
       amount of US$ 15.27 million has been allocated during the same period. TULM has been implemented for addressing the urban poverty issues
       more broadly across the state.

      However, after the success of Tamil Nadu Urban Development Programme–III in the state, a new Tamil Nadu Sustainable Urban Development
       Programme has been taken up by the state government with the assistance of World Bank at an amount of US$ 585.24 million. Further, during
       2015-16, various projects have been taken up under the Solid Waste Management Fund, in across 67 municipalities, 291 town panchayats & 5
       municipal corporations, at a total cost of US$ 48.76 million.

      In January 2017, the central government approved the construction of 78,500 more homes for the benefit of urban poor under Pradhan Mantri
       Awas Yojana (Urban) in Tamil Nadu, West Bengal & Kerala, with an investment of US$ 439.53 million.

      Google India and Tata Trusts have decided to expand their ‘Internet Saathi’ program in Tamil Nadu in which Google India will facilitate the
       provision of Google Cloud credits for eligible startups engaged with Tamil Nadu Government’s startup initiative. Technical mentorship and
       advisory support to various startups will also be made available by Google India.

 Note: 1As of December 2011-12 rates
 Source: JNNURM, Ministry of Urban Development, Government of India, Tamil Nadu Vision 2023, State Interim Budget 2016-17

28      TAMIL NADU                                                                                                For updated information, please visit www.ibef.org
DEVELOPMENT PROJECTS: KEY PUBLIC-PRIVATE-
                   PARTNERSHIP (PPP) PROJECTS

                              Project name                                             Sector      PPP type       Project cost               Stage

          East Coast Road between Chennai and Puducherry                                (BOT)      Transport          9.46       Operation and maintenance stage
         Road Upgradation (Madurai-Tuticorin NH-45B) Project                            (BOT)      Transport         141.24      Operation and maintenance stage
      Dindigul-Tiruchchirappalli NH-45 Road Project (NHDP III A)                      (BOT) Toll   Transport          93.13      Operation and maintenance stage
             Road Upgradation (Hosur-Krishnagiri) Project                             (BOT) Toll   Transport         143.57            Under construction
                         Development of NCB-IV                                        (DBFOT)      Transport          55.1             Under construction
                Development of Marine Liquid Terminal                                   (BOT)      Transport          64.72      Operation and maintenance stage
            Development of Common user Iron Ore Terminal                                (BOT)      Transport          54.57      Operation and maintenance stage
             Development of Common user Coal Terminal                                   (BOT)      Transport          54.49      Operation and maintenance stage
                North Cargo Berth-III (Tuticorin) Project                             (DBFOT)      Transport          65.19            Under construction
             Conversion of 8th Berth as Container Terminal                             (BOO)       Transport          48.46            Under construction
                North Cargo Berth-II (Tuticorin) Project                              (DBFOT)      Transport          51.56            Under construction
     Construction of Additional two lane bridge and improvements to
                                                                                        (BOT)      Transport          3.88       Operation and maintenance stage
               the existingbridge across river Korathalayar
                              Coal Terminal                                     (BOT) Annuity      Transport          61.95      Operation and maintenance stage
               Chennai Outer Ring Road Project -Phase I                        (DBFOT) Annuity     Transport         167.85      Operation and maintenance stage

 Notes: DBFOT: Design-Build-Finance-Operate-Transfer
 Source: DEA, Ministry of Finance, Government of India, BOT: Build-Operate-Transfer

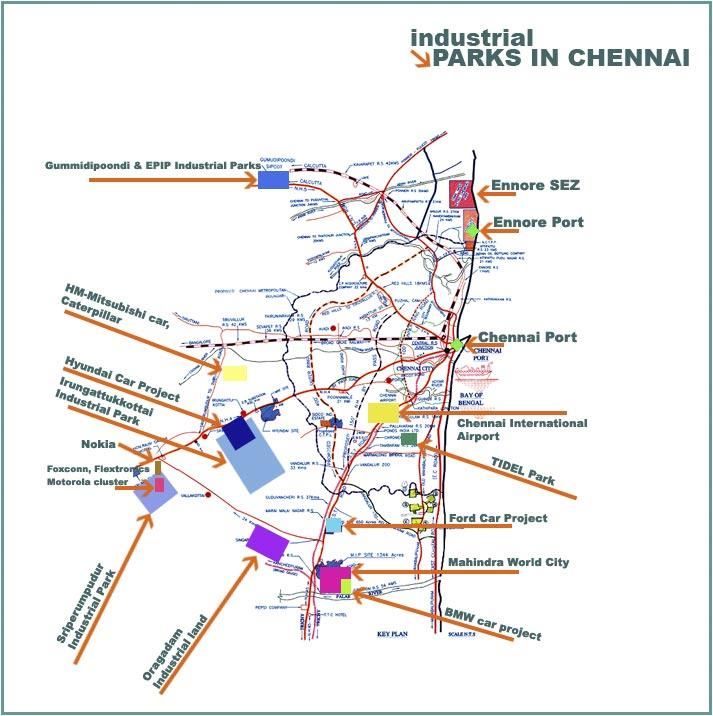
29       TAMIL NADU                                                                                            For updated information, please visit www.ibef.org
DEVELOPMENT PROJECTS: INDUSTRIAL CLUSTERS
                AND SEZs … (1/4)

               Infrastructure                                                         Description

                                     •   The State Industries Promotion Corporation of Tamil Nadu Limited (SIPCOT) Export Promotion
                                         Industrial Park (EPIP) is spread over 224 acres at Gummidipoondi in the Thiruvallur district.
                                     •   An industrial park has been set up at Irungattukottai for the automotive, electronics, food processing,
                                         general engineering & other non-polluting industries.

                                     •   The hi-tech SEZs in the Sriperumbudur Industrial Park & Oragadam Industrial Growth Centre (both in
     Industrial parks                    Kanchipuram district), are spread over 570.92 acres and 347.66 acres, respectively. These house
                                         manufacturing units for electronics, telecom hardware & support services.

                                     •   A new industrial park spread across 1,127 acres for the development of an industrial complex at
                                         Thervoy Kandigai village in Tamil Nadu has been planned. Land development work has started for the
                                         same. SIPCOT has taken possession of 125 acres of land in Thiruvallur district for creation of a new
                                         complex.

                                     •   Established in 1984 to promote FDI & one of the 7 export promotion zones (EPZs) set up by the
     Madras Export Processing Zone
                                         Government of India, MEPZ is a multi-product export zone with 117 functional units & another 27 in the
     (MEPZ)
                                         process of being set up. As of July 2015, the project is in construction stage.

                                     •   SIPCOT’s SEZs comprise a leather SEZ in Vellore, a footwear SEZ in Kanchipuram, an engineering
     SIPCOT’s SEZs                       products SEZ in Erode, an automotive SEZ in Thiruvannamalai & a transport engineering goods SEZ in
                                         Tirunelveli, granite SEZ in Bargur & hi-tech SEZs in Kanchipuram.

30    TAMIL NADU                                                                             For updated information, please visit www.ibef.org
DEVELOPMENT PROJECTS: INDUSTRIAL CLUSTERS
               AND SEZs … (2/4)

             Infrastructure                                                     Description

                              •   Tamil Nadu Industrial Development Corporation (TIDCO) has been engaged in setting up of industries,
                                  infrastructure projects & SEZs. Some of the projects completed through joint ventures are Tanflora
                                  Infrastructure Park, Tamil Nadu Road Development Company (TNRDC), Titan Industries Ltd., Tamil
                                  Nadu Petroproducts, TIDEL Park, Mahindra World City, Ascendas IT Park, etc.

     TIDCO’s SEZs             •   TIDCO and Rankindo Developers Private Ltd. have jointly developed an integrated township with IT
                                  SEZ in Coimbatore.

                              •   An IT and ITeS SEZ-TIDEL – III, with an international convention centre, is set up on 25 acres of land on
                                  the IT Expressway at Taramani in Chennai. MRTS runs near the project site.

                              •   Two apparel parks have been set up, one at Tirupur & the other at Irungattukottai near Chennai, with a
     Apparel Parks                project cost of US$ 133 million, including Government of India’s assistance of US$ 6.5 million. Both
                                  parks are functioning.

                                                                           st
                              •   Palladam Hi-Tech Weaving Park is the 1 integrated textile park in India. It is located near to
     Hi-tech Weaving Parks
                                  Coimbatore and recognised as one of the emerging weaving hubs.

31   TAMIL NADU                                                                      For updated information, please visit www.ibef.org
DEVELOPMENT PROJECTS: INDUSTRIAL CLUSTERS
               AND SEZs … (3/4)

          Infrastructure                                                             Description

                                •   Tamil Nadu Industrial Development Corporation Ltd. (TIDCO) & Indian Oil Corporation Ltd. through a joint
                                    venture, would set up a Liquefied Natural Gas (LNG) import terminal near Ennore Port at Kattupalli village in
                                    Thiruvallur. The LNG terminal is anticipated to get operationalized by 2018.
     LNG Import Terminal
                                                                                                   1
                                •   The project’s total investment is estimated at US$ 759.4 million & it aims to meet the state’s rising demand for
                                    energy & create a firm source for natural gas in the long term.
                                •   GAIL and TIDCO are jointly setting up a 500 MW LNG-based power project in the state.

                                •   TIDCO and M/s GVK Group of Hyderabad are jointly developing a multi-product SEZ in Perambalur; 2,880 acres
     Perambalur SEZ                 of land has been procured. The Ministry of Commerce & Industries, Government of India, has formally approved
                                    the project.

                                •   TIDCO has proposed the development of solar power parks for setting up 1,000-MW solar power projects in
                                    association with public and private organisations.
     Solar Power Park Project   •   In the first phase, TIDCO and M/s Raasi Green Earth Energy Private Limited, Bangalore, would jointly develop a
                                    solar park project of 100-MW capacity on a 500-acre dry land in Paramakudi, Ramanathapuram.

32   TAMIL NADU                                                                                For updated information, please visit www.ibef.org
DEVELOPMENT PROJECTS: INDUSTRIAL CLUSTERS
                  AND SEZs … (4/4)

      In May 2017, an MoU was signed between the Tamil Nadu National
       Industrial Development Corporation Ltd. (TIDCO) and the National
       Highways Authority of India for the development of a multimodal
       logistics park in the Ponneri Industrial Node area near Kamarajar
       Port.

                                            SEZ (no) (as of December
                 Description
                                                      2017)

     Notified SEZs                                      47

     SEZs with formal approvals                         50

     SEZs with in-principle approvals                    3

                                                                                                           Source: tidco.com

 Source: Ministry of Commerce & Industry

33      TAMIL NADU                                                         For updated information, please visit www.ibef.org
SOCIAL INFRASTRUCTURE – EDUCATION … (1/2)

      Tamil Nadu has an overall literacy rate of 80.09%. Male & female           Tamil Nadu’s primary education statistics
       literacy rates in the state are 86.77% and 73.14%, respectively.           (2014-15)

      Tamil Nadu is one of the states running the Total Literacy Campaign,                                      Primary: 35,307
       the Post-Literacy Mission & the Continuing Education Programme                                            Middle: 9,588
                                                                                  Number of schools
       (CEP).                                                                                                    High & higher secondary
                                                                                                                 schools: 12,297
      In the Budget 2017-18, US$ 4.18 billion has been proposed for the
       school education.                                                          Net enrolment ratio            Primary level: 99.85
                                                                                  (in%)                          Upper primary level: 99.10
      Tamil Nadu Vision 2023 envisages an investment of US$ 4.0 billion1
       for the education sector for improving schools, skill development and                                     Primary: 24.7:1
                                                                                  Pupil-teacher ratio
       setting up 10 centres of excellence.                                                                      Upper primary: 26.6:1
      Till March 2016, under the Comprehensive School Infrastructure
       Development Scheme (CSIDS), the state government took up a total
                                                                                  Literacy rates (%)
       of 48,020 works for providing basic infrastructure facilities in
       Panchayat Union Primary & Middle Schools, with an outlay of US$
                                                                                    Literacy rate                                             80.09
       75.97 million.
                                                                                    Male literacy                                             86.77
      In the 2017-18 budget, the state government provided US$ 233.29
       million for supplying notebooks, textbooks, uniforms, footwear,              Female literacy                                           73.14
       school bags, atlas, geometry box, crayons, color pencils & woolens,
       bicycles, etc.

      Tamil Nadu is expected to get three new government-funded
       residential schools in 2018. Union Education Ministry had recently
       approved the state's proposal to construct the facilities at Villupuram,
       Nagapattinam and Dharmapuri where the dropout rate has been high
       compared to other areas.
 Notes: 1At 2011-12 rates
 Source: Tamil Nadu State Portal, State Interim Budget 2016-17

34      TAMIL NADU                                                                                      For updated information, please visit www.ibef.org
SOCIAL INFRASTRUCTURE – EDUCATION … (2/2)

      As of 2014-15, the state had 35,307 primary schools, 9,588 middle       Educational infrastructure as of 2014-15
       schools & 12,297 high and higher secondary schools.

      Private participation is being encouraged in technical & vocational         Universities                                       59
       education.                                                                  Colleges                                         2,260
      Tuition fees of students pursuing graduation would be reimbursed.           Medical colleges                                   40
       For this purpose, an amount of US$ 105.55 million has been
                                                                                   MBA/MCA                                            65
       allocated in the 2017-18 budget.
                                                                                   Engineering colleges                              584
      In State Budget 2017-18, financial support of US$ 21.57 million has
       been extended to Annamalai university.                                      Polytechnics                                      518

      Other state universities will receive financial support worth US$           Dental colleges                                    20
       49.67 million in 2017-18.

      As per budget 2017-2018, allocation of US$ 571.19 million has been      Premier institutions in Tamil Nadu
       made for the higher education department.                                  University of Madras

      Realising the importance of the role played by the youth in achieving      Institute of Technology (IIT), Madras
       the goals of Vision 2023, the state’s Chief Minister implemented 14        Anna University
       welfare schemes aimed at benefiting school students in the state in        National Institute of Technology (NIT)
       2016.                                                                      Madras Medical College

      In an effort to help students cope with technological advances and      Christian Medical College (CMC), Vellore
       challenges and get them equipped with computer skills, the state      Tamil Nadu Agricultural University
       government has decided to set up hi-tech computer laboratories in     Tamil Nadu Veterinary and Animal Sciences University (TANUVAS)
       government high schools and higher secondary schools in June
       2017.
      In June 2017, the Tamil Nadu higher education department has decided to introduce 89 new arts and science courses at the graduate and post-
       graduate levels.
 Source: Tamil Nadu State Portal, State Interim Budget 2016-17

35      TAMIL NADU                                                                                    For updated information, please visit www.ibef.org
SOCIAL INFRASTRUCTURE – HEALTH…(1/2)

      The state has a 3-tier health infrastructure comprising hospitals,                       Health infrastructure (as of August 2017)
       primary health centres, health units, community health centres &
       sub-centres. As of August 2017, the state had 33 district hospitals,                         Sub-centre                                                             8,715
       316 sub-divisional hospitals, 1,931 primary health centres, 8,715
                                                                                                    Primary health centre                                                  1,931
       sub-centres & 434 community health centres.
                                                                                                    Community health centre                                                434
      The Tamil Nadu Vision 2023 envisages an investment of
                                                                                                                                                                4
       US$ 2.3 billion3 for creating & upgrading the existing medical                               Health worker (female)/ANM at sub centres & PHCs                       9,933
       facilities, skill development & other facilities.                                                                                        4
                                                                                                    Health worker (male) at sub centres                                    8,706
      The state’s Medical Service Recruitment Board (MSRB), in February                            Doctor at PHCs
                                                                                                                        4
                                                                                                                                                                           1,227
       2017, invited online applications for the positions of Auxiliary Nurse                                                           4
       Midwife & Village Health Nurse.                                                              Pharmacist at PHCs & CHCs                                              1,612
                                                                                                                                            4
                                                                                                    Nursing staff at PHCs & CHCs                                           3,922
      As of February 2017, under the state’s Universal Immunisation
       Programme (UIP), the state government has announced its plans to
       expand the availability of rotavirus vaccine in Tamil Nadu as well as                      Health indicators of Tamil Nadu (September 2017)
       4 other states.
                                                                                                                1
                                                                                                     Birth rate                                                     15.0
      As per State Budget 2017-18, a premium amount of US$ 209.23
       million was allocated for Comprehensive Health Insurance Scheme.                                             1
                                                                                                     Death rate                                                     6.4
       US$ 155.37 million was set aside for Dr Muthulakshmi Reddy
       Maternity Benefit Scheme.                                                                                             2
                                                                                                     Infant mortality rate                                          17
     Life expectancy at birth (years)

        Male (2006-10)                                                 67.1
        Female (2006-10)                                               70.9

 Source: Ministry of Health & Family Welfare, Tamil Nadu Vision 2023, 1Per thousand persons, 2Per thousand live births, 3At 2011-12 rates, 4 As of March 2015

36      TAMIL NADU                                                                                                      For updated information, please visit www.ibef.org
SOCIAL INFRASTRUCTURE – HEALTH…(2/2)

      In 2015, 20 UHCs (urban health centres) in Chennai & 37 UHCs in other corporations & municipalities were established. Also, improvement works
       worth US$ 17.91 million in the existing 100 UHCs in Chennai, 243 UHCs in the remaining corporations & 53 municipalities are being done.

      Implementation of various pioneering initiatives such as Non-Communicable Diseases (NCD) prevention, Health Management Information System
       & other control activities are strengthening the state’s healthcare sector. In interim budget 2016-17, the state government had come up with “Tamil
       Nadu Urban Healthcare Project” proposal at an estimated outlay of US$ 253.62 million under the assistance of Japan International Co-operation
       Agency. An amount of US$19.56 million has been provided in budget 2017-18 for this project.

      During 2015-16, 3 new government medical colleges were opened in Chennai. Moreover, the state government has approved the construction of
       2 more government colleges at Karur and Pudukkottai and is taking the required actions for the same. The medical college at Pudukottai was
       inaugurated by the Chief Minister in June 2017.

      As of March 2017, the state government is extending financial aid for bone marrow transplants at Jipmer, Tamil Nadu. Bone marrow unit at the
       hospital is well equipped with bio-safety laminar hood for stem cell cryopreservation & sterile chemotherapy preparation. The transplant rooms are
       also equipped with HEPA filters for infection control & laminar flow.

 Source: State Interim Budget 2016-17

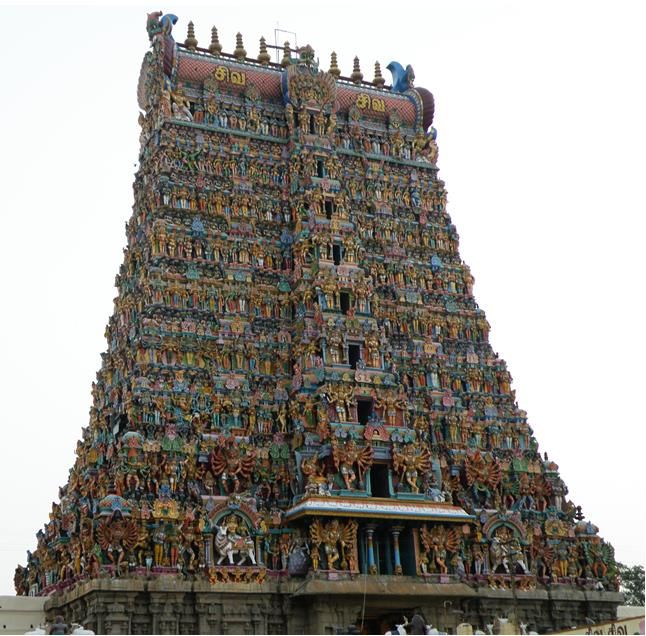
37      TAMIL NADU                                                                                   For updated information, please visit www.ibef.org
CULTURAL INFRASTRUCTURE

      Known as the Land of Temples, Tamil Nadu has nearly 33,000 ancient temples – many at least 600-800 years old – spread across the state.

      The Sports Development Authority of Tamil Nadu (SDAT) develops sports related infrastructure in the state. The M. A. Chidambaram Stadium of
       Chennai is an international cricketing arena with a capacity of 50,000; it also houses the offices of the Tamil Nadu Cricket Association. The
       Chennai Open Tennis championships are held every January at the SDAT Tennis Stadium. Jawaharlal Nehru Stadium in Chennai is a
       multipurpose stadium that hosts football tournaments, and track and field events.

      Chennai hosts the Annual Madras Music Season during December–January; it includes performances by artists from all over the city.
       Bharatanatyam is a well-known classical dance form of Tamil Nadu. From the beaches in the east to Nilgiri Hills in the West, Tamil Nadu offers
       various avenues for adventure, leisure and culture tourism. The state is a leader in domestic tourism.

      The state government took several initiatives to promote sports. Some of the initiatives include – conducting state games for Chief Minister’s
       Trophy worth US$ 1.34 million, establishment of sports facilities at Nungambakkam Tennis Stadium worth US$ 0.75 million and building a District
       Level Multipurpose Indoor Stadium in 14 districts worth US$ 0.25 million each.

      Cash incentives worth US$ 0.8 million and US$ 0.45 million are sanctioned to winners of the 17th Asian Games held at Incheon, South Korea and
       20th Commonwealth Games held at Glasgow, United Kingdom respectively.

      In State Budget 2017-18, US$ 25.61 million has been allocated for sports and youth welfare development department.

38      TAMIL NADU                                                                                For updated information, please visit www.ibef.org
SMART CITIES & AMRUT…(1/2)

      Ten cities of Tamil Nadu will be developed as a smart cities.
       Another two cities (Erode and Dindigul) will be competing with 19
       other cities for 10 spots to be chosen in the smart city mission. In
                                                                                                                   Vellore                Chennai
       2015, along with the smart cities in the state, 33 cities were chosen
       for the development of infrastructure under Atal Mission for
                                                                                                                      Tirunelveli
       Rejuvenation and Urban Transformation (Amrut).

      For 2015-16, Chennai and Coimbatore had been chosen under the                                Salem
                                                                                            Erode
       programme of smart cities by Government of India.

      In Round 2, Vellore, Madurai, Salem and Thanjavur were chosen.          Coimbatore                   Tiruchirappalli
                                                                                            Tiruppur
       Tiruppur, Tirunelveli, Thoothukudi and Tiruchirapalli were chosen
       in Round 3.                                                                           Dindigul
                                                                                                                              Thanjavur

      Further, the state government has allocated US$ 186.26 million for              Madurai
       the smart cities programme and US$ 217.3 million for AMRUT, as
       per budget 2017-18.

      The first installment of central assistance amounting to Rs 36,027
       lakh (US$ 56.04 million) was released by the Ministry of Urban                                   Thoothukudi
       Development to the Government of Tamil Nadu under AMRUT in
       May 2017. Also, Rs 111.52 crore (US$ 17.23 million) have been
       released as reforms incentive under AMRUT in 2017-18.

      Under the Smart Cities Mission, Rs 448 crore (US$ 69.2 million)
       have been released in 2017-18 as of January 2018.

 Source: Census 2011 & Aranca Research

39      TAMIL NADU                                                                              For updated information, please visit www.ibef.org
SMART CITIES…(2/2)

     Population, area & literacy rate of identified smart cities in Tamil Nadu

                                                                                  Area
      Cities                                Population (million)                                             Literacy rate (percentage)
                                                                                 (sq km)

     Chennai                                         4.6                           426                                 90.18
     Coimbatore                                     1.05                         246.75                                91.30
     Madurai                                        1.01                           148                                 90.91
     Tiruchirappalli                                0.84                         167.23                                91.38
     Salem                                          0.83                          5205                                 84.42
     Tirunelveli                                    0.47                          169.9                                90.39
     Thanjavur                                      0.22                          3397                                 91.27
     Tiruppur                                       0.44                         5,186.34                              87.81
     Vellore                                        0.18                          6,077                                86.40
     Erode                                          0.16                          5,692                                82.29
     Thoothukudi                                    0.24                          4,745                                93.69
     Dindigul                                       0.20                         4,497.77                              90.22

 Source: Census 2011 & Arancai Research

40      TAMIL NADU                                                                        For updated information, please visit www.ibef.org
KEY INDUSTRIES

      TIDCO, State Industries Promotion Corporation of Tamil Nadu                          Key industries in Tamil Nadu
       (SIPCOT), Tamil Nadu Industrial Investment Corporation Ltd. (TIIC)
                                                                                             Textiles
       & Tamil Nadu Small Industries Development Corporation Ltd
       (TANSIDCO) are jointly developing industrial infrastructure in the                    Heavy commercial vehicles
       state.                                                                                Automobile and auto components
      Tamil Nadu Industrial Guidance & Export Promotion Bureau has                          Engineering
       been set up with the objective of attracting major investment
       proposals into Tamil Nadu.                                                            IT and ITeS

      Tamil Nadu is an important IT hub. It is one of the largest software                  Cement
       exporters by value in India. IT exports from Tamil Nadu increased                     Banking and financial services
       from US$ 7.1 billion in 2007-08 to US$ 15.57 billion in 2016-17(E), at
                                                                                             Drugs and pharmaceuticals
       a CAGR of 8.17%.
                                                                                             Agro and food processing
      A large number of textile mills & engineering units are present
       around the city of Coimbatore. The districts of Coimbatore, Tirupur &                 Leather tanning industries
       Erode are referred to as the ‘Textile Valley of India’.                               Electronic hardware
      In March 2017, a sewerage plant project was started by Chennai                        Tourism
       Metrowater, at Kodungaiyur & Koyambedu so as to reduce pressure
       on freshwater resources & supply to industrial units. The estimated
       cost of the project is around US$58.9 million.
      Over the decades, Tamil Nadu has seen major investments in the automotive industry, particularly in cars, railway coaches, tractors, motorcycles,
       automobile spare parts & accessories, tyres & heavy vehicles. The automotive industry plays a crucial role in driving the state’s economy. The
       government has decided to put it down under “public utility” section.

 Note: E - Expected
 Source: Software Technology Parks of India, Chennai; News articles, MSME Policy Note 2013-14, Business Standard

41      TAMIL NADU                                                                                                 For updated information, please visit www.ibef.org
KEY INDUSTRIES – TEXTILES … (1/2)

      Tamil Nadu is known as the “Yarn Bowl” of the country. Tamil Nadu                                      Financial assistance to the handloom weavers
       is the largest producer of cotton yarn, accounting for 41% of India’s                                                  (in US$ million)
       production. Coimbatore and Tirupur are the major textile centres in
       Tamil Nadu. Tirupur is known as the ‘Knitting City’, while Coimbatore                           8.00
       is called the ‘Manchester of South India’.                                                      7.00

                                                                                                                                                                            7.19
                                                                                                       6.00
      Accounting for about 34.35% share in the overall spun yarn
                                                                                                       5.00
       production of the country during 2015-16, spun yarn production in

                                                                                                                       5.02

                                                                                                                                         4.99
                                                                                                       4.00
       Tamil Nadu stood at 0.97 million kg, by the end of September 2015.
                                                                                                       3.00
       The capacity of spinning mills is around 22.24 million spindles.
                                                                                                       2.00
      Government measures such as free distribution of sarees and

                                                                                                                                                          1.55
                                                                                                       1.00
       dhoties on Pongal festival are providing employment to many power                                 -
       loom and handloom weavers. In the 2016-17 interim budget,                                                   2012-13             2013-14         2014-15          2015-16
       allocation of US$ 75.64 million was made by the government for the                                                                          Note 1Including Bihar, 2As of May 2016
                                                                                                                                        Source: Department of Industrial Policy & Promotion
       scheme of providing sarees and dhotis to people. Moreover, US$
                                                                                                  The government provides incentives by awarding the skilled artisans.
       11.98 million was allocated for the rebate subsidy scheme for
                                                                                                   For expanding the global presence of their products, Tamil Nadu
       pushing the sales of handloom cloth.
                                                                                                   Handicrafts Development Corporation and Co-optex has introduced
      Some of the key players                                                                      online marketing. The Khadi and Village Industries Board and
                                                                                                   Sarvodaya Sangams to be provided with a rebate subsidy of US$
       Madura Coats Pvt Ltd (MCL)
                                                                                                   2.82 millions.
       Primus Fabrics
                                                                                                  Financial assistance released under National Handloom
       Gem Spinners                                                                               Development Programme (NHDP)/ Comprehensive Handloom
                                                                                                   Development Scheme during 2015-16 was recorded to be US$
       Lakshmi Mills
                                                                                                   427.06 thousand.

 Source: Tamil Nadu Policy Note on Industries, State Portal, Ministry of Textiles, Government of India, State Interim Budget 2016-17

42      TAMIL NADU                                                                                                        For updated information, please visit www.ibef.org
You can also read