ASEAN-India Connectivity: An Indian Perspective
←
→
Page content transcription
If your browser does not render page correctly, please read the page content below
Chapter         3
ASEAN-India Connectivity: An Indian
Perspective

Prabir De
Research and Information System for Developing Countries (RIS), India.

December 2011

This chapter should be cited as
De, P. (2011), ‘ASEAN-India Connectivity: An Indian Perspective’, in Kimura, F.
and S. Umezaki (eds.), ASEAN-India Connectivity: The Comprehensive Asia
Development Plan, Phase II, ERIA Research Project Report 2010-7, Jakarta: ERIA,
pp.95-150.
CHAPTER 3.
    ASEAN-INDIA CONNECTIVITY: AN INDIAN PERSPECTIVE1

                                         PRABIR DE

                                            Abstract
    Effective and efficient infrastructure is essential for industrial and services
competitiveness. Improved connectivity lowers costs and increases reliability. This is
of great importance for industrial transport and thus for production, cost effectiveness
and reliability of supply. In absence of adequate connectivity, enormous opportunities
generated by the dynamic growth centres of Asia may stop at their international
borders. This study discusses challenges and opportunities in physical connectivity
between ASEAN and India. It makes some important recommendations for enhancing
physical connectivity between them. The study suggests that for the creation of a
functional single market in Asia it is necessary to overcome missing links in transport
corridors, lack of inter-operability and infrastructure gaps reducing the efficiency and
weakening the global competitiveness of the Asian industry.

1
   On-behalf of RIS, this study has been prepared by Dr. Prabir De, Fellow, RIS under the ERIA
Research Project on ‘ASEAN-India Connectivity: Comprehensive Asia Development Plan, Phase
2’. This study was conducted based on a Terms of Reference (ToR) received from ERIA.
Research inputs were provided by Mr. Sanjeev Moholkar, Japan International Cooperation Agency
(JICA) India, New Delhi; Dr. Anindita Chakrabarti, Madras School of Economics (MSE),
Chennai; Dr. Gurudas Das, National Institute of Technology (NIT) Silchar, Assam; and Dr. Subash
Sashidharan, Indian Institute of Technology (IIT) Madras, Chennai. The report is benefited from
comments of participants of the Open Dialogue on ‘ASEAN-India Connectivity: Comprehensive
Asian Development Plan, Phase 2’, held at New Delhi on 23 May 2011. In particular, Mr. Arvind
Kumar, Ministry of Shipping, Government of India; Mr. S K Popli, Rail India Technical and
Economic Services Ltd., (RITES), Government of India; Mr. Sudip Chaudhury, Ministry of Road
Transport and Highways, Government of India; and Mr. N Unni and Mr. Sanjeev Kumar, Inland
Waterways Authority of India (IWAI), Government of India provided useful comments and
suggestions on the study. The study has also been benefited from useful suggestions of Dr
Biswajit Dhar, Director-General, RIS, and Ms. Renu Pall, Jt. Secretary (ASEAN), Ministry of
External Affairs (MEA), Government of India. Ms. Poulomi Dasgupta, RIS provided sincere
research assistance. Mr. David Zote (Manipur University) helped in arranging the field visit of the
study team to Moreh (India) and Tamu (Myanmar).                 Author may be contacted at
prabirde@hotmail.com. Usual disclaimers apply.

                                               95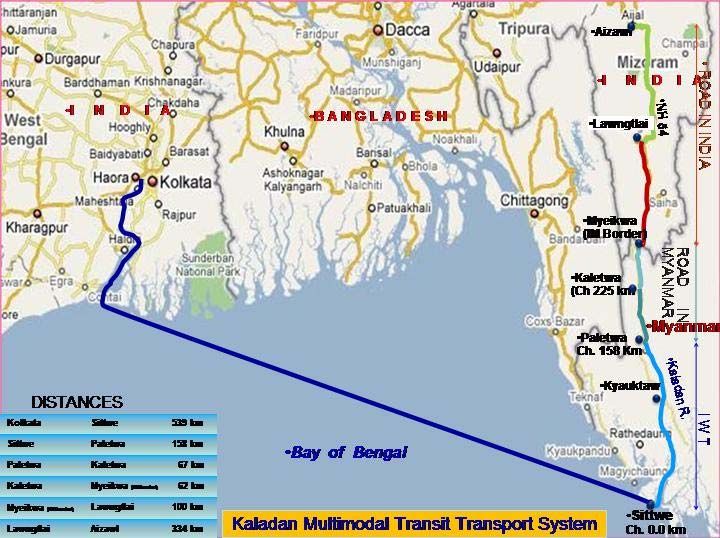
1.    WHY IS ASEAN-INDIA CONNECTIVITY SO IMPORTANT?

     Connectivity promotes trade, brings people closer, and integrates the economies.
We dream for a cherished world in which countries exchange goods, factors and ideas
without barriers. Openness or globalization is potentially beneficial to all but requires
appropriate policy designs to realize it. Improving connectivity is essential for the
region’s prosperity, continued growth and, most importantly, poverty reduction.2
     Effective and efficient infrastructure is essential for industrial and services
competitiveness. Improved connectivity lowers costs and increases reliability. This is
of great importance for industrial transport and thus for production, cost effectiveness
and reliability of supply. Undoubtedly, distance is exogenous, and it is a major
determinant of a region’s trade prospects.            In absence of adequate connectivity,
enormous opportunities generated by the dynamic growth centres of Asia may stop at
their international borders. Trade and connectivity between India and ASEAN may be
seen in this perspective.
     In 2010, the East Asia Summit (EAS) countries adopted a comprehensive strategy
for smart, sustainable and inclusive growth.3 At the 17th ASEAN Summit in 2010,
the leaders adopted the Master Plan on ASEAN Connectivity, which identifies key
strategies and actions to enhance the region’s connectivity in three dimensions:
physical, institutional, and “people-to-people”.4 It shows the way ahead for Asia in
regional integration. The Asia’s aim to single market would depend on the existence
of a seamless, flexible and efficient logistics and transportation system. Today, it is
fragmented, and often it is an obstacle to free flow of goods and services, because of
the administrative or technical barriers resulting in expensive mobility within Asia.
     In the rail sector, track gauges, voltage and signaling systems differ from one
country to another. Similarly, in the road sector, highway lanes, lighting system and
quality of roads differ across countries in Asia. The port facilities in some countries
are well equipped with technical and electronic equipment, whereas ports in many

2
   There are both short run and long run benefits of better connectivity. The literature confirms
that the long-term impacts of connectivity are several times greater than those in the short-run. In
the short-run, the benefits of regional connectivity emanate from reductions in transport cost and
time, and increases in trade volumes. However, in the long-run, regional connectivity helps to
unlock the tremendous potential of the region by removing constraints and bottlenecks to growth.
3
  Refer, Comprehensive Asia Development Plan (CADP), prepared by ERIA, August 2010.
4
  Refer, ASEAN Summit Declaration, October 2010.

                                                96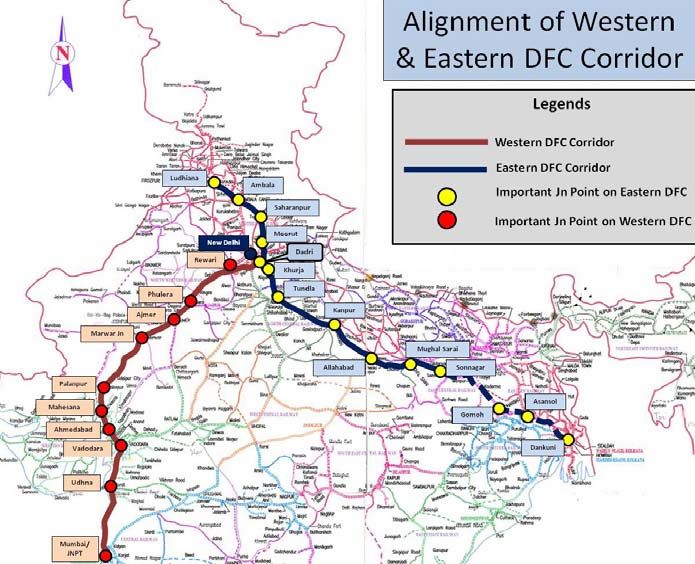
countries in the region still belong to the ancient period and are far away from
automation and modernization. While runways in some airports accommodate bigger
airplanes, most of the Asian airports lack basic aviation infrastructure. For creation of
a functional single market in Asia, it is necessary to overcome the missing links in
transportation, the lack of inter-operability and infrastructure gaps reducing the
efficiency and weakening the global competitiveness of the Asian industry.
    The strong growth of the Indian economy has already made a significant impact
on the Asian economy.        A considerable part of Asia’s supply of primary goods
originates from India. India sources intermediate goods and natural resources from
Asia. Therefore, growth is strong, and the netex port values are very important for
Indian as well as Asian economy. Asia’s supply of strategic resources and goods is a
vital issue and, therefore, should be given greater attention.
    India’s trade, primarily due to FTAs, is expected to increase manifolds in the
coming years. ASEAN-India FTA is central to India’s growing engagement with her
eastern neighbours. Accompanying this growth will be an increase in the demand of
both national and international infrastructure, for both production and consumption,
and international trade purposes. Undoubtedly, failure to respond to this demand will
slow down India’s trade and hamper the growth process. Therefore, infrastructure
challenges, both hardware and software, require a better understanding and adequate
support.
    In order to deepen economic integration among East Asian countries, the
Economic Research Institute of ASEAN and East Asia (ERIA) conducted a series of
research projects in 2009 to develop a Comprehensive Asia Development Plan
(CADP) in response to the request from the East Asia Summit (EAS)5. The CADP
provides (i) a grand spatial design for infrastructure development in East Asia armed
with a consistent conceptual framework based on new waves of international trade
theory such as the fragmentation theory and new economic geography, (ii) simulation
analyses on the impacts of logistic enhancement to the region, using the Geographical
Simulation Model (ERIA/IDE-GSM), and (iii) a list of prospective infrastructure
projects in consistence with the aforementioned conceptual framework.
    Although the CADP has successfully fulfilled the initial mission, there still

5
  The final report of CADP was submitted to the East Asia Summit in October 2010. The report is
available at ERIA, www.eria.org. Refer, ERIA research project report 2009, No. 7-1, October
2010.

                                              97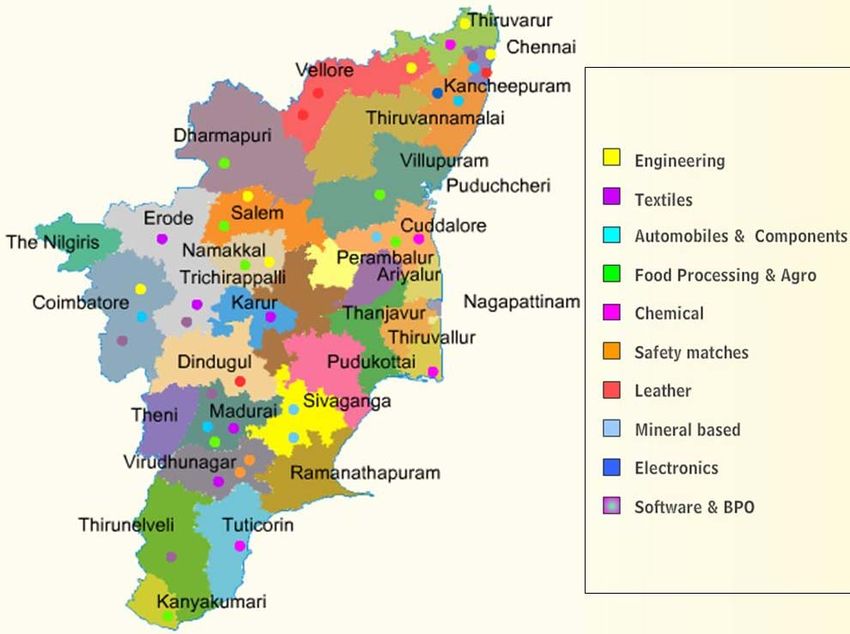
remain a number of issues which require further studies. Out of these outstanding
issues, a study to develop a basic strategy to enhance the ASEAN-India connectivity
is selected as one of the sub-project under phase 2 of the CADP. As explicitly stated
in the Master Plan on ASEAN Connectivity 6 , ASEAN put an emphasis on
connectivity with the neighboring countries, including China, India, and other EAS
countries. While both China and India are the emerging economic superpowers in the
region and the immediate neighbors to ASEAN, the extents of the connectivity with
ASEAN differ significantly.
    The benefits of better connectivity are plenty for both India and ASEAN. For
example, with better connectivity, both India and ASEAN can infuse new dynamism
in the regional production network. Stronger production network would enhance the
trade and investment, and thereby deepen the East Asian integration process. To
sustain the regional production network, we need to improve the trade costs and
country’s comparative advantage in trade.         The catalyst to regional production
network is the lowering trade costs. In the long-run, ASEAN-India connectivity
would help to unlock the tremendous potential of the region by removing constraints
and bottlenecks to growth.
    How do we then intensify production network (vertical intra-industry type)
between India and ASEAN? By driving down real trade costs and trade and transport
logistics barriers, India and ASEAN may realize the potential of higher production-
sharing arrangements.        The drivers of such trade go beyond relative factor
endowments, to factors such as complementary use of information and
communication technologies and natural geographies (clustering, agglomeration, and
scale effects).7 According to Kimura and Kobayashi (2009), the fragmentation theory
argues that the key to attract fragmented production blocks is to (i) improve locational
advantages by, for example, developing special economic zones (SEZs) coupled with
improving local level investment climate; and (ii) reduce the cost of service links that
connect remotely located production blocs by improving trade and transport
facilitation.   Figure 1 presents a graphical links between production blocks.
Nonetheless, this exhibit shows why the improved service links between India and
ASEAN is important to strengthen the production networks. In fragmentation of

6
  Refer, for example, ASEAN Secretariat, Master Plan on ASEAN Connectivity, December 2010,
available at www.asean.org.
7
  Refer, for example, Kimura and Obashi (2007).

                                           98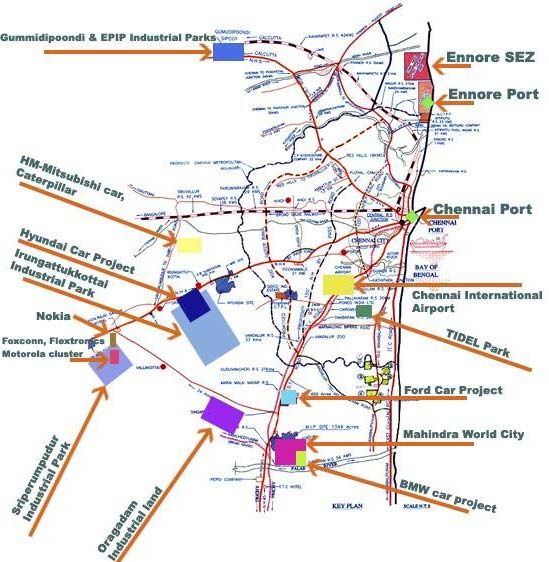
production, the improved service links, for example, an improved connectivity, is
important for expansion of production networks across a region. However, there are
many challenges to it. As noted in literature, the institutional cost (due to high tariffs)
and the physical cost (due to inadequate physical connectivity) are the barriers to
greater economic interactions between India and ASEAN.
Figure 1: Production Blocks and Service Links
Source: ERIA based on Kimura and Kobayashi (2009).
An improved infrastructure between India and ASEAN will be insufficient to
foster the regional integration until and unless it is widely complemented by the
appropriate policies and regulations, and participation of the private sector.8 At the
same time, we need policies and regulations to foster an effective cross-border
movement of goods, services, and people. Harmonizing and simplifying the customs
procedures, information sharing, customs modernization, establishing transparent
transit rules, and improving logistics in general are also critical to infrastructure
expansion.
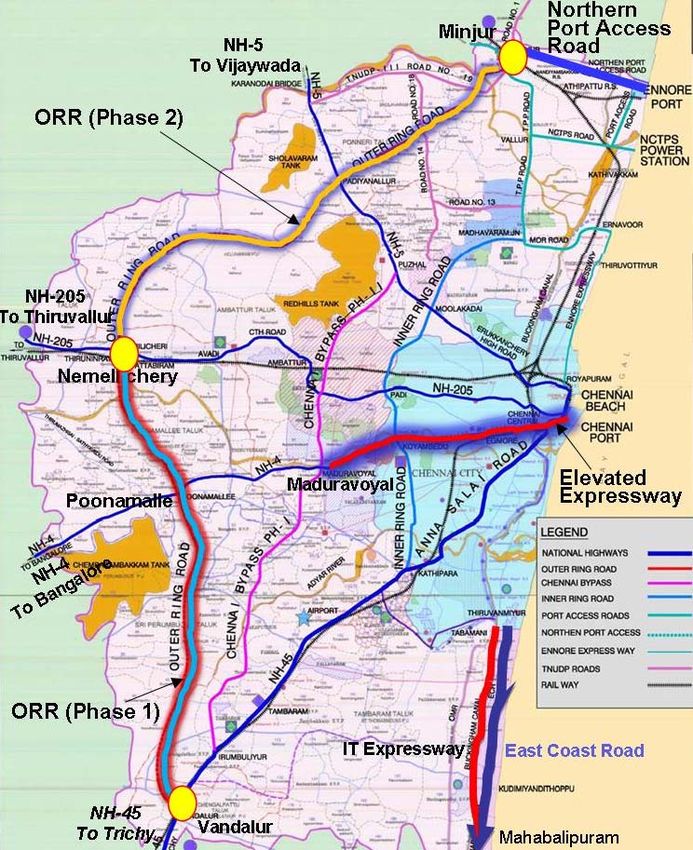
At this very initial stage, the emerging regional physical connectivity architecture
between India and ASEAN is showing two important features – first, the national
connectivity having regional implications such as Delhi–Mumbai Industrial Corridor
(DMIC), and second, the regional connectivity showing regional (or international)
8
De et al. (2010) indicates that given the huge infrastructure investment needs of the region and
insufficient government resources, the role of the private sector and public-private partnerships in
enhancing regional and national infrastructure facilities in Asia is very crucial. A review of select
case studies of cross-border infrastructure projects clearly indicates that the major reasons for slow
progress of regional infrastructure development by private sector stem from both economic to non-
economic issues that need to be addressed in order to promote seamless Asia.
99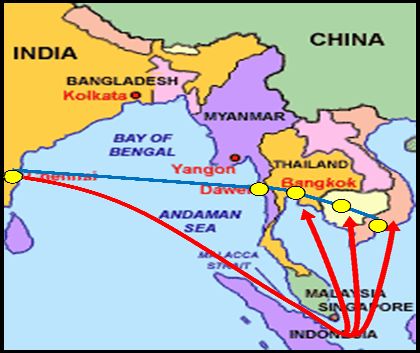
implications such as Mekong–India Economic Corridor (MIEC), Trilateral Highway
(TH) between India, Myanmar, and Thailand along the Asian Highway (AH) No. 1,
and Kaladan Multimodal Transit Transport Project (KMTTP), to mention a few.
     In view of the potential benefits for both ASEAN and India, it is highly important
to develop an appropriate strategy to enhance the connectivity between them. At the
same time, enhancing connectivity requires strong regional institutions to build and
manage the cross-border infrastructure. This study considers these issues starting
with assessments of connectivity in trade and transportation between India and
ASEAN. This chapter also discusses the national and regional policies, and their
potential for promoting connectivity between India and ASEAN.

2.    RISING ASEAN - INDIA TRADE

     ASEAN has become India’s one of the largest trading partners in recent years.
India’s trade with ASEAN has increased from US$ 7.13 billion in 2000 to US$ 41.32
billion in 2009 (Table 1). Grown at 22 percent in the last decade, India’s trade with
ASEAN presently shares about 10 percent of India’s global trade, compared to 8
percent of 2000. India’s trade with ASEAN+3 countries is the most documented
development that the world has witnessed in the contemporary period. Trade between
India and ASEAN+3 countries increased from less than US$ 20 billion in 2000 to
over US$ 110 billion in 2009, grown at a CAGR of about 23 percent in the last
decade–perhaps the fastest trade growth ever witnessed by India with any economic
bloc in the world in the last one decade. Today, ASEAN+3 countries contribute 1/4th
of India’s global trade, thus emerging as India’s largest trading partner in the world.
However, this growth in trade varies across countries within ASEAN.
     India’s export to ASEAN has been growing faster than her imports from ASEAN.
In 2009, India’s import from ASEAN was US$ 24 billion and the export to the region
was US$ 17billion (Table 2(a), (b)). Except 2005, India had net trade deficit with
ASEAN in the last decade. India’s trade with China has witnessed a phenomenal rise
in the last decade. India’s export to China mainland increased from about US$ 1.5
billion in 2001 to US$ 10 billion in 2009, witnessing a CAGR of 27 percent per
annum. In contrast, India’s import from China expanded sharply. In 2009, India’s
import from China mainland touched US$ 29 billion, which was a mere US$ 2 billion

                                          100
in 2001, increasing with a CAGR of 39 percent since 2001. With a share of 6 percent
in India’s global export and 11 percent in India’s global import, China has become
India’s largest trading partner. At the same time, India’s trade with Indonesia,
Malaysia, Singapore, Japan and Korea have also grown rapidly. Vietnam comes next.
Today, ASEAN shares about 11 percent in India’s global exports (which was 7 percent
in 2001), and 9 percent of India’s global imports (which was 11 percent in 2001).
Compared to China and ASEAN, India’s trade with CLMV countries has not yet
picked-up the momentum. It also suggests further scope for trade expansion with
CLMV countries in coming years. This is also not to deny that India’s trade with
ASEAN and ASEAN+3 countries would be driven by the short run trend. However,
the structure of exports may change when the countries witness favorable trading
environment such as improved and enabling trade costs. The current trends of
ASEAN-India trade suggest that India could become an increasingly important market
for ASEAN’s exports and vice versa.
Table 1: Trends in India’s Trade (Export+Import) with ASEAN and ASEAN+3
ASEAN ASEAN+3 World
Year
Value Share* Value Share* Value
(US$ billion) (%) (US$ billion) (%) (US$ billion)
2000 7.13 7.67 18.02 19.38 92.96
2001 10.04 9.60 23.79 22.75 104.58
2002 9.29 8.49 22.81 20.84 109.43
2003 12.38 9.16 30.75 22.74 135.21
2004 15.91 9.08 40.23 22.96 175.22
2005 20.36 8.55 55.30 23.23 238.10
2006 28.36 9.54 73.45 24.71 297.23
2007 36.96 9.51 98.39 25.31 388.80
2008 43.26 9.42 117.42 25.57 459.17
2009 41.32 9.77 113.42 26.82 422.87
CAGR (%) 21.56 22.68 18.33
*Share in the world
Source: Calculated based on Direction of Trade Statistics Online Database, IMF
101Table 2(a): India’s Export to ASEAN+3
2001 2005 2009 CAGR
Country
Value Share* Value Share* Value Share* (2001-2009)
(US$ million) (%) (US$ million) (%) (US$ million) (%) (%)
Brunei 3.09 0.007 33.47 0.034 24.42 0.015 29.49
Cambodia 2.59 0.006 22.68 0.023 41.39 0.025 41.40
Indonesia 442.05 0.973 1368.30 1.393 2872.53 1.739 26.36
Lao PDR 5.52 0.012 4.77 0.005 20.65 0.013 17.93
Malaysia 702.19 1.546 1142.41 1.163 3463.78 2.097 22.08
Myanmar 53.05 0.117 111.32 0.113 209.78 0.127 18.75
Philippines 225.67 0.497 474.06 0.483 699.84 0.424 15.20
Singapore 1016.69 2.238 5069.12 5.161 6721.49 4.069 26.63
Thailand 611.72 1.346 1031.83 1.051 1592.29 0.964 12.70
Vietnam 207.26 0.456 657.00 0.669 1722.47 1.043 30.30
ASEAN 3269.84 7.197 9914.95 10.095 17368.64 10.513 23.21
China, of which 3635.33 8.002 10752.12 10.948 17134.27 10.372 21.39
China, Mainland 1545.20 3.401 6473.30 6.591 10155.00 6.147 26.54
China, Hong Kong 2087.54 4.595 4276.45 4.354 6938.38 4.200 16.20
China, Macao 2.59 0.006 2.37 0.002 40.85 0.025 41.17
Japan 2010.95 4.426 2392.92 2.436 3186.04 1.929 5.92
Korea 1005.12 2.212 1630.83 1.661 3732.14 2.259 17.82
Table 2(b): India’s Import from ASEAN+3
2001 2005 2009 CAGR
Country
Value Share* Value Share* Value Share* (2001-2009)
(US$ million) (%) (US$ million) (%) (US$ million) (%) (%)
Brunei 0.19 0.00 0.79 0.00 486.16 0.19 166.69
Cambodia 0.11 0.00 0.64 0.00 3.72 0.00 55.29
Indonesia 1159.33 1.96 2910.52 2.08 7863.91 3.05 27.04
Lao PDR 0.01 0.00 0.09 0.00 0.20 0.00 45.42
Malaysia 1734.76 2.93 2386.46 1.71 4923.03 1.91 13.93
Myanmar 197.81 0.33 495.95 0.36 1195.26 0.46 25.21
Philippines 78.26 0.13 223.47 0.16 316.88 0.12 19.10
Singapore 3017.86 5.10 3178.18 2.27 6047.47 2.35 9.08
Thailand 530.08 0.90 1125.16 0.80 2683.95 1.04 22.48
Vietnam 49.90 0.08 120.16 0.09 426.97 0.17 30.78
ASEAN 6768.31 11.44 10441.43 7.46 23947.55 9.29 17.11
China, of which 3415.92 5.78 12013.42 8.59 33810.66 13.12 33.18
China, Mainland 2093.51 3.54 9925.53 7.10 28839.60 11.19 38.80
China, Hong Kong 1322.15 2.24 2087.77 1.49 4970.76 1.93 18.00
China, Macao 0.26 0.00 0.12 0.00 0.30 0.00 1.80
Japan 2133.59 3.61 3854.61 2.76 6385.90 2.48 14.69
Korea 1548.50 2.62 4300.08 3.07 7856.36 3.05 22.51
*Share in the world
Source: Calculated based on Direction of Trade Statistics Online Database, IMF
102Table 3(a): India’s Trade with ASEAN+3: Product Compositions
Year: 2003
Flow Product
ASEAN World ASEAN’s
Value Value Share* (%)
(US$ billion) (US$ billion)
Capital goods 0.68 5.05 13.37
Consumer goods 2.42 23.83 10.17
Export
Intermediate goods 4.77 24.10 19.78
Raw materials 1.97 5.33 37.04
Capital goods 6.13 14.63 41.92
Consumer goods 1.89 6.82 27.68
Import
Intermediate goods 5.63 21.60 26.05
Raw materials 1.21 28.60 4.24
Flow Product Year: 2009
ASEAN World ASEAN’s
Value Value Share* (%)
(US$ billion) (US$ billion)
Capital goods 6.10 22.68 26.89
Consumer goods 8.85 76.74 11.53
Export
Intermediate goods 10.81 53.44 20.23
Raw materials 8.18 15.55 52.62
Capital goods 28.27 56.60 49.94
Consumer goods 9.86 25.28 39.00
Import
Intermediate goods 21.17 88.30 23.97
Raw materials 7.49 90.35 8.28
*Products are grouped according to WTO classification (WTO SoP1 to SoP4)
Source: WITS based on UN COMTRADE
103Table 3(b): India’s Export to ASEAN+3 in 2009:
Commodity Compositions (Top 20Products)
HS Code Product Export (million US$) Share* (%)
2710 Petroleum oils and oils obtained from. 6028.95 3.41
2601 Iron ores and concentrates, including 4885.28 2.76
7102 Diamonds, whether or not worked, but 1787.18 1.01
8901 Cruise ships, excursion boats, ferry 1418.65 0.80
8525 Transmission apparatus for radio-tel 972.84 0.55
2304 Oil-cake and other solid residues, 936.62 0.53
5201 Cotton, not carded or combed. 633.60 0.36
7403 Refined copper and copper alloys, 632.10 0.36
7113 Articles of jewellery and parts the 618.36 0.35
8905 Light-vessels, fire-floats, dredger 576.04 0.33
2902 Cyclic hydrocarbons. 504.56 0.29
7202 Ferro-alloys. 494.47 0.28
0202 Meat of bovine animals, frozen. 478.85 0.27
7601 Unwrought aluminium. 439.35 0.25
8904 Tugs and pusher craft. 374.38 0.21
5205 Cotton yarn (other than sewing thread 333.19 0.19
3004 Medicaments (excluding goods 276.21 0.16
1005 Maize (corn). 264.86 0.15
2942 Other organic compounds. 244.15 0.14
1515 Other fixed vegetable fats and oils 237.29 0.13
*Share in India’s world export
Source: WITS based on UN COMTRADE
Table 3(c): India’s Import from ASEAN+3 in 2009:
Commodity Composition (Top 20Products)
HS Code Product Import (million US$) Share* (%)
8517 Electrical apparatus for line telephone 3627.19 1.36
1511 Palm oil and its fractions, whether 3497.26 1.31
8525 Transmission apparatus for radio-tel. 3224.59 1.21
2701 Coal; briquettes, ovoids and similar 2494.42 0.94
2709 Petroleum oils and oils obtained from 2245.77 0.84
2710 Petroleum oils and oils obtained from 2061.34 0.77
8471 Automatic data processing machines 1898.12 0.71
8708 Parts and accessories of the motor 1452.38 0.55
8542 Electronic integrated circuits and 1279.47 0.48
8901 Cruise ships, excursion boats, ferry 991.27 0.37
0713 Dried leguminous vegetables, shell. 984.35 0.37
8473 Parts and accessories (other than 977.36 0.37
8523 Prepared unrecorded media for sound 975.15 0.37
7208 Flat-rolled products of iron or non 964.48 0.36
2603 Copper ores and concentrates. 836.87 0.31
7102 Diamonds, whether or not worked 793.82 0.30
4403 Wood in the rough, whether or not 722.97 0.27
8529 Parts suitable for use solely or pr. 582.36 0.22
2941 Antibiotics. 550.46 0.21
8504 Electrical transformers, static con 537.16 0.20
*Share in India’s global imports
Source: WITS based on UN COMTRADE
104India’s trade with ASEAN+3 countries has been witnessing a compositional shift.
Traditionally, India’s export and import with ASEAN+3 countries are driven by
intermediate and capital goods respectively, in absolute term. However, over time,
ASEAN+3 countries have appeared as a major supplier of capital goods to India.
Today, ASEAN supplies half of India’s global imports in capital goods, the share
increased from about 42 percent in 2003 (Table 3(a)). Although India is a major
exporter of raw materials to ASEAN+3 countries (read, driven by China’s huge
import demand), India’s major achievement is export of capital goods to ASEAN,
which has increased from less than a billion in 2003 to over US$ 6 billion in 2009,
thereby contributing 1/4th of India’s global exports. ASEAN is also a bulk supplier of
intermediate goods to India. To a great extent, intermediate and capital goods are
driving the trade between India and ASEAN.9 Barring minerals and gems and jewelry,
commodities such as electrical machinery, transmission apparatus, cotton yarn, etc.
have emerged as important Indian exports to ASEAN (Table 3(b)). On the other,
India’s imports from ASEAN are primarily driven by electrical machinery, palm oil,
mineral fuels, etc. (Table 3(c)).
Unlike the European Union, East Asian integration has been market driven and
has followed a ‘hub and spoke’ process. With regional and bilateral FTAs, Asia has
now been witnessing an enlarged market. When trade barriers between countries have
been disappearing with varied pace, we expect a bigger market size in horizon.
ASEAN is a major trading partner for India and accounts for about 10 percent of its
global trade. With India-ASEAN FTA in goods in operation since January 201010,
expansion of market size may be achieved provided the trade liberalization is
complemented by effective trade facilitation on time.
Finally, regional cooperation has been in the forefront of India’s foreign policy.
India has signed FTAs with Korea, Japan, Malaysia, Singapore and Thailand in East
9
The usual disclaimer is that this may be subject to aggregation bias.
10
Under the ASEAN-India FTA, the ASEAN member countries and India have agreed to lift
import tariffs on more than 80 percent of traded products between 2013 and 2016, starting from
January 1, 2010. Also, tariffs on sensitive goods will be reduced to 5 percent in 2016, while tariffs
will be maintained on up to 489 items of very sensitive products. The agreement has provided
flexibilities to India and ASEAN countries to exclude some of the products from tariff concessions
or eliminations to address their respective domestic sensitivity. India, on its part, has excluded
489 items from the list of tariff concessions and 590 items from the list of tariff elimination to
address sensitivities in agriculture, textiles, auto, chemicals, crude and refined palm oil, coffee, tea,
pepper etc. ASEAN countries have also maintained similar exclusion list from the proposed tariff
concessions or eliminations.
105Asia. India’s several FTAs with some other countries are in the advanced stages of
negotiation. The signing and negotiating of these agreements with Asian countries
signal India’s firm commitment to its ‘Look East’ policy of building upon its historical
links with the countries of the East Asian region and further deepening and widening
the partnership. While India’s engagement with ASEAN is getting deeper, its two
regions occupy the prime axis, viz. India’s Southern and Northeastern regions. This
study discusses physical connectivity projects in these two regions in later part of the
study.
2-1. International Trade of Southern India
Southern India comprises four major states, namely, Andhra Pradesh, Karnataka,
Kerala and Tamil Nadu. All of them together present about 30 percent of India’s GDP,
40 percent of population and 30 percent of India’s surface area11. These states have
been playing an important role in India’s growth and development, of which Tamil
Nadu needs a special mention for its trade links with ASEAN.
The state of Tamil Nadu has an area of 130,058 sq. km and population of 72.13
million12 (2011 census, provisional numbers), recording population density of 555 per
sq. km. (against national average of 382). The decadal growth rate of the state is 15.6
percent (against 17.64 percent for the country). The state ranks 7thin terms of
population size. It is the most urbanized state in the country, with over 44 percent
population living in urban areas (2001 census).
Tamil Nadu is also one of the fastest growing states in India. In the last decade,
the state has grown at 13.2 percent per annum.13 It is one of the major industrialized
states in India, having three major seaports and one international airport. Along its
about 1000 km. coastline, there are 18 seaports, of which 3 are major and 15 are non-
major ports.14 In terms of the total value of foreign trade of Tamil Nadu, sea ports
contribute more than 90 percent of the total value of exports in 2008-09.
11
Calculated based on CSO’s National Accounts 2011, Population Census 2011 and Statistical
Abstract of Government of India, 2008, respectively.
12
Annual population growth for Tamil Nadu over 2001-2011 is 1.46 percent per annum (1.64
percent per annum for the country)
13
Measured in terms of average GSDP (Gross State Domestic Product) growth rate from 2001-02
to 2008-09; data taken from CSO.
14
The three major ports are Ennore, Chennai and Tuticorin and 15 non-major (minor) ports at
Cuddalore, Nagapattinam, Pamban, Rameswaram, Valinokkam, Kanyakumari, Colachel,
Kattupalli, Ennore, Thiruchopuram, PY-03 Oil Field, Thirukkadaiyur, Punnakkayal, Koodankulam
and Manappad.
106Table 4: Tamil Nadu’s Trade
Year Exports Imports
(US$ million)
1991-92 220.23 218.98
1992-93 224.62 238.53
1993-94 289.67 258.62
1994-95 396.84 399.43
1995-96 473.33 520.68
1996-97 495.67 421.59
1997-98 444.77 992.28
1998-99 446.19 558.18
1999-00 622.71 590.78
2000-01 256.91 411.99
2001-02 264.85 390.59
2002-03 517.38 737.61
2003-04 719.63 953.13
2004-05 774.11 1752.45
2005-06 1158.66 2551.93
2006-07 1496.28 3511.88
2007-08 2280.31 4725.55
2008-09 1973.19 5030.53
CAGR (%) 13.77 20.25
Source: Statistical Handbook, (various issues),
Department of Economics and Statistics, Tamil Nadu
Tamil Nadu’s exports have exhibited remarkable resilience and dynamism in
recent years. As shown in Table 4, Tamil Naidu’s exports reached a level of
US$ 1973.19 million in 2008-09. The exports recorded a CAGR of 13.77 percent
during the period from 1991-92 to 2008-09. Imports in 2008-09 were US$ 5030.53
million as against US$ 4725.55 million in 2007-08 registering a positive annual
growth of 6.45 percent. The compounded growth of Tamil Nadu imports during
1991-92 to 2008-09 was 20.25 percent (Table 4).
As given in Table 5 (a, b), the value of Tamil Nadu’s exports and imports through
seaports with ASEAN+3 countries picked-up momentum since the late 1990s.
Among the ASEAN countries, Tamil Nadu has active trade links with Malaysia,
Singapore, Philippines, Indonesia, Thailand and Vietnam. The active foreign trade
link with Malaysia and Singapore can be traced to the presence of substantial presence
of Tamil Diaspora in these countries. The value of exports to ASEAN+3 countries
through airports of Tamil Nadu is less compared to the same using the sea ports. On
the other, imports through seaports are mainly from China, Korea, Japan, Indonesia
107and Malaysia (Tables (5b) and 6(b)). Similar trend is observed in the case of imports
through airport from China. The growth rate of the value of imports through seaports
has been fluctuating in most of the years.
Table5(a):Exports through Tamil Nadu Seaports to ASEAN+3Countries
Year Indonesia Malaysia Philippines Singapore Thailand Vietnam China Korea Japan
(US$ million)
2000-01 12.79 20.36 1.18 6.56 4.18 2.95 43.26 0.52 36.68
2005-06 - 11.97 14.91 9.49 58.05 29.14 140.49 95.54 61.21
2006-07 8.61 24.73 31.36 54.99 54.76 28.04 149.72 116.37 70.88
2007-08 39.26 38.52 51.44 63.62 75.30 59.89 132.95 113.57 46.97
2008-09 100.62 50.96 85.59 106.50 83.19 72.74 164.21 207.98 43.77
Source: Statistical Handbook, (various issues), Department of Economics and Statistics, Tamil Nadu
Table 5(b): Imports through Tamil Nadu Seaports from ASEAN+3 Countries
Year Indonesia Malaysia Philippines Singapore Thailand Vietnam China Korea Japan
(US$ million)
2000-01 22.24 61.00 - 35.43 4.74 - 60.76 79.53 118.54
2005-06 376.75 129.20 - 277.59 244.84 - 728.65 601.04 270.59
2006-07 496.63 734.90 16.56 375.40 151.49 - 636.19 558.91 246.44
2007-08 791.48 829.75 14.91 468.18 174.20 - 2224.10 575.04 281.80
2008-09 679.92 644.64 52.27 543.15 153.32 2.61 1960.93 953.24 251.32
Source: Statistical Handbook (various issues), Department of Economics and Statistics, Tamil Nadu
Table 6(a): Exports through TamilNaduAirports to ASEAN+3 Countries
Year Indonesia Malaysia Philippines Singapore Thailand Vietnam China Korea Japan
(US$ million)
2000-01 - 1.64 0.03 9.77 1.41 - 0.44 11.10 6.06
2005-06 3.84 2.48 - 7.23 - 10.16 16.94 18.30 4.97
2006-07 1.99 - - 1.77 2.65 9.50 11.26 14.80 6.85
2007-08 1.99 - - 17.40 8.45 15.66 32.31 18.89 3.48
2008-09 4.14 - - 9.36 5.44 14.59 26.57 11.98 4.79
Source: Statistical Handbook, (various issues), Department of Economics and Statistics, Tamil Nadu
Table 6(b): Imports through TamilNaduAirports from ASEAN+3 Countries
Year Indonesia Malaysia Philippines Singapore Thailand China Korea Japan
(US$ million)
2000-01 - 0.10 - 57.68 53.58 3.48 1.15 17.43
2005-06 2.71 13.10 - 260.87 - 217.51 210.73 35.91
2006-07 9.49 45.05 - 172.02 - 378.71 68.45 36.87
2007-08 4.72 72.07 - 368.28 10.18 808.37 62.37 48.45
2008-09 3.92 47.04 - 325.80 - 781.19 108.02 59.01
Source: Statistical Handbook (various issues), Department of Economics and Statistics,
Tamil Nadu
108Table 6: Export Intensity of Selected Products of Tamil Nadu (2007-08)
Products Share of Tamil Nadu in
India (%)
Electronic hardware and IT
software 10.64
Engineering goods 11.05
Textile and garments 18.30
Leather and leather goods 33.00
Agro and processed goods 5.52
Chemical and allied products 10.95
Ores and minerals 18.30
Marine products 21.15
Source: Tamil Nadu Guidance Bureau Statistics
Exports from Tamil Nadu consists of both labour-intensive and technology-
intensive goods. The main items of export through seaports are food products,
tobacco and beverages, metals, minerals and fuel, leather, pharmaceutical products,
chemicals, rubber and plastic, non-metallic mineral products, basic metals and alloys,
transport equipment, textile products, wood and paper products, and cotton. In case of
export, the major commodity exported through seaport is the transport equipment.
This is not surprising, since Tamil Nadu is the fast becoming the major destination of
automobile and components manufacturers of the world. The major items of labour
intensive exports are textiles and leather. On the international textile sector, Tamil
Nadu has gained a prominent place. In contrast, the value of exports through airports
of Tamil Nadu is much less. Among the commodities, exports of leather ranks first,
followed by textiles. The same trend was visible earlier that exports through seaports
dominate the trading activities from Tamil Nadu. The estimated export intensity
indices in Table 6 suggest Tamil Nadu is one of the leading exporters of textiles,
leather and marine products from India.
Tamil Nadu has recorded a healthy growth in both exports and imports. Besides
Chennai seaport, other ports like Tuticorin and Ennore are emerging as key facilitators
of trading activities in Tamil Nadu. Tamil Nadu has also established strong trade links
with some of the ASEAN countries like Singapore, Malaysia, and Indonesia. The key
challenge in Tamil Nadu’s trade is to increase its exports. To address this challenge,
Tamil Nadu has to improve its trading infrastructure, both hardware and software. It,
therefore, provides a lot of scope for setting up infrastructure facilities in the state
such as special economic zone (SEZ).
1092-2. International Trade of Northeastern India
India’s North Eastern Region (NER) and West Bengal state links India’s eastern
neighbours such as Bangladesh, China and Myanmar with rest part of India. The
NER comprises of eight states, namely, Arunachal Pradesh, Assam, Manipur,
Meghalaya, Mizoram, Nagaland, Sikkim and Tripura. Before the partition of the
Indian subcontinent in 1947, the NER was linked with the rest part of India through
present day Bangladesh. The multimodal communication channels between the NER
and rest of India used to run through Bangladesh plain. Following the partition, these
traditional channels of communication got disrupted making the NER a land-locked
territory in India. In post-partition India, the NER is connected with the rest of India
through the narrow “Chicken’s Neck” (popularly known as Siliguri Corridor) which
has widened the geographical distance between the NER and eastern entry port of
India - Kolkata. Although the NER is rich in resources like hydrocarbons, forest,
hydro-electricity, and other minerals, high transportation cost did not allow her to
grow according to her comparative advantages. The connectivity bottlenecks have
made the region perpetually underdeveloped and hence politically volatile.15
Barring Sikkim, per capita income of most of the NER states is lower than that of
national average. The slow progress of NER’s economy is reflected in the low growth
in income. However, the NER is unique in terms of opportunities. While it is an
industrial desert where almost all immediate consumables are imported from outside
the region, it is the focal point of trade within a vast area. About 98 percent of this
region’s borders form India’s international boundaries; it shares borders with the
China in the north, Bangladesh in the southwest, Bhutan in the northwest, and
Myanmar in the east. NER’s locational advantage and rich natural resources provide a
backdrop to its development as a base for cooperation not only with ASEAN, but also
with neighboring countries such as Bangladesh, Bhutan, and Nepal. And through
Myanmar, regional cooperation centering the NER can be extended to Mekong region,
comprising Cambodia, Lao PDR, Thailand, and Viet Nam.
15
Refer, for example, Bhattacharya and De (2006), and De (2008).
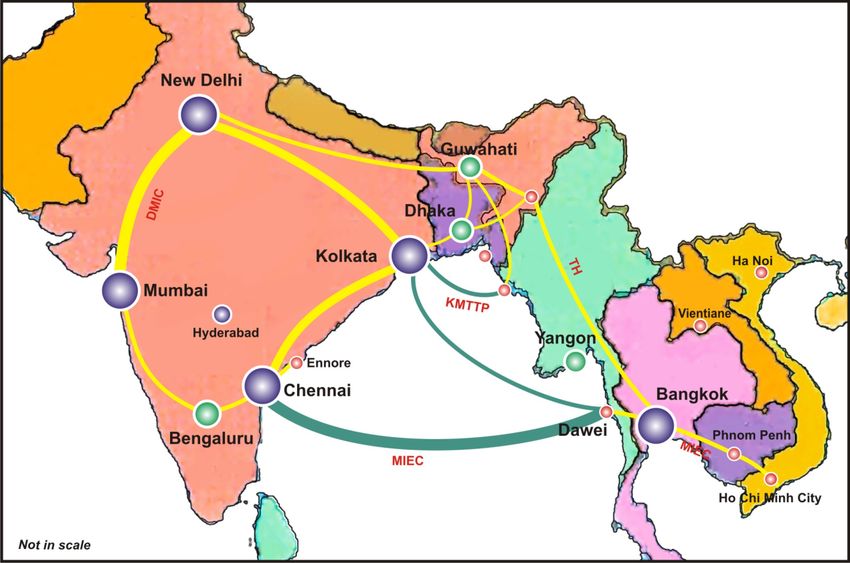
110Figure 2: NER as India’s Gateway to East
Source: RIS (2011)
Since early 1990s, with the adoption of Look East Policy (LEP), India-Myanmar
engagement has been growing on substantive ground and is increasingly being
structured. Myanmar is the land-bridge that connects world’s two largest markets –
South and Southeast Asia. Figure 2 presents the region’s strategic location in the
backdrop of India’s growing engagement with her eastern neighbors. NER is,
therefore, an important region that geographically links India with ASEAN.
India’s change in policy towards Myanmar has paid a rich dividend. Trade
between the two countries increased heavily in last decade, allowing Myanmar to get
higher market access in India. Figure 3 shows an overview of the region’s trade
linkages with neighbouring Myanmar and Bangladesh. However, composition of
Indian imports from Myanmar has not changed much over time. India’s trade with
Myanmar witnessed a higher growth in the last decade, which indirectly suggests
existence of a large trade potential between the two countries.
111Figure 3: Functional Classification of Trade in NER
Transit -Trade Links
NER Finished goods Myanmar
Finished goods
Resources
China,
Thailand
Bangladesh
Resource –
Industry Links
Source: RIS (2011)
2-2-1. Trade Flows between NER and Bangladesh
India and Bangladesh share about 4091 km long international borders. Out of
which the NER shares almost 1880 km border with Bangladesh (wherein 1434 km is
land border and 446 km is riverine tract). Four states of the NER, namely, Assam,
Meghalaya, Tripura, and Mizoram, share international borders with Bangladesh.
However, a large part of this international border with Bangladesh is porous.
The first Trade Agreement between India and Bangladesh was signed in 1972.
The India-Bangladesh Trade Agreement (IBTA) has been renewed for a period of
three years up to March 31, 2012. It governs the present trading arrangements
between the two countries. To facilitate the NER-Bangladesh border trade in goods
and services, the Government of India through the Office of the Commissioner of
Customs in Shillong has setup 26 Land Customs Stations (LCS) along the NER-
Bangladesh borders, of which, 20 are functional and remaining 6 are non-functional
LCSs.
Out of the four NER states having international borders with Bangladesh, except
Mizoram, the NER-Bangladesh trade mainly flows through Assam, Meghalaya and
Tripura. A 2-year average (2006-08) of the NER-Bangladesh trade shows that the
112share of Meghalaya in the NER-Bangladesh trade is the highest (Table 7). The
contribution of Meghalaya to the total volume of the NER-Bangladesh trade stands at
63.83 percent; the same for Tripura and Assam are 18.26 and 17.91 percent
respectively. While both Assam-Bangladesh and Meghalaya-Bangladesh trade are
characterized by higher export and negligible import, Tripura-Bangladesh trade
exhibits just opposite trends, i.e., higher import and lower export.
Table 7: NER-Bangladesh Border Trade Volume
States Volume (2-years Share in Total
Average, 2006-08) Trade
(US$ million) (%)
Assam 15.66 17.91
Meghalaya 55.82 63.83
Tripura 15.97 18.26
NER total 87.46 100.00
Source: RIS based on Office of the Commissioners of Customs, Shillong
Trade between NER and Bangladesh is uneven and not diversified. The official
trade between NER and Bangladesh is concentrated in agricultural commodities,
processed foods, minerals and garments. While the NER’s export to Bangladesh is
dominated by raw materials like coal, limestone, boulders and agro-horticultural
products like ginger and citrus fruits, import from Bangladesh is mostly finished
goods like cement, synthetic fabric, readymade garments, and processed food. The
NER’s export products to Bangladesh are distinctly different from major export lines
from the rest part of India to Bangladesh. A quick look at the product-wise trade
between the NER and Bangladesh indicates complementarities between the resource
structure of the NER and demand structure of Bangladesh (Figure 3).16 Bangladesh
lacks in mineral resources like coal and limestone which the country imports from the
NER. Due to weak resource industry-linkages, manufacturing base of the NER
remained underdeveloped and hence in return the NER imports manufacturing goods
from Bangladesh. This provides a firm basis for trade expansion between the two
regions.17
16
This was also widely discussed in Das and Thomas (2008).
17
According to Brunner (2010), export potential lies in food or fruit processing, bamboo and cane
products, jute, floriculture, aromatic plants, aromatic and medicinal herbs, spices, rubber, forest
products, natural resource products, tea and other plantation crops, inland freshwater fishing,
among others.
1132-2-2. Trade Flows between NER and Myanmar
India and Myanmar share a common border of 1,643 km. Four states of the NER,
namely, Arunachal Pradesh, Manipur, Mizoram, and Nagaland, shares international
borders with Myanmar. However, a large part of this international border with
Myanmar is porous, mountainous and inhabited. Till date, four LCSs are in operation,
serving the trade between the two countries, of which Moreh in Manipur is the busiest
LCS, handling almost 99 percent of the NER’s trade with Myanmar.
In general, India-Myanmar border trade mainly flows through Moreh in Manipur
state. In the last decade, NER’s average annual export to Myanmar was about
US$ 2.36 million, whereas the average annual import from Myanmar was US$ 1.88
million. It contributed a miniscule 2.08 percent and 0.49 percent in country’s total
export to and import from Myanmar respectively in the last decade (Table 8). In
US$ term, while Indian export and import with Myanmar witnessed a massive 76
percent and 116 percent, respectively in the last decade, the same from the NER faced
consistently negative growth in the same period.18 Unlike the NER-Bangladesh trade,
the NER’s trade with Myanmar has always remained less than a percent of India’s
total trade with Myanmar since opening of LCS at Moreh in 1995. Moreh in Manipur
is the largest LCS handling about US$ 3.59 million India-Myanmar merchandise trade,
of which export and import contribute 41 percent and 59 percent respectively.
Therefore, border trade potential between India and Myanmar is yet to be realized.
18
However, in Indian rupee term, NER’s export to Myanmar witnessed positive growth, but the
NER’s import from Myanmar couldn’t escape negative growth rate in the last decade.
114Table 8: NER’s Trade with Myanmar+
Indian NER
Year# Indian import NER import NER Share* (%)
export to from export to from
Myanmar Myanmar Myanmar Myanmar
(US$ million) Export Import
2000 48.05 179.18 1.23 2.75 2.56 1.53
2001 53.05 197.81 0.26 1.61 0.49 0.81
2002 71.53 345.64 1.03 2.43 1.44 0.70
2003 86.00 390.77 2.02 1.90 2.35 0.49
2004 104.71 400.05 1.43 1.19 1.37 0.30
2005 111.32 495.95 0.88 1.18 0.79 0.24
2006 132.72 718.40 13.52 0.59 10.18 0.08
2007 174.02 802.79 0.75 3.26 0.43 0.41
2008 212.23 893.92 1.06 1.79 0.50 0.20
2009 209.78 1195.26 1.47 2.12 0.70 0.18
Average** 120.34 561.98 2.36 1.88 2.08 0.49
CAGR (%) 75.96 115.83 -14.51 -194.96
*Share in India. **Average for the period 2000-2009. +NER export and import consider trade through
Moreh only. #Trade data for India counts calendar year while the same for NER consider financial year.
Sources: IMF for India’s trade with Myanmar, and Indian Customs for NER’s trade with Myanmar.
Table 9: Facilities at the Moreh LCS*
Facility Available (Y) Not Available (N)
Food testing laboratory N
Availability of electricity N
Telephone Y
Internet N
EDI (Icegate) N
Weighbridge N
Warehouse N
Cold storage N
Parking place Y
Transshipment platform / Transit sheds N
Secretarial assistance (fax, photocopy etc.) N
Drinking water N
Drivers’ rest room Y
Health centre N
Hotels and restaurants N
Separate entry and exit gates N
Banks Y N
Courier / Post Office N
Servicing centre / Vehicle repair shops N
Source: RIS (2011).
115There are a lot of differences in the commodity compositions of trade in the
Moreh LCS. Important commodities being imported from Myanmar consist of betel
nuts, dry ginger, pulses, whereas Soya bari, Cumin seed, Soya grid and skimmed milk
powder are some major exported items. 19 The formal trade volume at Moreh is
appeared to be less than the informal trade volume. 20 With the change in demand
pattern in both sides of the border, trade at Moreh LCS is carried out more in negative
list items than the positive list items. While a formal trade at Moreh shows trade in
traditional primary goods, informal trade, if factored in, indicates a compositional
change in border trade that has undergone between the two countries. Barter trade of
22 agreed items has lost its relevance while the normal or regular trade has gained the
popularity over time. One of the primary reasons for a low level of border trade at
Moreh LCS is perhaps the unfavourable trading environment. Trade at Moreh LCS
suffers not only due to lack in modern trade infrastructure, both hardware and
software, but also due to the absence of adequate security, thus making the entire trade
very unsecured. Table 9 provides a list of infrastructure facilities available at Moreh
LCS. On top, the unfriendly exchange rate between India and Myanmar prohibits the
formal trade to grow, resulting which governments in both sides are losing revenue.
2-2-3. Trade Flows between NER and China
The re-opening of the border trade with China at Nathu La in Sikkim state of
India is a significant achievement in strengthening the relationship between the two
countries. Nathu La is historically a very important border in respect of trade with
Tibet Autonomous Region of China. 21 Border trade through Nathu La formally
resumed on 6th July 2006.22
Trade at Nathu La is carried out in liberal terms. For example, Import-Export
19
In terms of value also the trade at the LCS is a miniscule of the estimated value of informal
trade occurring at Gate No. 2 connecting Moreh to Namphalong in Myanmar.
20
The total volume of trade at Moreh is certainly more than official trade of Rs. 150 million. A
quick estimate shows total trade including informal volume is about Rs. 2800 million (Source:
RIS). This does not include the clandestine trade in drugs and small arms whose value also would
be substantive.
21
Border trades have been started more than one decade back at Sipkila in Himachal Pradesh and
Gunji in Uttaranchal with a restricted list of items.
22
The corresponding Chinese site is Renqinggang. Border trade markets remain open from
Monday to Thursday every week from 7:30 am to 3:30 pm in Indian time and 10 am to 6 pm in
Chinese time.
116Code (IEC) is not required for the border trade because persons importing or
exporting from/to China are authorized to trade in Indian currency value of Rs.
100,000 per day per trader. The issue is the list of permissible items of trade. The
permissible list is comprised of 29 export items from India to China and 15 export
items of China to India. It is clear to us that the list of permissible items is driven
purely by the local need. As a result, the volume of trade has been small. In 2009,
about US$ 9000 was the total trade at Nathu La between India and China (Table 10).
Therefore, border trade is yet to take a good shape between India and China.
Table 10: NER-China Border Trade at Nathu La
Period Export from Import from Visit of Indian Visit of Chinese
India to China to India traders to Traders to
China trade mart at trade mark at
Renquingang Sherathang
(China) (India)
(US$)
7th July to 29th 19,567.62 23,891.46 696 1253
September 2006
1st May to 29th 67,498.18 16,662.63 2117 3701
November 2007
19th May to 27th 21,8793.2 3,109.166 1034 3948
November 2008
1st May to 30th 2,791.563 6,120.761 Data not available
November 2009
Source: RIS based on Department of Industries, Sikkim Government
To conclude, the pattern of India-Bangladesh border trade that flows through the
NER-Bangladesh sector is characterized by resource-industry linkages. The rationale
of the trade lies in free trade principle. Some critical minerals which are available in
the NER but not available in Bangladesh provide the basis of the NER-Bangladesh
trade. What follows is that NER’s export products to Bangladesh are distinctly
different from major export lines from the rest of India to Bangladesh. The product-
wise trade between the NER and Bangladesh indicates complementarities between the
resource structure of the NER and demand structure of Bangladesh. Bangladesh lacks
in mineral resources like coal and limestone which the country imports from the NER.
Due to weak resource industry-linkages, manufacturing base of the NER remained
underdeveloped and hence in return the NER imports manufacturing goods from
Bangladesh. This provides a firm basis for trade expansion between the two regions.
Border trade between India and Myanmar has not progressed further since
117opening of the Moreh LCS in 1995. Trading environment between India and
Myanmar is unfavorable and not supporting the border trade. Unlike the NER-
Bangladesh trade, the NER’s trade with Myanmar has always remained less than a
percent of India’s total trade with Myanmar. Barter trade of 22 agreed items has lost
its relevance while the normal or regular trade has gained popularity over time. One
of the primary reasons for low level of border trade at Moreh LCS is perhaps the
unfavourable trading environment in general and unfriendly currency arrangement in
particular. Trade at Moreh LCS suffers not only due to lack in modern trade
infrastructure, both hardware and software, but also absence of adequate security, thus
making the entire trade very unsecured. On top, the unfriendly exchange rate between
India and Myanmar prohibits the formal trade to grow, resulting which government is
losing revenue. In a sense, the border trade potential between India and Myanmar is
yet to be realized.
The re-opening of border trade with China at Nathu La in Sikkim state of India is
a significant achievement in recent years. Contrary to popular belief, border trade
with China is carried out on limited items only which are purely driven by the local
need. As a result, volume of trade between India and China at Nathu La has not been
grown much since reopening of the border trade in 2006.
3. CONNECTIVITY AND INDUSTRIAL CLUSTERS IN TAMIL NADU
Tamil Nadu is one of the industrialized states in India. The state has a well-
developed network of roads, railways and air services, and is an important maritime
state of the country. Chennai is considered as the gateway to southern India.
Tamil Nadu has a road network covering about 153 km per 100 sq.km. area,
significantly higher than the country's average road network coverage of 103 km per
100 sq.km. area23. It has 4,873 km of the National Highways, 9,384 km of the state
highways, 11,288 km of the major district roads, 61,641 km of the other district roads,
and 137,399 of rural roads. Tamil Nadu has 27 National Highways and is an
important terminus on the Golden Quadrilateral project of the National Highway
Authority of India (NHAI).
23
Demand No-21, Policy Note on Roads, Bridges (2010-2011), Highways and Minor Ports
Department, Government of Tamil Nadu.
118Tamil Nadu also has a well-developed railway network with 541 railway stations
and the same falls under the jurisdiction of Southern Railways. The state has a total
of 4,106 route km of railway network, out of which nearly 1,235 route km is
electrified as on December 2009.24 Out of the total, nearly 78.5 percent network is
broad gauge and the balance meter gauge. The railway network connects the state
with most of the major cities in India. Main rail junctions in the state include Chennai,
Coimbatore, Madurai, Tiruchirapalli (Trichy) and Salem.
Table 11: Commodity-wise Port Traffic of Major Ports of Tamil Nadu
POL Crude
Major Ports Period IronOre Fertilizer Coal Container Others Total
& Product
(million tonnes)
2009-10 0.39 0.94 0.00 9.28 0.00 0.09 10.70
Ennore
2008-09 0.36 1.11 0.00 9.71 0.00 0.32 11.50
2009-10 13.32 8.03 0.61 3.06 23.48 12.56 61.06
Chennai
2008-09 13.13 8.36 0.78 4.10 20.58 10.54 57.49
2009-10 0.51 0.04 2.08 5.60 6.60 8.96 23.79
Tuticorin
2008-09 0.50 0.00 1.83 5.71 5.48 8.49 22.01
All Indian 2009-10 175.08 100.33 17.72 71.71 101.24 95.01 561.09
Major ports 2008-09 176.14 94.04 18.22 70.40 93.14 78.59 530.53
Source: Ministry of Shipping, Government of India
Along its coastline of 1,076 km, Tamil Nadu has three major ports (Chennai,
Ennore and Tuticorin) and 20 minor (non-major) ports.25 All minor ports in the state
are anchorage ports without berthing facilities. Thus, cargo is transshipped from the
vessels at mid-stream to the shore and vice-versa through barges. Considering the
high growth expected in the future, major capacity up gradation works are being
implemented or are being planned at both, major and minor ports in the state. The
current commodity-wise traffic handled at these ports is given in Table 11.
In the year 2010-11, the three major ports in Tamil Nadu handled about 98.2
million tonnes (MT) of cargo, which is about 17.2 percent of the total traffic of all
major ports in India. While total cargo at all Indian ports together witnessed a meager
growth of 1.57 percent over the period 2009-10 to 2010-11, the ports of Chennai,
Ennore and Tuticorin registered the cargo growth of 2.86 percent, 0.66 percent and
24
Ministry of Railways (Railway Board), Government of India
25
Government Ports: Cuddalore, Nagapattinam, Pamban, Rameswaram, Valinokkam,
Kanyakumari, Colachel. Captive Ports: Kattupalli, Ennore (Minor), Mugaiyur, Thiruchopuram,
Silambimangalam, Shipyard port, P Y-03 Oil Field, Kaveri Port, Vanagiri Port, Thirukkadaiyur,
Thirukkuvalai, Punnakkayal, Manappad, Koodankulam. Ports under consideration: Cheyyur
(Panaiyur), Parangipettai, Udangudi
1198.16 percent respectively. Chennai port was the busiest amongst the major ports in
Tamil Nadu, and in the year 2009-10, catered to nearly 10.9 percent of the total cargo
handled by all Indian ports together. According to the Ministry of Shipping, the
capacity of Chennai, Ennore and Tuticorin ports as on March 2010 was 71.32 million
tonnes, 16 million tonnes and 23.72 million tonnes respectively, indicating fairly high
utilization rates, whereas the current capacity of all Indian ports together is 628.03
million tonnes.26 The share of traffic catered by non-major ports in the state of Tamil
Nadu is low in comparison to traffic catered by all non-major ports in India. In 2009-
10, non-major ports in the state catered to 1.17 million tonnes (0.4 percent of all non-
major ports traffic).
Table 12: Trade links with EAS Countries through Chennai Seaport in 2010
Export Import
Country No. of Share No. of Share
Singapore 11858 7.159 516061 24.775
Malaysia 7830 4.727 15263 0.733
Australia 5921 3.575 2991 0.144
China 4111 2.482 232753 11.174
Japan 3604 2.176 315715 15.157
Thailand 1808 1.092 122739 5.892
Hong Kong, China 1696 1.024 76717 3.683
Taiwan, China 1228 0.741 39512 1.897
South Korea 1081 0.653 307738 14.774
Indonesia 1052 0.635 8997 0.432
Vietnam 632 0.382 1744 0.084
Philippines 455 0.275 1298 0.062
Myanmar 359 0.217 5 0.000
Cambodia 48 0.029 0 0.000
New Zealand 21 0.013 2 0.000
EAS total 41704 25.178 1641535 78.81
Rest of World 123931 74.822 441450 21.19
Total through Chennai seaport 165635 100.000 2082985 100.000
Source: RIS based on Chennai Customs
In terms of shipping linkages with India’s partner countries, Chennai seaport has
truly emerged as India’s gateway port to ASEAN and East Asia. This port handled
about 79 percent of import vessels in 2010 which originated in the EAS region (Table
12). In export, about 25 percent of the cargo vessels originated at this port for the
EAS region.
26
Transport Research Wing, Ministry of Shipping, Government of India.
120You can also read