ROLE OF RESEARCH IN DESTINATION MARKETING - TTRA International Conference Melbourne, Australia June 2019 Craig Gibbons Regional Director ...
←
→
Page content transcription
If your browser does not render page correctly, please read the page content below

ROLE OF RESEARCH IN
    DESTINATION MARKETING
     TTRA International Conference
     Melbourne, Australia
     June 2019

       Craig Gibbons
       Regional Director, Australia

Los Angeles Tourism & Convention Board
TRAVEL TRADE
INTERNATIONAL
                                             TEAM STRUCTURE

                                         •   Hybrid of dedicated offices and representation

                                         •   Team of 28: 13 HQ in Los Angeles and 15
                                             worldwide

                                         •   Offices in London, Sydney, Beijing, Shanghai,
                                             Guangzhou and Chengdu

                                         •   London overseas representation in Germany,
                                             France, Scandinavia and Gulf/Middle East

                                         •   HQ oversees representation in India, Japan, S.
                                             Korea, Canada and Mexico

Los Angeles Tourism & Convention Board                                                        2
WHAT DIFFERENTIATES L.A. TOURISM?
•   Thorough Understanding of aviation, travel and international marketing sectors

•   Airline Experience working for U.S. and international carriers and direct experience partnering with
    airlines

•   Collective Marketing Expertise in advertising, public relations/ communications, digital marketing
    and travel promotions

•   In-Market Experience with understanding of economic and governmental impacts and
    regulatory practices

•   Based in Key International Markets

Los Angeles Tourism & Convention Board
                                                                                                  3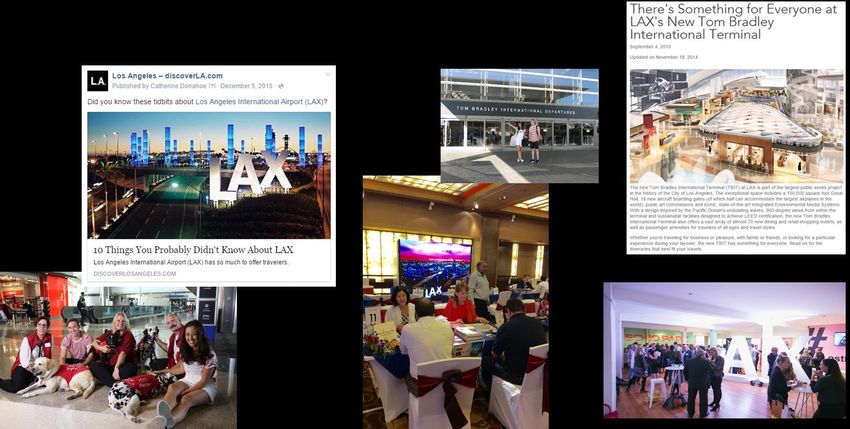
INTERNATIONAL FOOTPRINT

Los Angeles Tourism & Convention Board   4
AUSTRALIA TACTICS
• Online Training
• General Tradeshows
• Sales Missions/Road Shows
• E-Communications
• Training
• Familiarization Trips
• Co-Ops
• Individual Tradeshow Support (i.e. Flight Centre)

                                                      5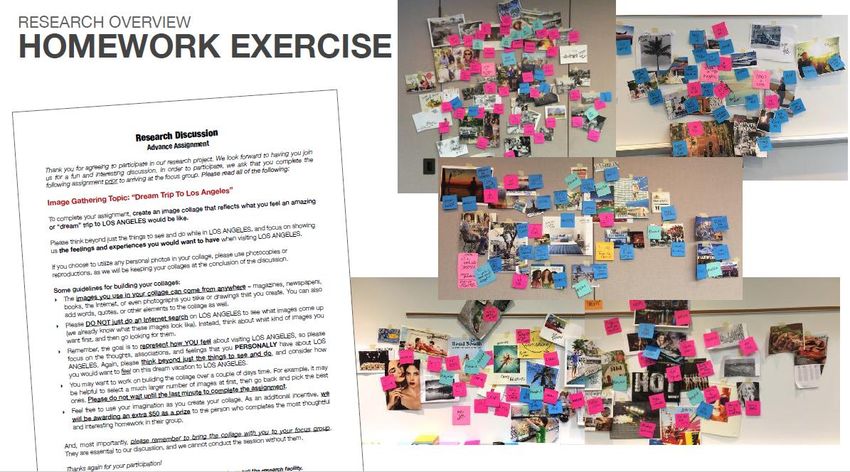
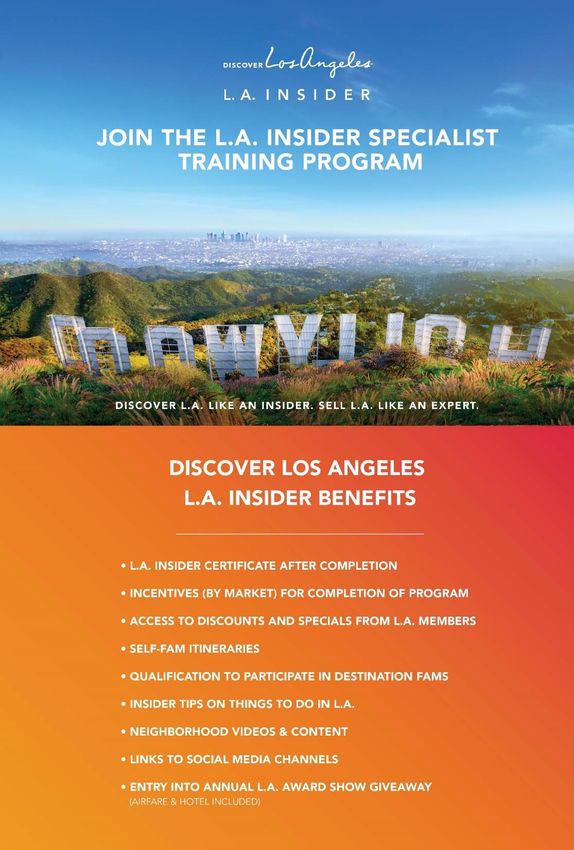
L.A. INSIDER SPECIALIST
                                         TRAINING PROGRAM
                                         • Celebrating 1 Year (launched February 2018)

                                         • English Modules: USA/Canada, Australia, India,
                                           UK/Scandinavia/Middle East (4)

                                         • Translated Modules: Spanish, German, French, Japanese,
                                           Korean China “Angel Academy” – WeChat Platform (6)

                                         • L.A. Insider: 10,191 registered travel trade / 4,700
                                           completed

                                         • 30 sales incentive campaigns since July 2018

Los Angeles Tourism & Convention Board                                                              6
L.A.       I n s i d e r – C o m p l e t e d Tr a i n i n g s
                       (since Feb 2018)

 Australia &       USA &      Mexico      Middle East &   Korea
New Zealand       Canada                  Scandinavia

  France           India      Germany      UK & Ireland   Japan

                                                                  7
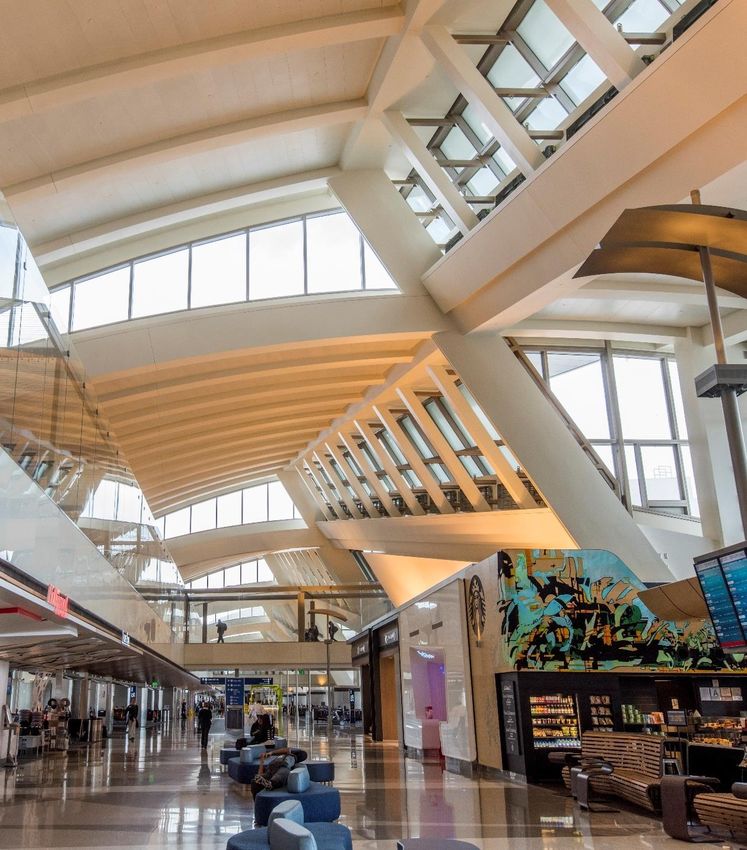
LAX

LAWA – LAX MARKETING

Los Angeles Tourism & Convention Board   9
LAX MODERNIZATION

Los Angeles Tourism & Convention Board   10
ROLE OF RESEARCH IN
  DESTINATION MARKETING
   TTRA International Conference
   Melbourne, Australia
   June 2019

  Wendy Kheel
  Vice President, Tourism Insights
Los Angeles Tourism & Convention Board
VISITOR PROFILES
AUSTRALIA
        Market Conditions                           Changes in Laws/Policies                             Competitive Landscape

                                             Australians to face new credit lending barriers:      •   The U.S. remains the #1 long-haul
GDP Forecast – 2.5% in 2019 & 2.5% in 2020
                                                                                                       destination for Aust/NZ travelers.
                                             •   Australians will find it harder to get a credit
                                                 card from 2019, with sweeping changes             •   CA is facing increasing competitive
Exchange Rate – 1 Aust $ = 0.72 U.S. $           coming into effect to mitigate                        pressures. Now, LAX & SFO are just two
                                                 irresponsible lending.                                of a number of ports with non-stop
                                                                                                       flights available with new gateways
                                             •   Under the changes, customers who sign                 such as Houston & Dallas with other U.S.
                                                 up for new cards will have to prove they              ports expected to be announced.
                                                 can repay the full balance within a three-
                                                 year period.                                      •   There are now over 25 U.S. destinations
                                                                                                       with representation in Australia.
                                             •   Experts say the restrictions can help card
                                                 users from running into debt but will make        •   2018 has seen the re-emergence of the
                                                 it harder for new customers to be issued a            U.K. & Europe as an increasingly
                                                 credit card.                                          competitive threat. With terror levels
                                                                                                       subsiding and airline competition
                                             •   The latest RBA figures show Australians               increasing, the Europe is becoming top
                                                 owe a massive $51.5 billion on credit cards           of mind for travelers.

    Los Angeles Tourism & Convention Board                                                                    Source: Tourism Economics ;Visit California
AUSTRALIA
Population Household Income
Population of Select Countries & Cities in 2019 Sydney 2019 Average Household Income $114,700
% of City to
Country & City 2019 Population Sydney Households by Income Band
Country
60% 46% 40%
Total Australia 24,981,000 40% 14%
Sydney 5,309,000 21.3% 20%
0%
Melbourne 5,058,000 20.2% Lower Middle Upper
Sum of Key Cities 10,367,000 41.5% ( < $35k) ( $35k - $100k) ( > $100k)
Other 14,614,000 58.5%
Melbourne 2019 Average Household Income $88,600
Melbourne Households by Income Band
53%
60%
40% 19% 28%
20%
0%
Lower Middle Upper
( < $35k) ( $35k - $100k) ( > $100k)
Los Angeles Tourism & Convention Board Source: Tourism Economics City to City Data, United NationsAUSTRALIA TO THE USA
Travel Outlook Deterrents to Visiting the USA What One Word Best Describes The USA
USA Is Too Expensive - 38.2%
Days Available for Unfavorable Currency Exchange Rate – 30.0%
International Travel 19.3 Better Destinations Exist – 24.1%
Concerns About My Personal Safety in the USA – 23.2%
Most Important Content for I Don’t Have Enough Holiday Time – 17.8%
Destination Decision
Desired U.S. Vacation Experiences
Hotels & Lodging 38.5% Visit Famous/Iconic Landmarks – 67.3%
Sightseeing in Cities – 61.4%
Relaxation – 60.4%
Restaurants & Food 31.1%
Visiting Historical Sites – 58.5%
Desired Lodging Types
Sightseeing Tours 29.5%
Full Service (4 or 3 Star) – 59.4%
Mid-Priced (2 star) – 29.5%
Transportation &
28.9% Bed & Breakfast – 20.2%
How to Get Around
Vacation Home or Apartment – 18.0%
Los Angeles Tourism & Convention Board
Source: Destination Analysts “The State of the International Traveler” May 2018AUSTRALIA TO L.A.
Airlift Visitation
2019 Average Non-Stop Weekly Flights to L.A. L.A. County Visitation
Weekly Year Volume +/- Change % Change
Departing City Weekly Seats
Flights 2017 418,000 -3,000 -0.7%
Sydney 33 10,970 2018 426,000 8,000 2.0%
Melbourne 21 7,230 2019f 438,000 12,000 2.7%
Brisbane 16 4,35 2020f 447,000 9,000 2.2%
Total Australia 70 22,550 2021f 457,000 10,000 2.2%
2022f 472,000 15,000 3.2%
2023f 487,000 15,000 3.3%
2019/18 Seat Capacity Growth – -3.5%
2019/18 Decreased Service – 2019f Australian Visitation by City
- United from Sydney 60% 51%
- Qantas from Melbourne 40% 26% 23%
- Virgin Australia from Brisbane 20%
0%
Sydney Melbourne Other
Source: OAG, Tourism Economics January 2019
Los Angeles Tourism & Convention BoardAUSTRALIA TO L.A.
Demographics L.A. Travel Details U.S. Destinations Visited on Same Trip
Las Vegas 40%
Average Age 37.7
Average Party Size 1.9 San Francisco 32%
New York City 31%
Anaheim 19%
First-Time Visitor to U.S. 33%
Average HHI DC 13%
$104,314
U.S. Average Length 0% 10% 20% 30% 40% 50%
20.7
of Stay Nights
Primary Reason for Recent L.A. Trip Most Popular Trip Months
3% L.A. Average Length 5.5 15.0%
of Stay Nights 9.8% 9.6%
9% 9.5%
10.0%
Leisure
Business Average # of U.S.
3.6 5.0%
Destinations Visited
Other
0.0%
88%
December April June
Los Angeles Tourism & Convention Board Source: U.S. Department of Commerce, NTTO / APISAUSTRALIA TO L.A.
Top Resources Used to Plan Trip Advance Planning for Trip Timing of Booking L.A. Trip (Airline)
< 7 Days 3% < 7 Days 3%
Airlines OTA 8-30 Days 7% Average 8-30 Days 11% Average
52% 47% Planning Time Booking Time
31-60 Days 12% 184 Days 31-60 Days 17% 126 Days
61-90 Days 14% 61-90 Days 16%
Personal Travel
Recommendation Agency > 3 Months 64% > 3 Months 53%
44% 43%
0% 20% 40% 60% 80% 0% 20% 40% 60%
Travel Companions* Modes of Transportation in U.S. Place of Stay
Alone 49%
Spouse/Partner 31% Airlines Taxi/Limo Paid Lodging 84%
64% 48%
Family/Relatives 20%
Friends 8% VFR 16%
Tour Group Ride
1% Subway/Bus
Sharing
Business Assoc. 43%
1% 45%
Mean Nights In Paid Lodging - 4.7
0% 20% 40% 60%
Los Angeles Tourism & Convention Board *Note- The SIAT question asked is “With whom are
you traveling now” which may skew the “Alone” Source: U.S. Department of Commerce, NTTO
and “Tour Group” travel companion responses.FOCUS GROUPS
INTERNATIONAL FOCUS GROUPS
 • 2016: Vancouver, Mexico City, London, Sydney, Shanghai and Beijing
 • 2018: Delhi, Mumbai and Seoul
 • Four groups conducted in each city among Millennial travelers

 • Objectives
      1. Gauge the mindset of Millennial travelers
      2. Explore perceptions of Los Angeles as a travel destination
      3. Understand the appeal of visiting Los Angeles
      4. Identify communication opportunities for Los Angeles

Los Angeles Tourism & Convention Board                                  20
HOMEWORK ASSIGNMENT Los Angeles Tourism & Convention Board 21
SYDNEY: TRAVEL DRIVERS

• Australians embrace overseas travel – so much to see in the world
    – Desire to return to past destinations is limited
    – Given the effort, extended long-haul trips and packaging several destinations together is common

• Well-know, iconic tourist attractions are an important part of the trip
    – Would be missing out if did not “tick off the list” of certain well known attractions

• Desire to experience a destination as a local does
    – Genuine, authentic side of a destination
    – A more spontaneous, go-with-the-flow type of experience

Los Angeles Tourism & Convention Board                                                                   22
SYDNEY: VISITING LOS ANGELES
• Perception of Los Angeles primarily as a collection of things to see and do
– Not quite the “glorified” view that residents of other cities have
– Activities are centered around Hollywood – Universal Studios, Walk of Fame, Hollywood sign
• Belief that Los Angeles is similar to Sydney in many ways
– Same urban outdoors and beaches in Sydney
– Didn’t see Los Angeles as unique as other cities did
• Some things did feel “quintessential” to Los Angeles
– Sun setting over the ocean. Only occurs in Western Australia
– Carefree energy and lifestyle but also luxury, sophistication and indulgence
– Celebrity watching and filming and sports in L.A. such as the Dodgers and the Lakers
– In-N-Out Burgers…and tacos
Los Angeles Tourism & Convention Board 23POLITICAL SENTIMENT RESEARCH
NEGATIVE
SENTIMENT
TOWARDS U.S.

 • “America First’ rhetoric
 • U.S. – Mexico relations strained
 • “Travel Bans” and “Extreme Vetting”
 • Anti-immigration stance

Los Angeles Tourism & Convention Board
                                         25
WORLD PERCEPTIONS OF TRUMP
Australia India
Source: Survey of International Travelers; Destination Analysts
Los Angeles Tourism & Convention Board 26BRAND USA SENTIMENT RESEARCH • Brand USA monitors visit intent to the US • Those saying US was NOT a likely destination, “current political climate in the USA” was increasingly a reason Los Angeles Tourism & Convention Board 27
L.A. TOURISM SENTIMENT RESEARCH
• Determine and track the attitude towards L.A. among travelers from China, Mexico, U.K, and Australia
    – How much influence does the current political climate have on the likelihood to visit L.A.?

• Methodology
    – Duplicate Brand USA for comparability
    – Online survey of 10 closed ended questions
    – N=500 adults 18-54 per country
    – Three waves

Los Angeles Tourism & Convention Board                                                                   28
WAVE 1 BASELINE RESEARCH RESULTS
AUSTRALIA CHINA MEXICO UK
How much influence does the political climate have on your
likelihood to visit Los Angeles?
% Significantly Less/Slightly Less 36% 27% 55% 31%
Based on what you know or have seen, read or heard, how would
you compare Los Angeles, CA to the rest of the USA as a whole?
% L.A. is Much More/Somewhat More Welcoming 49% 71% 66% 44%
Based on what you know or have seen, read or heard, how would
you rate Los Angeles, CA on these attributes
Is culturally diverse: % Completely/Well Describes 64% 78% 78% 62%
Los Angeles Tourism & Convention Board 29“EVERYONE IS WELCOME” VIDEO: V.1 Los Angeles Tourism & Convention Board 30
“EVERYONE IS WELCOME” RATINGS

                                                      AUSTRALIA   CHINA   MEXICO   UK
% “Like it very much/Like it”                            67%       88%     91%     68%
% “Greatly Improves/Improves” my perceptions of L.A      53%       84%     74%     48%
% “Significantly more/More likely” to visit L.A.         45%       82%     69%     45%

  Los Angeles Tourism & Convention Board                                                 31
LAX ACTIVATION VIDEO Los Angeles Tourism & Convention Board 32
“WELCOME” INITIATIVE RESPONSE RATE

Los Angeles Tourism & Convention Board   33
“EVERYONE IS WELCOME” EVOLUTION:V.2

 Los Angeles Tourism & Convention Board   34
DOMESTIC FOCUS GROUPS

• Conducted in February 2019 in New York City and Atlanta to generate feedback regarding the revised
  “Everyone is Welcome” campaign
• Results showed that the video reinforced the positive appeal of Los Angeles and visitation intent
• “Everyone is Welcome” campaign was not interpreted as a political message… it is a vacation message

• Conclusion
    – Based on the research conducted Internationally and Domestically, marketing will continue to evolve the
      “Everyone is Welcome” campaign for the
    – Focus groups will be conducted in NYC, Atlanta and Dallas to test new revised version

Los Angeles Tourism & Convention Board                                                                          35
THANK YOU! Los Angeles Tourism & Convention Board
You can also read