US ECONOMIC OUTLOOK What's ahead for the US economy - Gregory Daco Chief US Economist
←
→
Page content transcription
If your browser does not render page correctly, please read the page content below
US ECONOMIC OUTLOOK

What’s ahead for the US economy

         Gregory Daco
         Chief US Economist
         gregorydaco@oxfordeconomics.com

         Follow us on Twitter

         @GregDaco
         @OxfordEconomics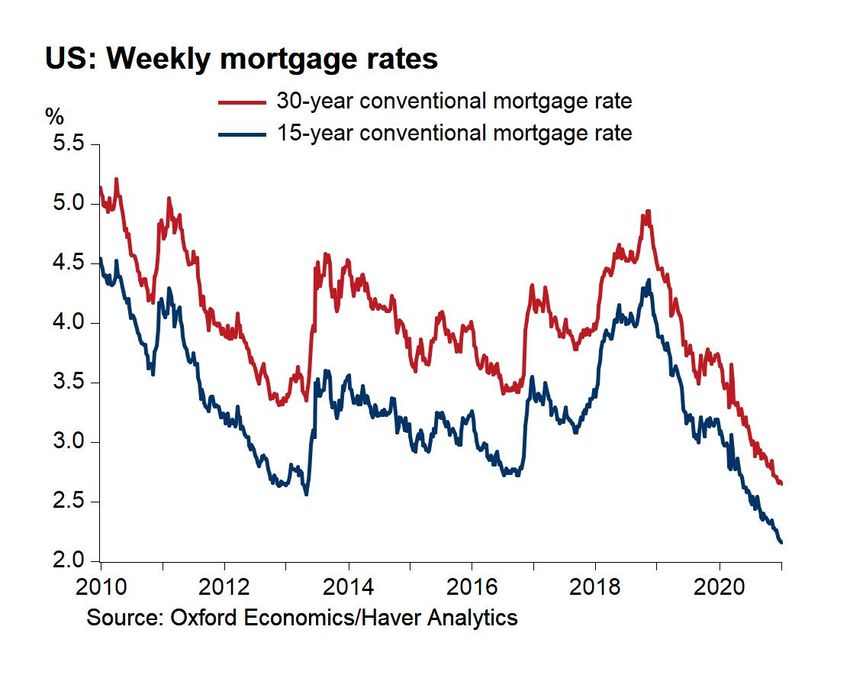
Death and hospitalizations reaching record-highs

     US: COVID-19 deaths and hospitalizations
        Deaths                                       Hospitalizations
                            New deaths (7-day MA)
     3,500                                                     160,000
                            Currently hospitalized
     3,000                                                     140,000

                                                               120,000
     2,500
                                                               100,000
     2,000
                                                               80,000
     1,500
                                                               60,000
     1,000
                                                               40,000

      500                                                      20,000

        0                                                      0
             Mar Apr May Jun Jul Aug Sep Oct Nov Dec Jan Feb
     Source: Oxford Economics/Haver Analytics

1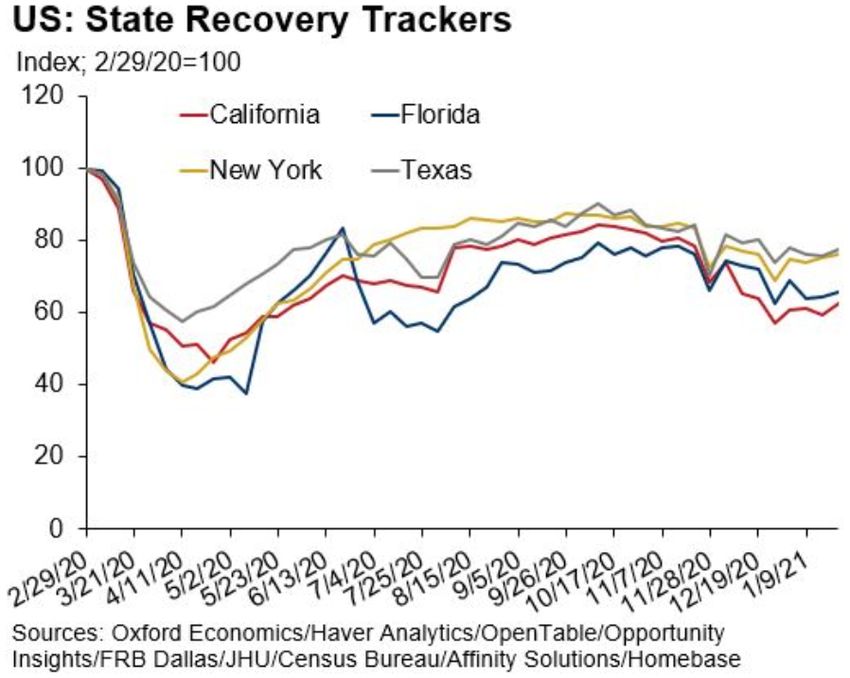
Vaccine diffusion will be gradual in 2021

2
Moving to a “delicate” recovery phase

US Recovery Tracker was flat in December
Financial
US: Recovery Tracker Mobility
(31-Jan-20 = 100) Production
Employment
Demand
100 Health
Recovery Tracker
80
60
40
20
0
Jan-20 Mar-20 May-20 Jul-20 Sep-20 Nov-20 Jan-21
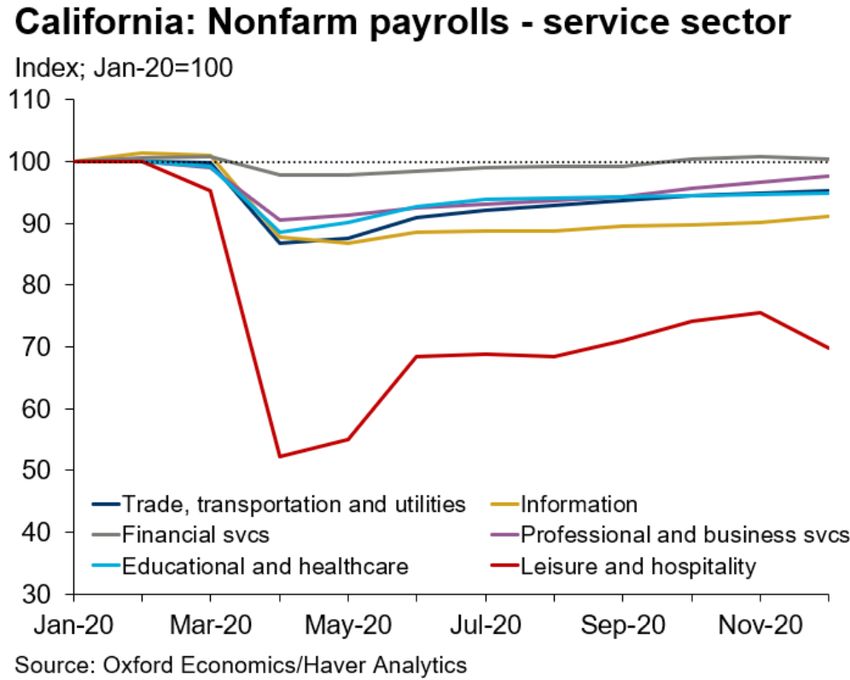
Sources: Oxford EconomicsCalifornia is heating up after cold winter 5
A durable health solution is indispensable

6
Limited US employment momentum at start of 2021

7
A rapid decline in the unemployment rate, but…

    US: U3 unemployment rate
    %
    16                                                             Apr:
                                                                   14.7%
    14

    12                          10.8%
                                                           10.0%
    10                 9.0%
                                          7.8%
     8   7.1%
                  6.1%                              6.3%                     Dec:
                                                                             6.7%
     6

     4

     2                                                            Average of 7
                                                                  prior recessions
     0
      1960      1970          1980      1990     2000      2010         2020

    Source: Oxford Economics/Haver Analytics

8
Drop in labor force participation is worrisome 9
Entering a new phase of the recovery

      Phase 2: The delicate vaccine rollout phase
     GDP Q4 2019 = 100
                     Phase 1      Phase 2                Phase 3
     110

     105

                                                   Q3*
     100
                                                                   2019Q4 level
                                             Q2*
                                   Q4: Q1*
      95    -10.1%
                                  +1.0%

                               +7.5%
      90

      85

      80
        19Q4 20Q1 20Q2 20Q3 20Q4 21Q1 21Q2 21Q3 21Q4 22Q1 22Q2 22Q3 22Q4

     Source: Oxford Economics
10
Employment should pick up over spring/summer 11
Income support is key to consumer spending
The income paradox is a key feature of the Covid crisis

     Household incomes
     % q/q in Q2 20202
     15
                                            Personal disposable income
     10                                     Compensation of employees

      5

      0

      -5

     -10

     -15
           Canada     US      Australia Germany France      UK       Italy
     Source : Oxford Economics/Haver Analytics
13
Fiscally-stimulated spending driven by low-income families 14
A massive $1.6tn cash stash for households

15
Expecting record-breaking spending this summer

16
With domestic leisure travel leading the rebound
Business and leisure trips Domestic and international trips
Index (2019=100)
Index (2019=100)
120
120
100 106
100 105 108 102
101 100 100 98
100 100 99 96
93
80 90 80 85
85 82
76
60 69
60 66
40 49 40
40 42
20 20 24
0 0
2019 2020 2021 2022 2023 2024 2019 2020 2021 2022 2023 2024
Business Leisure Domestic International
Note: Only domestic trips Source: Tourism Economics
Source: Tourism Economics
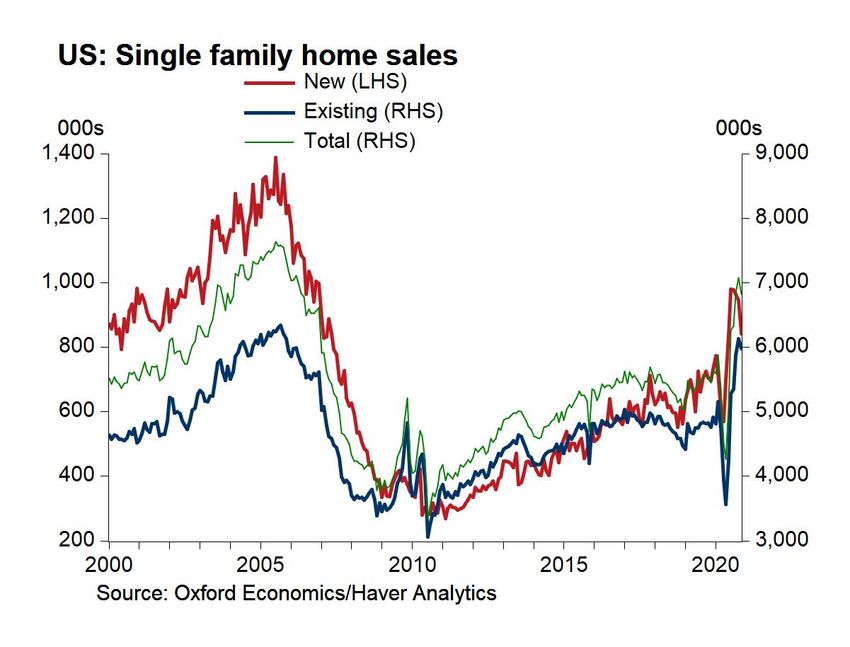
17Strong residential activity
Very strong homes sales and low inventory

19
But record low mortgage rates…

20
Business investment remains uncertain
Industrial activity is recovering at a steady pace

     US: Industrial activity falls while far below peak
     2012=100 / % of capacity
     120
                     IP      Manufacturing      Capacity Utilization

     110

     100

      90

      80

      70

      60
        2005 2006 2008 2010 2011 2013 2015 2016 2018 2020
     Source: Oxford Economics/Haver Analytics

22
Small businesses remain disproportionately exposed 23
Tech hubs and smaller cities will lead the recovery

     US: Medium term metro outlook

24
Fed will remain dovish for the foreseeable future
There will be a *transitory* inflation spike this spring

                                      Food contribution
      US: CPI inflation
                                      Energy contribution
      %, year
                                      Core contribution
       4.0                                                          Forecast
                                      Headline CPI

       3.0

       2.0

       1.0

       0.0

      -1.0

      -2.0
          2014   2015     2016      2017   2018    2019     2020   2021
         Source: Oxford Economics

26
But a dovish Fed will maintain low rates 27
Financial conditions remain very accommodative

     US: Financial conditions
     0 = Average stress                          Oxford Economics FCI
     6.5

     5.5

     4.5

     3.5

     2.5

     1.5

     0.5

     -0.5

     -1.5

     -2.5
         2014    2015     2016     2017   2018      2019     2020       2021
        Source: Oxford Economics
28
A Democrat-controlled Senate will support Biden’s ambitious agenda
Large and rapid fiscal stimulus without precedent

      US: Funds authorized by Congress
                       Since first reported US death from Covid-19 (Feb 28, 2020)
     Trillions, $
                       Since early signs of a financial crisis (Aug. 7th, 2007)
     6.00
     5.50
     5.00
                       $1.9tn: American Rescue Plan*
     4.50              (proposed, not passed)

     4.00
     3.50                $900bn: Covid relief bill
     3.00                                                     $787bn: American Recovery
                       $480bn: PPP & Healthcare                  and Reinvestment Act
     2.50                                                     (80 weeks after crisis began)
                       Enhancement Act
     2.00            $2.4tn: CARES Act
     1.50
                    $8bn: Preparedness bill
     1.00           $190bn: Stimulus bill                                $700bn: TARP

     0.50                                                  $300 bn: Mortgage-guarantee bill
                                   $152bn: Stimulus bill
     0.00
          0         100       200                300          400            500         Days
     Source : Oxford Economics/CBO
Upside risks from policy shouldn’t be discounted 31
Conclusions
Conclusions

     • While near-term Covid risks are tilted to the downside, gradual vaccine diffusion,
       increased fiscal stimulus and warmer weather should ensure stronger economic
       activity and employment from early spring onward.

     • In Q1, we believe GDP will only advance 1.5% (annualized), constrained by an
       uncontrolled health crisis, but supported by the recently passed Covid relief stimulus
       package and an expected additional round of $1,400 checks to families. From Q2 on,
       broader vaccine diffusion, reduced virus fear, warmer weather, and healthy savings
       should bolster the onset of a summer mini boom.

     • Real GDP is likely to advance around 3.9% y/y in Q4 2021, versus 3.2% y/y in the
       December baseline, on the back of increased fiscal stimulus.

     • With Democrats winning Georgia’s runoff races, they will hold a “soft” 50-vote Senate
       majority. Control of the Senate will allow President-elect Biden to enact more of his
       ambitious fiscal agenda, which boosts prospects for stronger growth in 2021-2022.

     • We continue to anticipate QE tapering won’t start until 2023, ahead of rate lift-off in
       mid-2024.
33
Global headquarters Europe, Middle East Americas Asia Pacific
Oxford Economics Ltd and Africa
Abbey House
Oxford New York Singapore
121 St Aldates
London Philadelphia Hong Kong
Oxford OX1 1HB
Belfast Boston Tokyo
UK
Frankfurt Chicago Sydney
Tel: +44 (0)20 185 268 900
Paris Los Angeles Melbourne
Millan Toronto
London
Stockholm Mexico City
4 Millbank
London SW1P 3JA Cape Town
Dubai
UK
Tel: +44 (0)20 3910 8000
New York Frankfurt:
5 Hanover Square (8th floor) Marienstr. 15, 60329 Frankfurt am Main, Germany
New York NY 10004 Tel: +49 69 96 758 658
USA
Email:
Tel: +1 646 503 3050
mailbox@oxfordeconomics.com
Singapore:
6 Battery Road Website:
# 38-05 www.oxfordeconomics.com
Singapore 049909
Tel: +65 6850 0110
34 Questions: Use the question panel on the rightYou can also read