VERSION 3.0 A Review of COVID -19 Statistics Week ending November 8, 2020 - Saskatoon.ca
←
→
Page content transcription
If your browser does not render page correctly, please read the page content below

A Review of COVID -19 Statistics
Week ending November 8, 2020

         VERSION 3.0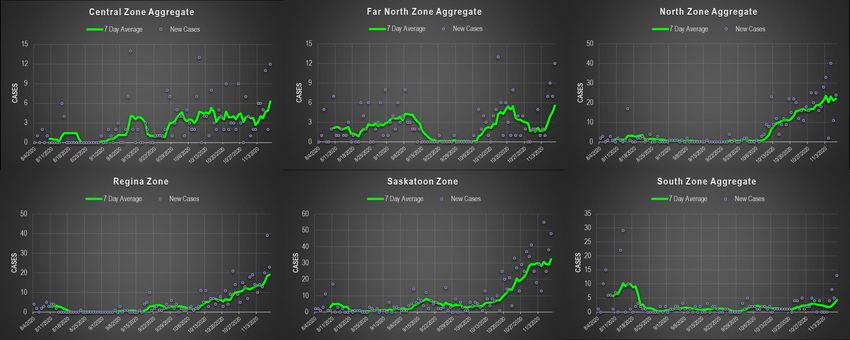
Table A shows various COVID statistics by Saskatchewan Health Zones. Saskatchewan changed its reporting format, so this table reflects the
 newly created health zones. Saskatchewan Health advises that new zones should not be compared to the older zones as the boundaries have
 changed. The table shows both cases counts (the raw numbers as reported) and rates adjusted for 10,000 population in each zone. It also shows
 testing data, and the rates are adjusted to 100,000 persons in this data set. The reason for the adjustments is to show per capita comparisons on
 the various indicators. Unfortunately, Saskatchewan also saw three new COVID fatalities over the last week.
                                           Table A: Saskatchewan COVID-19 Data by Health Zone ( as of November 8, 2020)
                                                     Source: https://dashboard.saskatchewan.ca/health-wellness
    Location              Demographics                                  Cases                          Hospitalizations           Recoveries   Fatalities                  Tests***
Region                 Population       Share of     Total Cases Total Case   Active   Active Case    Inpatient           ICU        Recovered¹ Deaths Death Total Tests Test Rate** Test Positivity
                     Estimates (2019) Population (%)               Rate*      Cases       Rate*    Hospitalizations Hospitalizations                   Rate *                           Rate (%)
Far North West              29,866              2      419        140.3         42        14.1            1              0           368         9      3.0       8,562      28,668        4.9
Far North Central            2,662              0       4          15.0         4         15.0            0              0             0         0      0.0         467      17,543        0.9
Far North East              24,195              2       61         25.2         23         9.5            0              0            38         0      0.0       5,278      21,814        1.2
North West                  77,235              6      263         34.1         91        11.8            2              0           168         4      0.5      15,571      20,161        1.7
North Central               80,547              7      416         51.6        197        24.5            7              1           217         2      0.2      21,140      26,246        2.0
North East                  42,260              4      164         38.8         47        11.1            0              0           116         1      0.2       9,716      22,991        1.7
Saskatoon                  334,757             28     1,053        31.5        362        10.8            9              4           688         3      0.1      82,653      24,690        1.3
Central West                37,696              3      199         52.8         4          1.1            0              0           194         1      0.3       6,561      17,405        3.0
Central East                99,982              8      228         22.8         59         5.9            0              0           168         1      0.1      19,532      19,536        1.2
Regina                     273,287             23      548         20.1        227         8.3            5              2           319         2      0.1      57,159      20,915        1.0
South West                  39,541              3      238         60.2         8          2.0            1              0           229         1      0.3       7,540      19,069        3.2
South Central               61,803              5      225         36.4         15         2.4            0              0           206         4      0.6      13,244      21,429        1.7
South East                  91,100              8       71         7.8          35         3.8            0              0            36         0      0.0      14,805      16,251        0.5
Total Saskatchewan       1,194,931            100     3,897        32.6       1114         9.3           25              7           2747        28     0.2     262,228      21,945        1.5

Notes:
* indicates rates are per 10,000 persons
** indicates rates are per 100,000 persons
*** there are 19,288 tests that do not have a specific location and are not included in the total.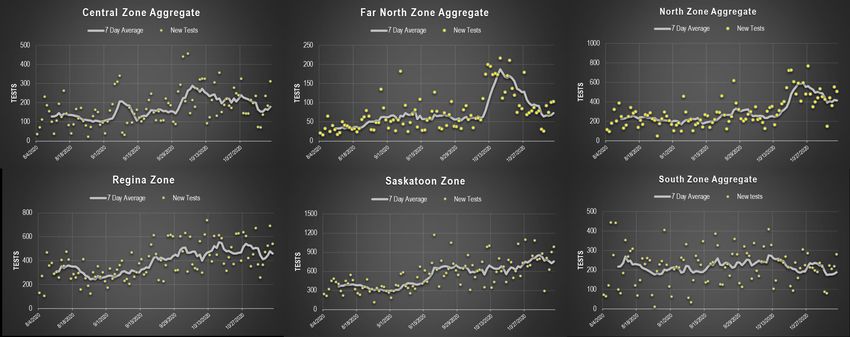
The tables on this slide show the composition of cases by health zone and the change in weekly cases both in absolute terms and
adjusted for population (for every 100,000 persons). The Saskatoon zone has the highest share of total cases and active cases. The Far
North West Zone has highest share of deaths. Saskatchewan saw 658 new cases over the last week, the location of three cases are
pending and are not include in the table on the right. This is the largest weekly increase since COVID emerged. Saskatoon led the way
with 226 new cases in the past week, or 68 per 100,000 persons.

                       Share of Total     Share of      Share of                                Weekly Case       Weekly
     Health Zone                                                              Health Zone
                        Cases (%)       Active Cases   Deaths (%)                                Change         Cases/100,000
                                                                        Far North West              28               94
    Far North West         10.8              3.8          32.1
                                                                        Far North Central             4              150
   Far North Central        0.1             0.4           0.0
                                                                        Far North East                7              29
    Far North East          1.6             2.1           0.0
                                                                        North West                   61              79
      North West            6.7             8.2           14.3                                       100             124
                                                                        North Central
     North Central         10.7             17.7          7.1           North East                   25              59
      North East            4.2             4.2           3.6           Saskatoon                    226             68
     Saskatoon             27.0             32.5          10.7          Central West                  3               8
     Central West           5.1             0.4           3.6           Central East                 41              41
                                                                        Regina                       133             49
     Central East           5.9             5.3           3.6
                                                                        South West                    8              20
        Regina             14.1             20.4          7.1
                                                                        South Central                10              16
     South West             6.1             0.7           3.6
                                                                        South East                   12              13
    South Central           5.8             1.3           14.3                                       658             55
                                                                        Total Saskatchewan
      South East            1.8             3.1           0.0
                                                                        Green = < 5
                                                                        Yellow = Between 5 and 7
                                                                        Red = > 7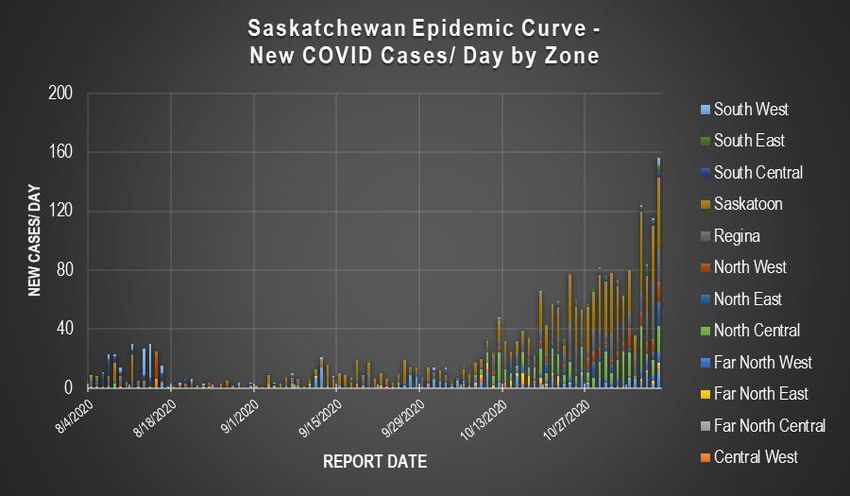
This slide estimates the Effective Reproduction Number (Rt) for Saskatchewan. A few points to note here. (1) The dates are lagged
because Rt uses recent case history to estimate the infection rate that caused them, referred to as the “presumed transmission
date”. This date occurs about 7 days prior to reporting of new cases. (2) An Rt above 1 means that COVID-19 is growing
exponentially. An Rt below 1 means that cases will eventually die out. (3) Rt is based on the SEIR epidemiological model with
assumptions. I use the Cori, et.al method to determine the Rt (described here: https://doi.org/10.1093/aje/kwt133). (4) The Rt is
estimated as the mean using 95% confidence intervals. The lower and upper bound estimates reflect the confidence interval.
In August, Saskatoon City Council adopted various statistical measures to monitor the spread of COVID-19 in the Saskatoon Zone.
The measures are: (1) the effective reproduction rate (Rt)-see previous slide for an explanation; (2) Weekly Cases/100,000; and (3)
the weekly test positivity rate. This slide summarizes these measures as of November 1, 2020. The Rt is sitting at 1.11. Weekly
cases/100,000 are red as they are greater than 7 cases per 100,000 persons, at 69. The test positivity rate has spiked to 4.9% for the
weekly average. (Note: the test positivity colour coding has been corrected).

                                                                                             Saskatoon Zone Indicators
                                                                                     (weekly cases/ 100,000 & test positivity rate)
                                                                                                  Weekly cases/100,000   Test Positivity Rate %
                                                                               Week Ending
                                                                                                       persons             (7 day Average)
                                                                                 8/10/2020                 6                       0.8
                                                                                 8/17/2020                 7                       1
                                                                                 8/24/2020                 1                       0.2
                                                                                 8/31/2020                 3                       0.4
                                                                                 9/6/2020                  4                       0.5
                                                                                 9/13/2020                 8                       0.8
                                                                                 9/20/2020                14                       1.1
                                                                                 9/27/2020                10                       0.7
                                                                                 10/4/2020                 6                       0.5
                                                                                10/12/2020                11                       0.8
                                                                                10/18/2020                15                       0.7
                                                                                10/25/2020                43                       3.3
                                                                                 11/1/2020                61                       3.5
                                                                                 11/8/2020                69                       4.9
                                                                                                        Legend:
                                                                           W eeky Cases/100,000             Test Positivity Rate
                                                                           Less than 5                      Less than 2.0%
                                                                           Between 5 and 7                  Between 2.0% and 5.0%
                                                                           Greater than 7                   Greater than 5%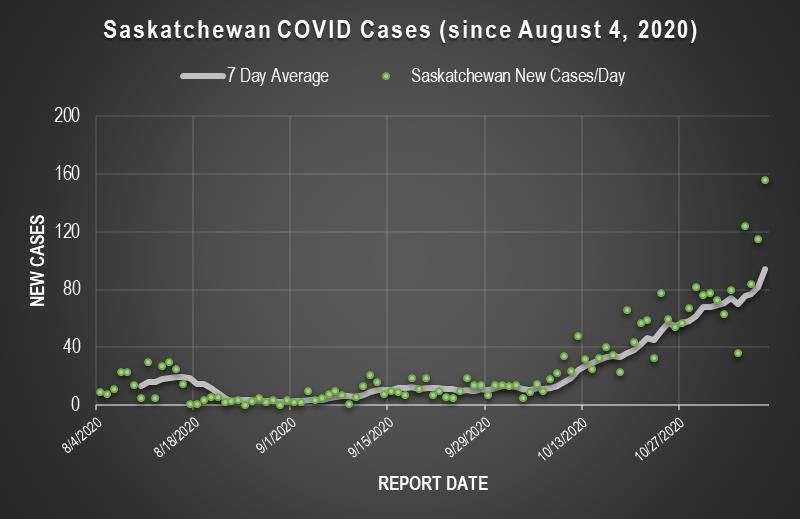
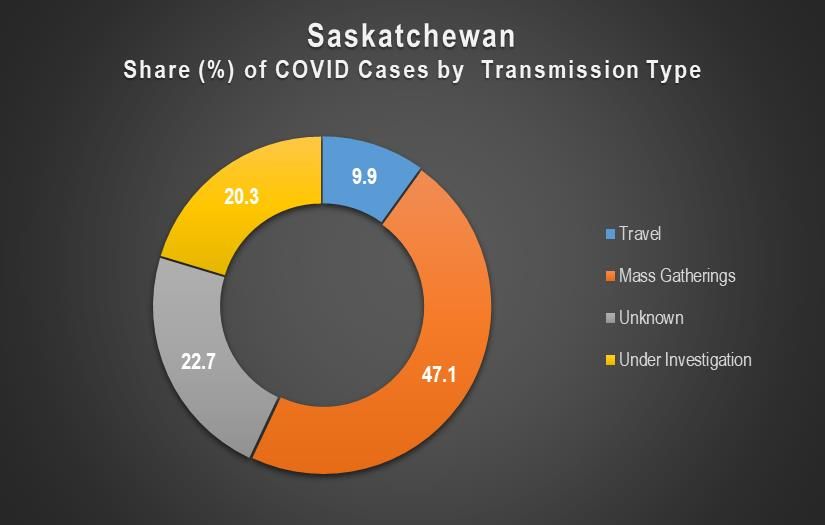
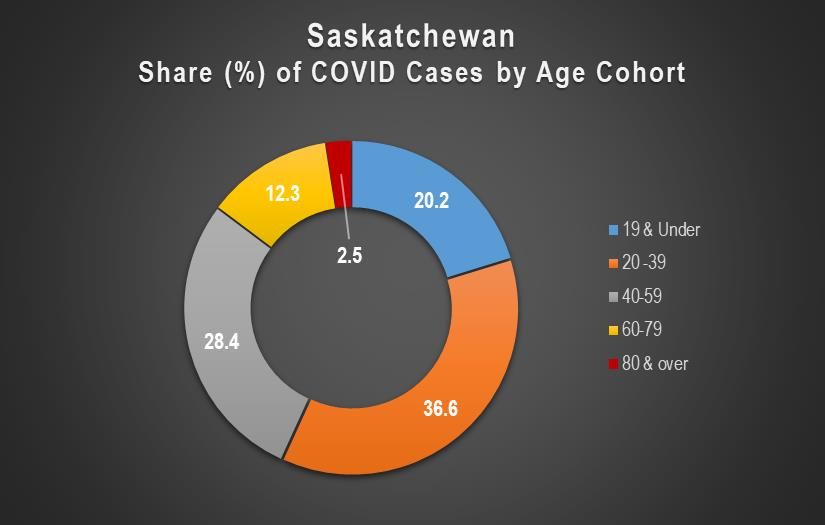
The charts on this slide show various case distributions. The chart on the left shows the share of cases by age cohorts.
The 20-39 age cohort has the largest share of cases at almost 37%. The share of cases 19& under are at their highest
level, over 20%. Unfortunately, Saskatchewan no longer reports time series data by age cohort so the trend analysis
cannot be conducted at this time. The chart on right shows how the cases are transmitted. Mass gatherings account
for most of the way in which cases have been contracted. It should be noted that 20% or 793 cases are under
investigation as to the source.
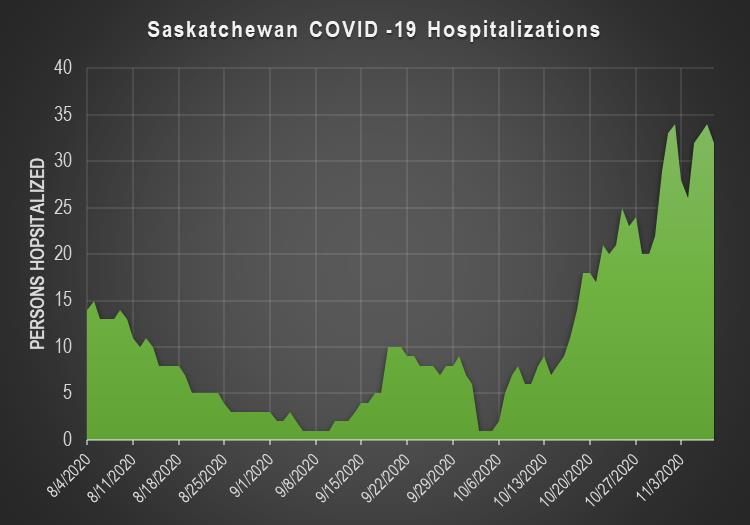
The charts on this slide show total hospitalizations by province since March and by zone since August. The chart on the
left shows total hospitalizations for Saskatchewan since the first reported on March 26. As the chart shows, the number
of persons hospitalized in the province due to COVID are at their highest point on November 1. The chart on the right
shows total hospitalizations composed by each zone since the new reporting framework in August. The majority of
hospitalizations are in the Saskatoon zone (the brown bar).
This slide shows Saskatchewan’s case growth using the new reporting dates. Note that the dates go back to August 4 when the
province implemented new reporting zones. The chart on the left shows daily cases smoothed by a 7 day moving average to show
the trend cycle (the grey line). The chart on the right illustrates the Saskatchewan’s epidemic curve as composed by each health
zone shown in table A (slide 2). The next slide shows the case pattern in the aggregate zones (e.g., Central or North).
This slide shows panel charts using the different scales on the y-axis to show daily case growth and the 7 day trend for
Saskatchewan zones since August 4th. In this slide, I aggregate the smaller zones into larger geographic zones to better illustrate
data trends . Daily case data is messy, so the goal here is to show the individual case trends relative to each zone . The green line
is the one to pay attention to as it shows the peaks or outbreaks in the zones over time. Note that the y-axis uses different scales to
show the shape of the case trends relative to each aggregate zone. A future update will show a per capita comparison on a
using similar scales for each aggregate zone.
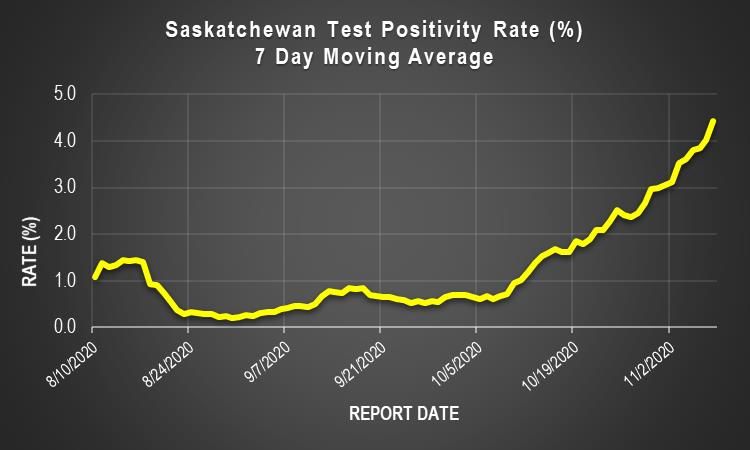
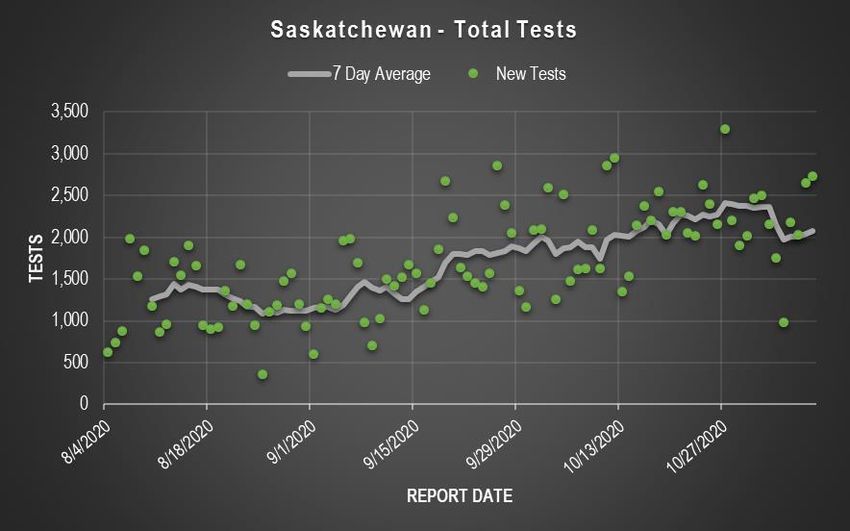
This slide shows Saskatchewan’s testing numbers. He chart on the left shows daily tests smoothed by a 7 day moving average to
show the trend cycle (the grey line). Saskatchewan had record testing on October 27 at over 3300 persons tested. The testing
trend line is now averaging almost 2,100 tests per day. According to the Saskatchewan Heath Authority, testing capacity is 4,000
per day. The chart on the right shows Saskatchewan’s test positivity rate, expressed as percent, using a 7-day moving average.
This measures the number of positive infections relative to the number of persons tested.
This slide builds off the previous one and shows daily tests by aggregated zones using the new dates and zones. It
smooths the data by using a seven day moving average. Again, each chart uses a different y-axis to better show testing
patterns in the specific zone. Saskatoon is averaging about 800 tests per day.
NATIONAL COMPARISONS
Table B shows various COVID-19 characteristics for all provinces in Canada. It should be noted that the jurisdictions have been
 resorted relative to previous versions. The table groups demographic, case, and testing data in their own columns. The table is
 constructed similar to Table A at the beginning of the deck in that it uses counts and rates. Note that some provinces do not report
 cases on the weekend so the numbers coincide with the most recent reporting dates. See the notes below for additional context.
 Also, testing numbers for Saskatchewan will differ from those listed in Table A, due to different test reporting requirements at the
 Public Health Agency of Canada.
                                           Table B: Areas in Canada with Cases of COVID-19 ( as of November 8, 2020)
                            Source: https://www.canada.ca/en/public-health/services/diseases/2019-novel-coronavirus-infection.html
                               Population#                 Total Cases              Active cases              Recoveries        Deaths                       Tested
                                                                                                                                                                          Test Positivity
      Case Location         Count          Share (%)    Count        Rate*       Count         Rate*            Count       Count     Rate*     Count        Rate**
                                                                                                                                                                             Rate (%)
British Columbia              5,147,712          13.5      17,716          344       4,405               86        13,035       276        5       652,024      126,663               2.7
Alberta                       4,421,876          11.6      33,504          758       8,457              191        24,684       363        8     1,295,038      292,871               2.6
Saskatchewan                  1,178,681           3.1       3,897          331      1,122                95         2,747        28        2       221,644      188,044               1.8
Manitoba                      1,379,263           3.6       8,130          589      4,849               352         3,175       106        8       270,689      196,256               3.0
Ontario                      14,734,014          38.8      84,153          571       9,105               62        71,815     3,233       22     5,206,568      353,371               1.6
Quebec                        8,574,571          22.6     114,820        1,339      10,591              124        97,789     6,440       75     1,965,445      229,218               5.8
Newfoundland and Labrador       522,103           1.4         297           57           7                1           286         4        1        54,686      104,742               0.5
New Brunswick                   781,476           2.1         354           45          24                3           324         6        1        87,272      111,676               0.4
Nova Scotia                     979,351           2.6       1,128          115          20                2         1,043        65        7       118,072      120,561               1.0
Prince Edward Island            159,625           0.4          66           41           2                1            64         0        0        50,748      317,920               0.1
Yukon                            42,052           0.1          23           55           2                5            20         1        2         4,164       99,020               0.6
Northwest Territories            45,161           0.1          10           22           2                4            10         0        0         5,656      125,241               0.2
Nunavut                          39,353           0.1           2            0           0                0             5         0        0         3,139       79,765               0.1
Repatriated travellers               N/A          N/A          13          N/A           0             N/A             13         0       N/A           76          N/A              17.1
Canada                       38,005,238           100     264,113          695      38,586             102        215,010    10,522       28     9,935,221      261,417               2.7

Notes:
# as of Q3, 2020, from Statistics Canada Table 17-10-0009-01
Rate* = per 100,000 populaiton
Rate** = per 1,000,000 population
This slide adjusts two data sets for population. The map chart shows total COVID-19 cases by province and territory per 100,000 persons. The colour gradient illustrates the case intensity. Ontario, by far, has the strongest case intensity, followed by Quebec and Alberta. The second chart show the change in weekly cases/ per 100,000 persons. Using this data set Saskatchewan had 57.4 cases/100,000 over the last week, higher than both BC and Ontario. (Note the Saskatchewan number differs from earlier slides due to population count differences between Sask Health and Statistics Canada). Manitoba saw another large surge of new cases with a weekly rate of 152 cases/per 100,000.
This slide shows the percent share of cases in the provinces and territories relative to the total. As of
November 8, 2020, Quebec has the largest share of total cases, active cases, and accounts for almost
two-thirds of all deaths. In fact, over 90% of the COVID-19 deaths in Canada are from Ontario and
Quebec.
This slide uses a panel chart and time series to illustrate COVID case growth in provinces that have had more than 1,000
cases (except for Nova Scotia). Because daily cases are not reported consistently and the data is messy, for these
charts, daily cases are eliminated but case growth is smoothed by a 7-day rolling average to show trend. The times
series starts on April 1, 2020 for each province. Note that each has different y-axis scales to illustrate each province’s
unique challenges with COVID. This better illustrates the shapes of the curve. The next slide scales the y-axis for
comparative purposes and includes scaled case data.
This slide builds off the previous one and attempts show intensity of cases. Here, the case data is scaled by cases/per million, using a
time series to illustrate daily COVID case growth in provinces that have had more than 1,000 cases. The case growth is smoothed
by a 7-day rolling average to show trend. I have eliminated the daily numbers as some provinces do not report on weekends.
When adjusted for population and using a consistent scale, the case patterns change relative to the previous slide. The time series
starts on April 1 for every province.
This slide shows cumulative cases in selected Canadian provinces (and nationally) since COVID-19 first emerged in March.
November 8th marks day 258 of when the virus was officially confirmed in Canada and started to spread. The left chart shows
unadjusted case growth. The second chart uses a log scale with a base of 10 in attempt to better illustrate the pace of growth.
Note that using the log scale changes the case pattern and each province is more visible. For example, at day 160, the surge in
Manitoba cases is visible in this chart. Similarly, day 210 shows a visible increase in Saskatchewan’s cases.
QUESTIONS, COMMENTS OR
        SUGGESTIONS?
email: mike.jordan@Saskatoon.ca
You can also read