Waterbeach Market Demand Appraisal Build to Rent - March 2021
←
→
Page content transcription
If your browser does not render page correctly, please read the page content below
Waterbeach
Market Demand Appraisal
     Build to Rent

         March 2021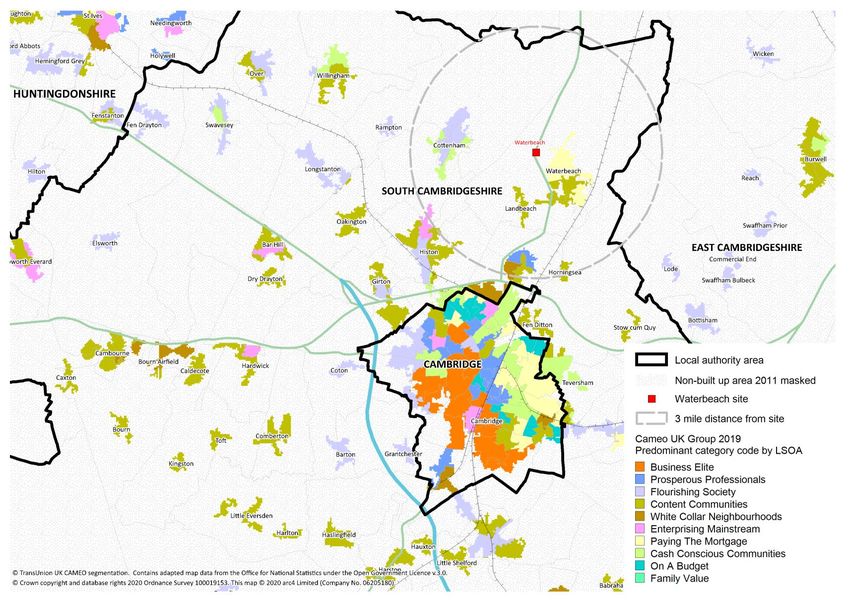
Page | 2

Table of Contents

INTRODUCTION………………………………………………………………………………………………………………………………………………                                                                                                                                                     3
LOCATION AND STRATEGIC CONTEXT ……………………………………………………………………………………………………………………..5
EXISTING PROVISION................................................................................................................................................................................................... 15
ECONOMIC OPPORTUNITY ......................................................................................................................................................................................... 18
POPULATION CHANGE ................................................................................................................................................................................................ 25
ACTIVITY IN THE PRIVATE RENTED SECTOR MARKET ......................................................................................................................................... 27
RENT LEVELS AND CHANGE ...................................................................................................................................................................................... 30
TIME TAKEN TO LET IN THE PRIVATE RENTAL MARKET ..................................................................................................................................... 33
CAPITAL VALUES ......................................................................................................................................................................................................... 35
AGENT FEEDBACK ....................................................................................................................................................................................................... 40
COMPETITION - RENTALS ........................................................................................................................................................................................... 43
THE PLANNING PIPELINE ............................................................................................................................................................................................ 45
THE ROLE OF BUILD TO RENT IN PLACE SHAPING ............................................................................................................................................... 47
SUMMARY…. ………………………………………………………………………………………………………………………………………………………………………………………………………………… 51
RECOMMENDATIONS FOR POLICY OPTIONS ......................................................................................................................................................... 54
GLOSSARY OF TERMS ................................................................................................................................................................................................ 60
Page | 3

Introduction

Build to Rent is now a distinct asset class within the Private Rented Sector and has been defined in the National Planning Policy Framework
glossary, in order to simplify its treatment within the planning system. It is defined as: Purpose built housing that is typically 100% rented out. It can
form part of a wider multi-tenure development comprising either flats or houses, but should be on the same site and/or contiguous with the main
development. Schemes will usually offer longer tenancy agreements of three years or more, and will typically be professionally managed stock in
single ownership and management control.
Build to Rent developments are typically owned by companies (such as property companies or pension or insurance investment companies) and
let directly or through an agent.
National Planning Policy Guidance on Build to Rent gives information on what Build to Rent schemes should look like.
This report should help South Cambridgeshire District Council to understand the potential role that Build to Rent (BTR) Housing can play in
Waterbeach.
The report provides strategic and market context, and will help the local authority to consider, amongst other things:
•   location and mix
•   potential community, social and place-making impacts;
•   management arrangements likely to be needed;
•   covenant periods likely to be required, including any associated issues and risks for the development in the long-term; and
•   how Build to Rent delivery should be balanced with the Waterbeach New Town Supplementary Planning Document.
A glossary of terms is available at the end of this report.
Page | 4
Page | 5

LOCATION AND STRATEGIC CONTEXT
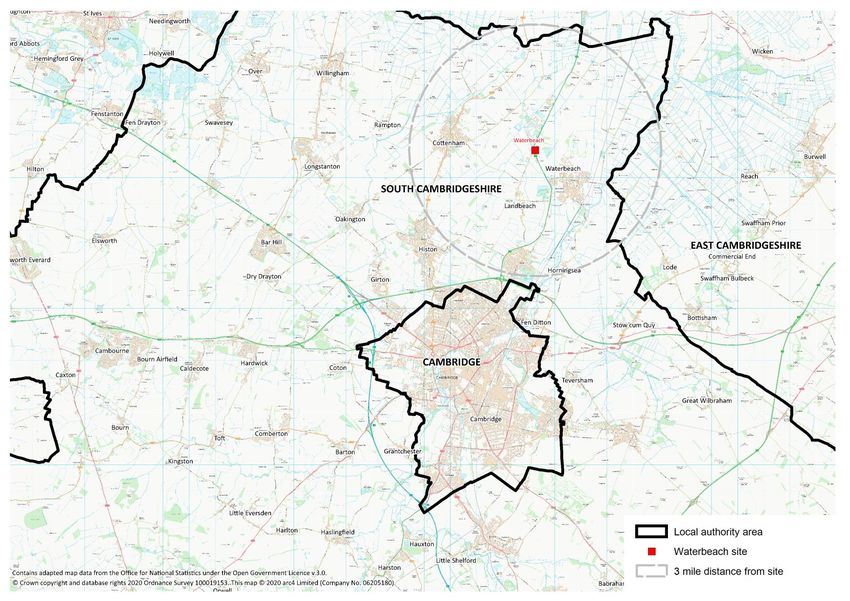
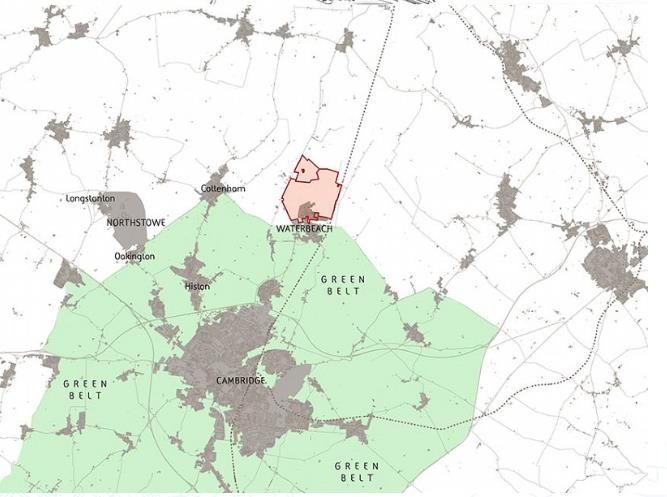
Page | 6

Location

 A 3-mile radius has
 been developed for
 analysis. This
 incorporates a radius
 large enough to
 access a robust data
 set but remains
 focused around the
 site.
Page | 7

South Cambridgeshire is a largely rural district which surrounds the City of Cambridge and comprises over 100 villages, none currently larger than
8,000 persons. It is surrounded by a ring of market towns just beyond its borders, which are generally 10 to 15 miles from Cambridge. South
Cambridgeshire has long been a fast-growing district and in 2017 had a population of 146,800 persons (bigger than Cambridge itself) and has
become home to many of the clusters of high technology research and development in the Cambridge Sub-Region.
South Cambridgeshire is located centrally in the East of England region at the junction of the M11 / A14 roads and with direct rail access to London
and to Stansted Airport. The A14 bounds the north of the city and creates a link from the east coast and the Port of Felixstowe through to the M1
and M6 motorways. Cambridge is on the London to King’s Lynn railway line, with London being accessible within 45 minutes.
Within the next decade, Cambridge should have a new railway line, the East-West Rail project, connecting it to Oxford and Milton Keynes.
Cambridge is the centre of a wider travel to work and housing market area with its influence, both as a sub-regional centre and a major focus for
employment, including most of Cambridgeshire, and parts of West Suffolk, Bedfordshire, Essex and North Hertfordshire.
South Cambridgeshire is consistently recognised as one of the top places to live and work in the country due to a thriving economy and quality of
life. It has a successful local economy which is important on a national stage and South Cambridgeshire is one of the fastest growing areas in the
country.
Waterbeach is a significant site that encompasses the current Royal Air Force barracks plus the redundant airfield strip adjacent to the A10. Set
within an established residential village setting, the site is well served by transport networks with the A10 that connects into Cambridge (roughly 2
to 3 miles away), the A14 and M11. The village has a railway station which will be relocated so that it can successfully cater for this new development.
Direct trains depart from the station to Kings Cross every hour (a 60-minute journey), and Ely to the north, (approximate journey time 45 minutes).
The site is very close to the Cambridge Research Park.
The vision for Waterbeach New Town seeks to recreate the benefits of older patterns of development and living that are more in tune with natural
systems. This focuses on delivering a high-quality environment to live, work and play in, promoting health and wellbeing and a high quality of life
for all.
Page | 8

Local Plan 2018
The adopted South Cambridgeshire Local Plan covers the period            Policy H/9 Housing Mix confirms that a wide choice, type and mix of
2011 to 2031 and sets out the planning policies and land allocations     housing will be provided to meet the needs of different groups in the
to guide the future development of the district. Policy S/5 sets out a   community including families with children, older people, those
housing requirement of 19,500 homes between 2011 and 2031 for            seeking starter homes, people wishing to build their own homes,
South Cambridgeshire to meets its objectively assessed needs.            people seeking Private Rented Sector housing (Build to Rent), and
                                                                         people with disabilities. The market homes in developments of 10 or
It commits to building new market and affordable homes to meet           more homes will consist of:
housing needs, and will support the creation of healthy communities
and contribute to the success of the local economy. Building the right   a.     at least 30% 1 or 2-bedroom homes;
type of homes in the right places can also promote energy efficiency     b.     at least 30% 3-bedroom homes;
and help reduce fuel poverty.
                                                                         c.     at least 30% 4 or more-bedroom homes;
The South Cambridgeshire Local Plan confirms through Policy H/8
                                                                         d.      with a 10% flexibility allowance that can be added to any of the
Housing Density that:
                                                                                above categories taking account of local circumstances.
Housing developments, including rural exception sites, will achieve
                                                                         This is subject to:
an average net density of:
                                                                         The housing mix of affordable homes (except starter homes) in all
a. 30 dwellings per hectare in Rural Centres, Minor Rural Centre
                                                                         developments being determined by local housing needs evidence.
   villages, and Group villages;
b. 40 dwellings per hectare in urban extensions to Cambridge and
   in new settlements.
The net density on a site may vary from the above where justified by
the character of the locality, the scale of the development, or other
local circumstances.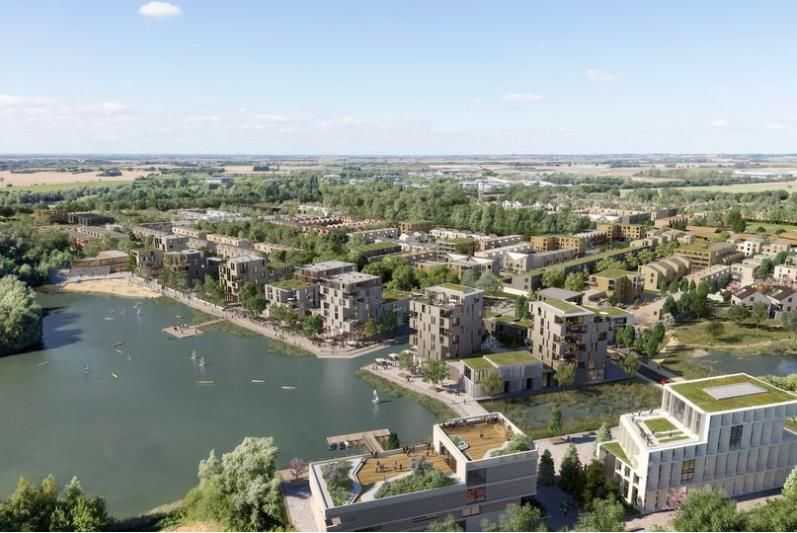
Page | 9

Policy H/10 Affordable Housing requires developments of 11                The Strategic Housing Market Assessment identifies that 11,838
dwellings or more, or on development sites of less than 11 units if the   affordable homes will be required to meet current and arising need in
total floorspace of the proposed units exceeds 1,000 metres square,       the period to 2031, a considerable proportion of all the homes to be
to provide 40% affordable housing on site. This was agreed before         built to 2031, however the delivery of such housing will be constrained
the new National Planning Policy Framework threshold was                  by development viability, the availability of land, and the need to create
introduced. In the application of this Local Plan policy significant      sustainable, inclusive and mixed communities.
weight will be given to the affordable housing threshold set out in the   The Homes for our Future; Greater Cambridge Housing Strategy 2019
National Planning Policy Framework which allows for a lower               to 2023, has seven priorities, including: building the right homes in
threshold of 10 or more dwellings or where the site area is 0.5           the right places that people need and can afford to live in; increasing
hectares or more. An agreed mix of affordable house tenures will be       the delivery of homes, including affordable housing, along with
determined by local circumstances at the time of granting planning        sustainable transport and infrastructure, to meet housing need; and
permission. Viability evidence and past delivery has identified that      diversifying the housing market and accelerating delivery.
40% affordable housing is viable for most developments in most
locations across the district.
Private rented and affordable accommodation
The South Cambridgeshire Local Plan 2018 confirms that the Private
Rented Sector plays an essential role in the housing market. The
Census 2011 identifies a tenure change to private rented of 3.1%
from the Census 2001 for South Cambridgeshire. South
Cambridgeshire has high house prices in relation to earnings and
affordability within the private sector is a major concern for the
district. The increase in size of deposit required for both market and
shared ownership means there is likely to be a significant demand
for private rented accommodation from low to middle income
households. The council supports the Private Rented Sector to grow
through Build to Rent, to meet the growing demand for rented homes
as part of the market element of housing developments. The council
recognises the need to rebalance the market toward smaller
dwellings and generally requires 40% affordable housing on new
sites.
Page | 10

Waterbeach New Town
Page | 11

Local Plan Policy SS/6 and Waterbeach New Town
Supplementary Planning Document                                           •   Be developed to maintain the identity of Waterbeach as a village
                                                                              close to the new town. The nature of the transition between
Waterbeach New Town has been allocated in the South                           Waterbeach village and the new town will be addressed through
Cambridgeshire Local Plan (2018) in Policy SS/6 for the                       the Supplementary Planning Document.
development of a new town of approximately 8,000 to 9,000
dwellings and associated uses. The final number of dwellings will be
determined through a design led approach and spatial framework
diagram included in the Supplementary Planning Document.
The Local Plan advises that the implementation of the new town will
be informed by a Supplementary Planning Document. The
Waterbeach New Town Supplementary Planning Document was
adopted in February 2019.
The new town will:
•   Provide a range of uses appropriate to a new town:
•   Deliver a residential development with a of mix of dwelling sizes
    and types, including affordable housing, to achieve a balanced
    and inclusive community.
•   Incorporate and deliver opportunities to exceed sustainable
    design and construction standards established by the Local Plan.
•   Ensure the delivery of improvement to any existing infrastructure     The Supplementary Planning Document confirms that new build
    which will be relied upon by the new town as well as the provision,   private rented/ Build to Rent schemes could make a valuable
    management and maintenance of new infrastructure, services            contribution to the overall mix of housing at the new town and its pace
    and facilities to meet the needs of the town. Planning permission     of development. Any such scheme would need to be understood
    was approved in January 2020 for the relocation of the railway        clearly in terms of the financial model being used to create a scheme,
    station.                                                              the longer-term operation of the scheme and implications of the
                                                                          scheme for infrastructure requirements.
Page | 12 There is a commitment to affordable housing of 30%; this means nearly 500 affordable homes in the initial phase of 1,600 dwellings. This could rise to up to 40% subject to an economic viability test. Western part of the site (Urban & Civic): Outline planning permission was approved in September 2019 for up to 6,500 dwellings (including up to 600 residential institutional units), business, retail, community, leisure and sports uses, a hotel, schools, and open spaces. This includes 30% affordable housing. The proposed outputs will also include up to 4,000 square feet of hotel accommodation, 16,500m2 of retail space as well as 9000m2 of community use which will incorporate a multi-purpose community centre, health care, nurseries, library, places of worship, and other community outlets. All this will be set within a landscaped woodland with both pedestrian walking routes and cycle pathways. The first phase of the development will see 1,600 new homes constructed, the first primary school, health provision and a new library to complement the existing village, sports pitches, shops, and cafes, 25 play areas, as well as community orchards. Eastern part of the site (RLW Estates): The Council’s planning committee in January 2021 gave officers delegated powers to approve an outline planning application for up to 4,500 dwellings, business, retail, community, leisure and sports uses, new primary and secondary schools and sixth form centre, and public open spaces, subject to the completion of a s106 agreement.
Page | 13

Cambridge & Peterborough Combined Authority
South Cambridgeshire is part of the Cambridge and Peterborough Combined Authority area where the growth ambitions confirm:
•   Not enough homes have been built in the past and as a result homes are becoming progressively less affordable; young people are projected
    to account for just 10% of future household formation; and commuting is increasing as firms and workers respond to these pressures by
    relocating, putting extra pressure on transport infrastructure and quality of life.
•   Housing delivery should rise from the current 3,000 to 3,500 completions a year to 6,500 to 8,000 a year.
•   New homes need to be affordable. The Combined Authority’s housing strategy has established a £40 million revolving fund, which aims to allow
    for exceeding the 2,500 affordable homes committed to in the devolution deal. The Spatial Framework and direct investment in new settlements
    will be used to encourage extra affordable housing provision and homes for first time buyers with price targets based on earnings.
•   Development should be encouraged along transport corridors and around new garden villages and include an emphasis on anticipating the
    future corridors that can be created by the infrastructure the Combined Authority is bringing forward including the Cambridge Autonomous Metro
    (CAM).
•   This approach will be based on ensuring the Spatial Framework and Local Transport Plan are linked and that that transport and other
    infrastructure investment precedes housing development.
•   Pursuing a target of ensuring there are good jobs available within a 30-minute journey of home for our residents.
The Cambridgeshire and Peterborough Independent Economic Review (CPIER) published its final report in September 2018, which was
developed by the Cambridgeshire and Peterborough Independent Economic Commission. The report evidences the fast rate of economic and
employment growth in the region and highlights the importance of planning now to ensure that strong growth will be sustainable and more
inclusive.
Page | 14 Cambridge, Milton Keynes Oxford (CaMKOx) Arc The CaMKOx Arc plans to develop the ‘brain belt’ area between Cambridge, Milton Keynes and Oxford with several new towns, commercial developments and a million new homes with up to 1.9 million more people living in the area by 2050. The CaMkOx Arc has potential to be one of the biggest economic and property development schemes the UK has ever seen. It has some of the most modern and high-tech industries in the country, providing some of the most highly paid jobs outside London. Currently it is home to 3.3 million people and has a multi-billion-pound economy. However, it is disparate and not very well connected. The National Infrastructure Commission, in its report ‘Partnering for Prosperity: A New Deal for the Cambridge-Milton Keynes-Oxford Arc’ suggests the Arc could be a focus for accelerated economic development as a single coherent unit. Connectivity will be improved through new road and rail networks and as well as expanding existing settlements with planning able to unlock large scale opportunities for housing growth. This could include whole new settlements of between 10,000 to 150,000 new homes, some of which could have city standing. Opportunities for Build to Rent development could be brought forward as the vision for the CaMkOx Arc progresses. The National Infrastructure Commission estimates improvements in infrastructure and housing across the region will result in a close to threefold increase in the economic output of the Arc over the coming decades. This will provide the necessary critical mass to facilitate the expansion in scale and depth of the existing knowledge corridor, which already presents a unique proposition in the UK: Oxford and Cambridge are the only cities in the UK in the European top 20 list for innovation. (The Resolution Foundation 2018).
Page | 15

EXISTING PROVISION
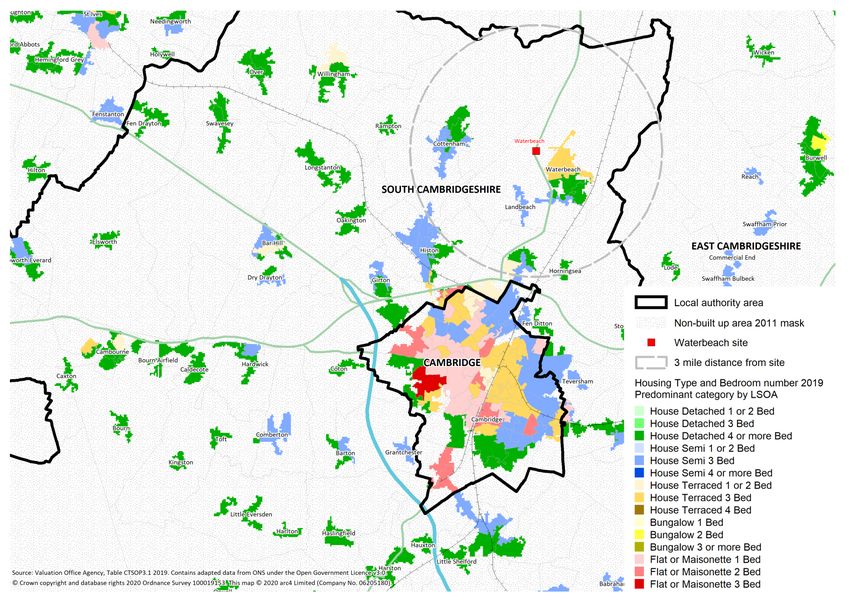
Page | 16

Predominant housing type and size 2019

Generally,
Waterbeach is
currently focused on
houses rather than
flats. There are also
bungalows, potentially
reflecting an older
demographic.
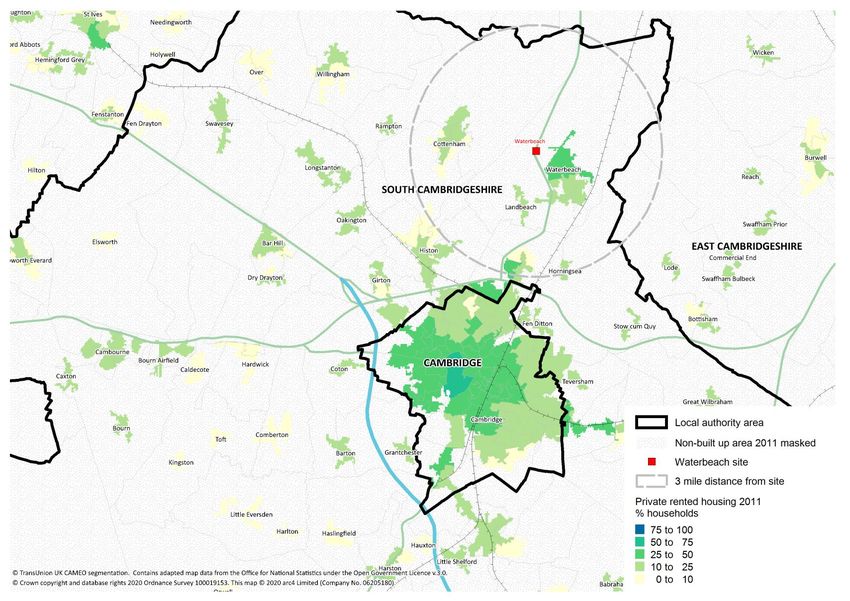
Page | 17

Private Renting 2011

There is a reasonable
Private Rented Sector
market operating. It is
larger than in Bourn
and Northstowe.
Page | 18

ECONOMIC OPPORTUNITY
Page | 19

Economy and Labour Market: Key indicators
                                                          South      East        West                       East
          Indicator                  Base       Year     Cambs.     Cambs.      Suffolk      Cambridge     Region    England
Gross Value Added (GVA)               £m        2016        4,591      1,906        4,282        5,127     167,223 1,509,306
GVA per person                         £        2016       29,343     21,700      24,140        38,900       23,148     27,309
GVA per person index              2000 = 100    2016        153.2      158.8        151.2          164          152      163.2
Business count                     Number       2019        8,500      4,100        7,420        4,950     146,893 2,360,780
Jobs                               Number       2017       97,000     40,000      98,000       118,000    3,218,000 30,359,000
Jobs index                        2000 = 100    2017        140.6      166.7        129.4        126.9        120.4      122.8
Job density                       Per 16-64s    2017         1.02       0.75         1.02         1.33         0.85       0.87
Resident gross wages              £ per week    2019        755.2      614.2        539.2        631.9        610.4      591.3
Workplace gross wages             £ per week    2019        715.9      543.1        518.5        637.4          581      591.4
Employment rate                  % of 16-64s    2018         85.1       81.8         80.0         75.7           78       75.4
Workless households                    %        2018          9.7         6.4        10.1         12.9         12.2       13.9
NVQ4+                            % of 16-64s    2018         51.4       39.4         33.1         61.5         35.2         39
No NVQ                           % of 16-64s    2018          5.1           5          2.4          6.7         7.4        7.6
Households                         Number       2018       64,151     37,262      74,312        44,566    3,101,330 23,053,707
Households index                  2004 = 100    2018        118.7      120.7        113.3        104.4        113.5      111.9
Population                         Number       2018      157,519     89,362     178,881       125,758    6,201,214 55,977,178
Population index                  2001 = 100    2018        120.7      121.7        115.8        114.4        114.8      113.2
Net international migration   Rate 1,000       2013-18       10.5       15.8          -1.5        35.7         15.9       23.5
                              population
Births to non-UK born                  %        2018         27.1       22.5         31.8         53.5        25.6        29.1
mothers
Page | 20 Sources: Regional gross value added (balanced) reference tables; Regional Gross Value Added (Balanced) by Local Authority in the UK UK Business Counts – enterprises by industry and employment size band via NOMIS Business Register and Employment Survey via NOMIS Annual survey of hours and earnings – resident and workplace analysis via NOMIS Annual population survey, including households by combined economic activity status via NOMIS 2016-based household projections for local authorities and higher administrative areas in England Population estimates – local authority based by single year of age via NOMIS Local area migration indicators 2018 Adapted data from the Office for National Statistics under the Open Government Licence v.3.0
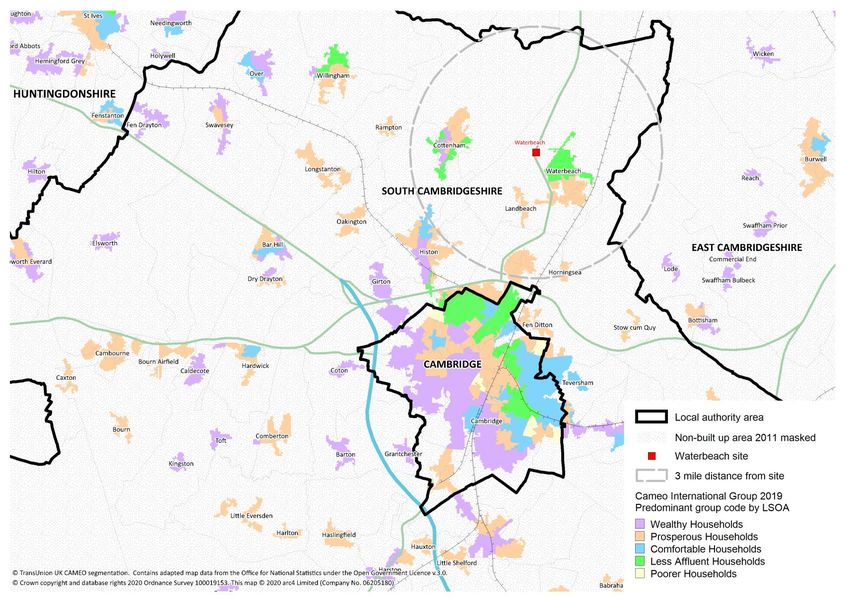
Page | 21

Geodemographics 2019

Generally, markets
around Waterbeach are
middle-income
communities with some
lower income
households.
Page | 22

Markets around
Waterbeach are
generally middle-
income communities
with some lower
income households and
some prosperous
households.
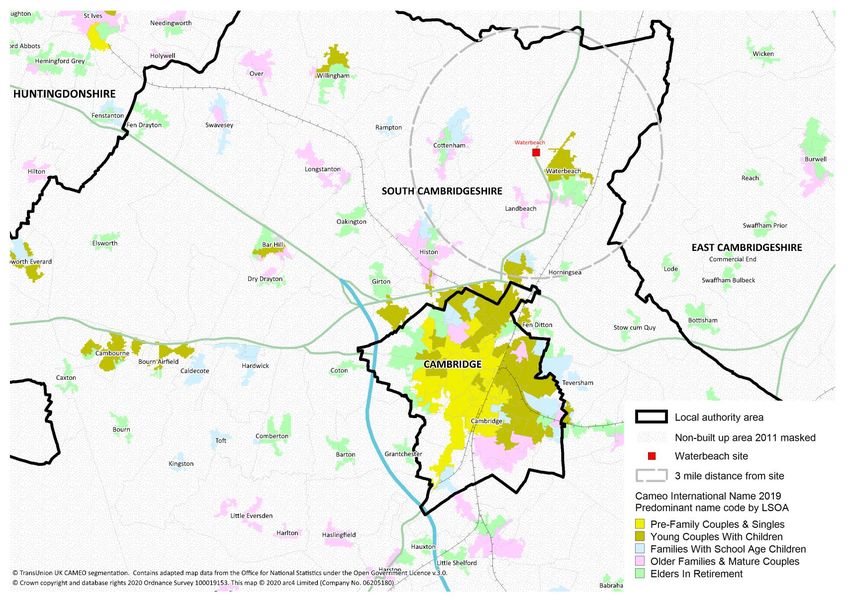
Page | 23

Markets around
Waterbeach contain
older households
and younger/pre
family markets.
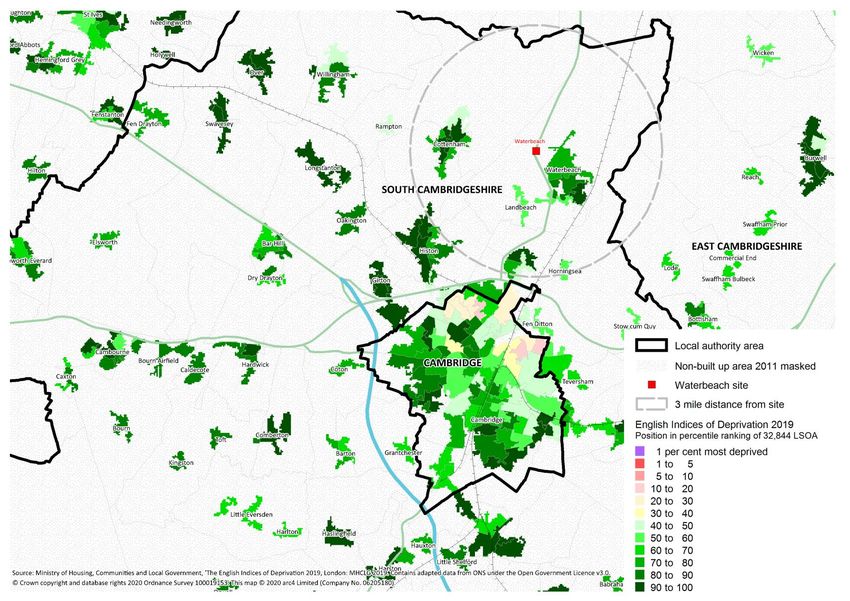
Page | 24

Local Deprivation 2019

 Markets around
 Waterbeach are
 not highly
 deprived.
Page | 25

POPULATION CHANGE
Page | 26
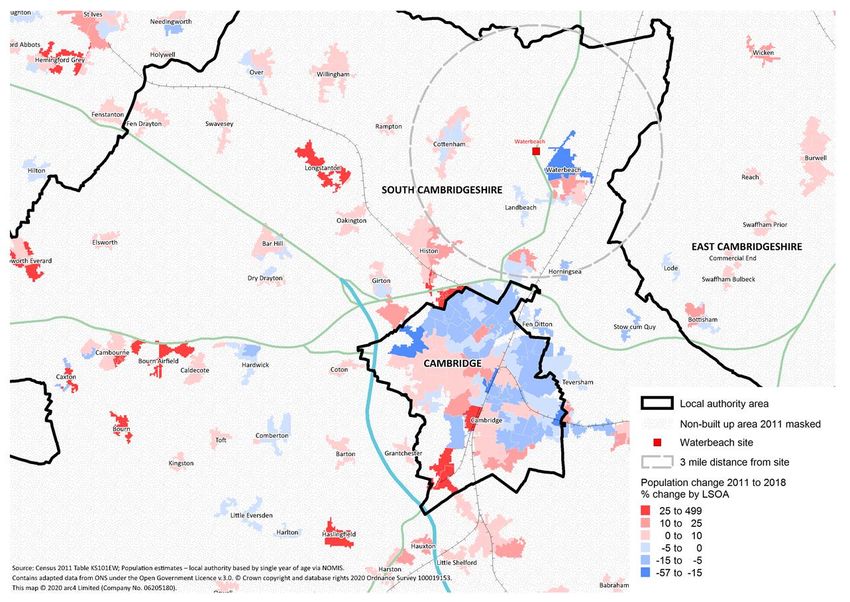
Population 2011 to 2018
From 2011 to 2018, the
market around
Waterbeach has
exhibited some
population growth
whereas in other
locations, population
losses are recorded.Page | 27 ACTIVITY IN THE PRIVATE RENTED SECTOR MARKET All data reflects a 3-mile radius around the site
Page | 28

Private rental market data

        Property size coming onto the                         Number of rental properties coming to market
         rental market by number of                                         through Zoopla
                  bedrooms                              250                                                   233
 40.0                                                           199       194                    196
                                                        200
 30.0
                                                        150                          138
 20.0
                                                        100
 10.0
                                                        50
  0.0
         2015     2016       2017         2018   2019
                                                         0
                   0     1   2   3   4+                        2015      2016        2017        2018        2019

Zoopla records properties coming onto the rental market in terms of numbers that are advertised through its website. These figures represent the
market before the outbreak of the Covid-19 pandemic, which may have altered trends and whose long-term impacts are still not known.
Over the past 5 years, in the 3-mile radius around Waterbeach, there has been a growth in the numbers coming onto the market overall. However,
this is a relatively small tenure in South Cambridgeshire and the numbers coming onto the market are also relatively small. Growth has accelerated
in the past 2 years.
The market is dominated by 2, 3 and 4 bed housing, suggesting a family orientated market. Agents confirmed these are popular property sizes.
Throughout the report ‘0’ beds represent a bedsit or equivalent.

Source: © 2020 Zoopla Limited
Page | 29
Percentage breakdown of the rental market by rent band
2019
2018
2017
2016
2015
0% 10% 20% 30% 40% 50% 60% 70% 80% 90% 100%
2015 2016 2017 2018 2019
£0-£500 PCM 1.0 0.5 0.7 2.0 0.0
£501-£750 PCM 8.9 10.5 6.6 7.6 5.4
£751-£1000 PCM 50.3 52.1 47.4 47.0 46.1
£1001-1250 PCM 19.4 25.1 21.1 27.6 25.7
£1251+ 20.4 11.9 24.3 15.8 22.8
£0-£500 PCM £501-£750 PCM £751-£1000 PCM £1001-1250 PCM £1251+
This chart illustrates how the market within a 3 mile radius of the site splits between monthly rent levels. The percentage size of the lower value
market band (£0 to £750) per calendar month has reduced from 9.9% in 2015 to 5.4% in 2019.
Conversely, higher value market bands have exhibited growth. The £1001 to £1250 band has grown to 25.7% and the £1251+ band has grown to
22.8%. These two bands now make up 48.5% of the market in 2019 compared to 39.8% in 2015.
Given that the market is small, it is likely created through increasing rent levels, although agents did confirm demand for a higher specification
offer.
Source: © 2020 Zoopla LimitedPage | 30 RENT LEVELS AND CHANGE All data reflects a 3-mile radius around the site
Page | 31

                                           Median rent levels by number of bedrooms 2015-2019
                     1600
                     1400
                     1200
                     1000
                      800
                      600
                      400
                      200
                        0
                                    2015                 2016                 2017                   2018               2019
                       0            609                  610                  611                    750                823
                       1            676                  702                  776                    776                793
                       2            823                  875                  849                    923                923
                       3            997                  1049                 988                    1099               1049
                       4+           1201                 1426                 1400                   1274               1452
                       Total        875                  901                  901                    949                975
                                                        0       1      2      3      4+      Total

The chart above shows that rent levels within a 3 mile radius of the site have exhibited growth between 2015 and 2019 for all property sizes. Overall,
monthly rents are around £975. Higher level growth is recorded for smaller units, but this is a relatively small sample and should only act as a guide.
Growth in rents here could be created through a shortage in supply.
Source: © 2020 Zoopla Limited
Page | 32
The chart to the left shows that rent levels are increasing in the 3-mile
Percentage rent change by size (number of radius around Waterbeach for all property types and percentage
bedrooms) 2015-2019 increases are higher for bedsits, 1-bed and 4-bed units. This may be
due to a small number of these type of units.
40.0 35.1
35.0 Agents confirmed that rent levels had been rising over time.
30.0
25.0
20.0
20.0 17.3
15.0 12.1 11.4
10.0 5.2
5.0
0.0
0 1 2 3 4+ Total
Source: © 2020 Zoopla LimitedPage | 33 TIME TAKEN TO LET IN THE PRIVATE RENTAL MARKET All data reflects a 3-mile radius around the site
Page | 34

              Time to let (weeks) by number of bedrooms                      Time to let (weeks) by number of bedrooms
         10                                                                                      2019
          8
          6                                                            5
          4                                                                    4                               4
          2                                                            4
          0
                 2015      2016       2017      2018       2019                          3                               3
       1           1         2          6        0          4          3
       2           2         3          5        2          3
                                                                       2
       3           2         2          3        4          1
                                                                                                    1
       4+          6         7          2        8          4          1
       Total       2         3          4        2          3
                                                                       0
                    1      2      3      4+      Total                         1         2          3         4+        Total

         Source: © 2020 Zoopla Limited

The time to let can be a useful indicator of demand / under supply in the market.
The timescale in the tables above is shown in weeks and should be regarded in terms of trends.
Agents confirmed properties can let very quickly.
This data is based on agent definitions and therefore we cannot ensure consistency in approach. However, as trend data, it confirms that all property
lets quickly.
Page | 35 CAPITAL VALUES All data reflects a 3-mile radius around the site
Page | 36

        Property values by number of bedrooms                                       Property value increases by
                       (Zoopla)                                                   number of bedrooms 2015-2019
     600000
                                                                                             (Zoopla)
     500000
     400000                                                                 50
     300000
     200000                                                                       39.1
     100000                                                                 40
          0
                 2015           2016         2017      2018        2019
       1        143750         119950       215000    215000      200000    30                      24.1             24.1
       2        230000         242500       260000    260000      250000    20                               16.7
       3        290000         325000       360000    350000      360000                    8.7
       4+       450000         460000       475000    500000      525000    10
       Total    295000         325000       377500    350000      365995     0
                         1       2      3      4+      Total                        1        2       3        4+     Total

Source: © 2020 Zoopla Limited                                              Source: © 2020 Zoopla Limited

                               (Land Registry)
                                                                           Capital values are considered from two data sources. Land Registry is
               500000                                                      a more accurate source but cannot consider property size. Zoopla is a
               400000
               300000
                                                                           good sample of the market and can consider property size.
               200000                                                      Zoopla confirms rising property values within the 3-mile radius for all
               100000                                                      property types.
                    0
                              2015       2016         2017        2018
       Detached              400000     445000       442498      420000
       Flat                  157000     206750       200000      200000    Land Registry data confirms increasing values for all property types.
       Semi Detached         259950     318500       334995      336498
       Terraced              239575     263500       278500      295000
       Total                 272000     337500       350498      347500
                                                                           Contains HM Land Registry data © Crown copyright and database
       Detached         Flat     Semi Detached        Terraced     Total   right 2020. This data is licensed under the Open Government Licence
                                                                           v3.0
Page | 37
Percentage of the market by price band
2019
2018
2017
2016
2015
0% 10% 20% 30% 40% 50% 60% 70% 80% 90% 100%
2015 2016 2017 2018 2019
£0-£250000 35.7 22.0 9.8 19.0 19.0
£250001-£350000 30.7 34.9 29.5 32.5 28.1
£350001-£450000 17.6 21.2 33.9 24.5 27.8
£450001-£550000 7.1 13.7 16.5 11.8 10.6
£550001+ 8.8 8.2 10.2 12.2 14.4
£0-£250000 £250001-£350000 £350001-£450000 £450001-£550000 £550001+
The sales market is distributed across price points.
Over time, the higher value markets (£350k+) have shown growth, whilst lower value properties have reduced in their market share in the 3 miles
around Waterbeach.
Source: © 2020 Zoopla LimitedPage | 38
Help to Buy Programme 2013 to 2019 First Time Buyer
In this table, HTB stands for Help to Buy; FTB stands for First Time Buyer.
Private
new Total HTBs FTB* as %
Total Help to FTB* Help to FTB* Help to
build as Total HTB of
Buy Buy Buy
2013- Equity
% of new HTB loan
Equity Loans build 2013- Equity Loans Equity Loans
19 Loans 2013- value 2013-
Local Authority name (units) 2013-19 (no.) 19 2013-19 (no.) 19 (£m) 2013-19 (£m) 19
South Cambridgeshire 3,960 886 22.4 689 58,461,422 44,062,397 75.4
East Cambridgeshire 1,360 249 18.3 200 12,417,635 9,760,012 78.6
Huntingdonshire 3,620 1,015 28.0 772 55,204,113 40,009,403 72.5
West Suffolk 2,700 52 1.9 39 3,249,025 2,346,836 72.2
Forest Heath (to 2019) 1,150 336 29.2 259 18,050,998 13,153,790 72.9
St Edmundsbury (to 1,550 362 23.4 272 19,916,073 14,300,923 71.8
2019)
Cambridge 4,090 299 7.3 261 24,117,449 20,773,131 86.1
East Region 103,970 30,019 28.9 23,763 1,694,541,279 1,293,761,719 76.3
England 852,620 236,068 27.7 192,012 13,444,463,510 10,765,005,419 80.1Page | 39 This table shows that the number of Help to Buy purchases during 2013 to 2019 in South Cambridgeshire was high compared to most other parts of the sub-region, and considerably higher than in Cambridge City. Although as a percentage of new-builds they were lower than some other parts of the sub-region and lower than the Eastern Region and England as a whole. Sources MHCLG, Table 253 Housebuilding: permanent dwellings started and completed, by tenure and district, 2013-19 MHCLG, Help to Buy (equity loan scheme) statistics, April 2013 to 30 June 2019, England Adapted data from the Office for National Statistics under the Open Government Licence v.3.0
Page | 40

AGENT FEEDBACK
Page | 41

Agent feedback
Please note: The following feedback was received prior to the Covid-        Agents confirmed that affordability was a major stumbling block for
19 pandemic taking hold.                                                    households looking to get onto the property ladder in both Cambridge
                                                                            and South Cambridgeshire. For lower quartile price, the price income
Waterbeach is a rural village to the north of Cambridge, close to the       ratio in Cambridge in October 2019 was 14.4 and in South
A10 linking Cambridge to Ely and to the Milton Park and Ride. There         Cambridgeshire 10.2. These figures are 10.5 and 8.3 for median
is a main railway station which is walkable from the barracks.              quartile property prices respectively (Housing Market Bulletin issue
In terms of the rental market, 2-, 3- and 4-bedroom houses are in           43).
high demand, especially those properties with gardens. There is no          Agents felt that Waterbeach would likely be attractive to people
obvious over or under supply of property in Waterbeach. Agents              working in the business park / science park in Cambridge, providing
confirmed that the rental market is busy and strong in Waterbeach.          an out of city environment and potentially providing a more affordable
Rents have risen steadily, and agents confirmed that properties let         option. Agents described Waterbeach as a ‘family-oriented area’ and
very quickly in Waterbeach and if they are priced correctly, they will      therefore believed that houses would be more popular than
let quickly. Unfurnished accommodation was most popular in                  apartments.
Waterbeach for longer term lets.
                                                                            Agents estimated monthly upper quartile rents for the following
The characteristics of renting households are:                              properties in Waterbeach as:
•   professional couples and singles wishing to maintain their              •   2-bedroom apartment: around £800 to £900 per month;
    independence and flexibility within the employment market; and
                                                                            •   2-bedroom house: around £9501,100 per month
•   couples and small families ready to settle down but cannot afford
                                                                            •   3-bedroom house: around £1,250-£1,300 per month;
    a deposit for home ownership.
                                                                            Agents confirmed there is a market for a higher specification product,
Agents were very positive about the potential of introducing rental
                                                                            as a lot of the current offer is of ‘basic standard’. In terms of
property in Waterbeach. Agents felt that Waterbeach will capitalise
                                                                            affordability, some of the families and young professionals interested
on its ability to attract households wishing to rent but currently living
                                                                            in the area have a decent disposable income. Agents felt that both
in Cambridge and facing expensive rental options and wanting to live
                                                                            apartments and houses would be popular and rent easily. Gardens
in a more suburban setting. Agents felt that Waterbeach could
                                                                            were said to be important. Car parking was also deemed to be a
‘absorb rental properties in their 100s, rather than 10s.’
                                                                            priority.
Agents confirmed that rented products would be attractive in
Waterbeach and would likely attract a range of household incomes
and could provide much needed accommodation to the likes of
Addenbrooke’s Hospital.
Page | 42 Peterborough Peterborough has a strong and buoyant housing market with demand set to continue in the future. Agents reported that it is an affordable area in comparison to other areas further south, such as Bedford and Cambridge, especially with regards to rental prices. In relation to sales prices, one agent quoted that buyers could get a 3-bed property for as little as £140k. It is also a popular area for people from London. Agents confirmed that prospective buyers and renters from Peterborough, would potentially be willing to travel further afield, for example South Cambridgeshire, to buy or rent. Agents told us that they have experienced people from Peterborough looking in areas surrounding Cambridge such as Milton, Newport and Royston to buy and rent. Agents confirmed some demand in Waterbeach would likely come from Peterborough and other surrounding towns. Agents also reported that London workers may be interested in a Build to Rent scheme in the target area as prices would be a lot more affordable in comparison to London, if schemes had the right specification and offer. Agents took the view that rental properties will be popular, especially from people with temporary jobs or those wanting to test the area before purchasing. Agents confirmed that there will be interest from commuters, specifically people who work in Cambridge who currently live in Peterborough as they can move closer to work.
Page | 43

COMPETITION - RENTALS
Page | 44

We conducted a Rightmove search (February 2020) on the current rental offer in Waterbeach (+1mile), which produced 12 results, with 5 being in
Waterbeach.
Page | 45

THE PLANNING PIPELINE
Page | 46

Pipeline Overview
Obviously, this is a very active and competitive market. South Cambridgeshire has an annualised average housing requirement of 975 homes per
year to 2031. The Council’s latest assumptions on housing delivery within the adopted plan period are set out in the Greater Cambridge housing
trajectory, which is updated annually.
Page | 47

THE ROLE OF BUILD TO RENT IN
PLACE SHAPING
Page | 48

Place shaping
In assessing what Build to Rent schemes might bring to an area, there is a need to consider what impact they might have in terms of place-shaping.
The Build to Rent sector is focused on generating long-term income so it takes a long-term interest in the property, surrounding public realm and
the wider community within which a development sits. Single ownership of a building and its associated public realm provides a strong ability and
incentive to create, manage and maintain good quality places. Build to Rent operators (and those who ultimately own the building) rely on the
strength of their reputation and brand.
At Waterbeach, where the market is planning to deliver up to 11,000 units, Build to Rent should support the development of the site by contributing
to the Supplementary Planning Document Strategic Development Objectives as shown in the table below.

Waterbeach Supplementary                  Potential Build to Rent contribution to Waterbeach Supplementary Planning Document
Planning Document strategic               Objectives
development objectives

Comprehensive & sustainable               -   Maximise the potential of public transport, requiring fewer car park spaces.
development; biodiversity;
                                          -   Provide energy efficient buildings that minimise operational carbon.
sustainable movement to, from and
round the town; and high quality,         -   Provide high quality, well managed schemes that contribute to public realm and establish new
innovative and distinctive design             local amenities.
                                          -   Provide the potential to speed up delivery.

Access to open space and the natural      -   Provision of high quality outdoor spaces.
environment
Page | 49
Health & Wellbeing, and strong - Create a more diverse property market from what is currently on offer; introducing different
communities & future governance; co- property types and tenures including affordable housing to support a range of needs and
ordinated delivery incomes.
- Provide an additional opportunity for smaller housing that assists people to downsize their
home as they move through the life cycle.
- Provide active uses on the ground floor to contribute to the ‘eyes on the street’ principle.
- Potentially support home working, as schemes can be developed with shared workspace
opportunities.
- Provide concierge services to enhance resident safety.
- Create job opportunities and support the local economy.
- Provide homes to economically mobile professionals and homes for workers who deliver key
services, and for families and older people.
- Provide longer term tenancies than are generally available in the private rental market
- Establish gyms and other facilities to improve health.
- Potentially provide a long-term income stream to the local authority if it has considered direct
investment in Build to Rent.Page | 50 Most of the documentary evidence available highlights the positive benefits that Build to Rent can bring to an area. However, the market is still relatively young, and larger schemes are now starting to come forward as investor confidence grows. As Build to Rent becomes more mainstream there is the potential for more critical research and analysis to start coming forward around whether there are disadvantages and risks around Build to Rent schemes, for councils, for scheme residents and for the wider community. A desktop search suggests there may be potential issues around things like: high tenancy turnover if tenants opt for shorter length tenancies; less affordable housing and community infrastructure contributions provided than on other s106 developments; community risks later if schemes are decommissioned; long-term investment returns impacting on viability and therefore on mitigating against place-shaping concerns; and questions around the extent to which schemes will deliver mixed communities. There is a potential friction between the 20% affordable rent recommendation in National Planning Practice Guidance (NPPG) and the 30 to 40% plus ambition for affordable housing that the Waterbeach Supplementary Planning Document contains. Any shortfall may increase pressure on other developments’ viability as they may have to increase their own provision to bring the whole level back to the required percentage This means that all Build to Rent proposals should be considered in the context of broader objectives and housing targets at the time that they are developed to ensure that place-shaping is not negatively impacted. More detail on place-shaping issues is provided in the overarching Overview and Summary of Site-Specific Appraisals published alongside this report.
Page | 51

SUMMARY
Page | 52

South Cambridgeshire is a largely rural district which surrounds the          The Private Rented Sector plays an important part in the overall
City of Cambridge and comprises over 100 villages, none currently             housing market in the sub‐region and factors such as affordability of
larger than 8,000 persons and Waterbeach will potentially provide             purchase and the national policy agenda mean that private renting is
8,000 to 9,000 new homes.                                                     likely to continue to grow over the coming years. At present it remains
South Cambridgeshire has become home to many of the clusters of               relatively low in South Cambridgeshire at 12%, with a slightly larger
high technology research and development in the Cambridge Sub-                social housing sector and owner occupation at around 70%. The
Region and is recognised as one of the top places to live and work            Waterbeach Supplementary Planning Document confirms that new
in the country and is one of the fastest growing areas in the country.        build private rented/Build to Rent schemes could make a valuable
The socio-economic indicators all support this, and it is one of the          contribution to the overall mix of housing at the new town and its pace
least deprived locations in the country. It is ideally located with readily   of development.
accessible transport routes to London, Stansted airport and the Port          The existing rental sector seems popular and whilst generally smaller
of Felixstowe.                                                                numbers come onto the market, this has been growing over the past
Waterbeach is likely to be a popular alternative offering high quality        few years. The market is dominated by larger properties, but all
architecture design of buildings and public realm with emphasis on            properties are in demand, according to agents who also confirmed the
measures to reduce the carbon footprint and energy use of the new             rising rent levels and that properties let quickly.
homes.                                                                        Agents recognise the potential of the proposed area to provide
Economic growth in Cambridge and South Cambridgeshire                         affordable rented alternatives to sale and recognise a wide catchment
continues, and jobs growth in the area remains strong. The                    area reaching into Cambridge as well as surrounding towns. Demand
attractiveness of the area as a place to live combined with this growth       for a higher specification product is clearly recognised as well as the
has led, over the years, to high house prices. Therefore, many people         opportunity of utilising Affordable Private Rent.
who work in the area are unable to afford to live in the area.
Page | 53

Essentially the nearest comparable scheme to this opportunity is           Agents confirmed that there is interest in rented options in South
Northstowe. Again, we can assume that the focus will be on                 Cambridgeshire and this offer would likely be popular and would likely
executive homes aimed at the £300k plus mark along with smaller            attract a range of incomes and could provide much needed
family homes for rent, to be popular. With the connectivity and            accommodation to the likes of Addenbrooke’s Hospital. Clearly, any
proximity to Cambridge, this site is a prime opportunity to deliver a      new town has to bring forward a rental offer, and we would expect any
private rented offer.                                                      opportunity from a niche developer to build on scale, apartments or
                                                                           small dwellings and apartments for shared ownership and affordable
The key driver affecting the need for affordable housing and
                                                                           rent.
Affordable Private Rent will be the high cost of buying or renting on
the open market in comparison to local household incomes.                  The location of the site and the connectivity to Cambridge plus
                                                                           transport links to the wider area including London, provides an ideal
There is a strong commitment to provide affordable housing in
                                                                           base for developing a private rented offer within this scheme. The
Waterbeach. The South Cambridgeshire Local Plan confirms that the
                                                                           provision focuses on 30% affordable housing but with potential for
number, type, and tenure of affordable housing will be negotiated on
                                                                           additional units up to 40% based on viability. Whilst Affordable Private
a site by site basis and informed by the current housing strategy, local
                                                                           Rent is not specified, Build to Rent is confirmed as having the potential
housing need and relevant site constraints.
                                                                           to make a valuable contribution to the overall mix of housing at the new
There is clearly an opportunity for Build to Rent here and it is           town.
recommended that the planning authorities should develop a clear
policy approach to Build to Rent in Waterbeach, taking into account
the need for positive place-shaping to meet the Waterbeach
Supplementary Planning Document objectives.
At present there is not a comparable rental market to consider.
However, evidence from Bidwells summer 2019 Build to Rent
analysis confirms that given accelerating demand for globally mobile
talent by knowledge-based industries across the Oxbridge Growth
Arc, demand for Build to Rent and investor interest across the region
has increased. Agents confirmed that affordability was a major driver
for households looking to get onto the property ladder in both
Cambridge and South Cambridgeshire.
Page | 54 RECOMMENDATIONS FOR POLICY OPTIONS
Page | 55

Recommendations for policy options                                         Rent levels for Affordable Private Rent
The following section provides some key potential policy options           Identified issue: The National Planning Policy Framework requires a
based on the research presented in the sections above to be                minimum rent discount of 20% for Affordable Private Rent homes
considered for Waterbeach.                                                 relative to local market rents. In line with national guidance, the
Affordable Private Rent                                                    discount should be calculated when a discounted home is rented out,
                                                                           or when the tenancy is renewed. The rent on the discounted homes
Identified issue: Both Cambridge and South Cambridgeshire’s                should increase on the same basis as rent increases for longer-term
Local Plans require 40% of homes on sites of 11 or more dwellings          (market) tenancies within the development.
to be provided as affordable housing. Therefore 60% of all section
106 developments (subject to viability) are expected to be market          Policy option: Affordable Private Rent should be let at an agreed
housing. In terms of delivering Affordable Private Rent, national          discount from the local market rent based on an equivalent local
guidance states that 20% is generally a suitable benchmark for the         property. Discount levels should reflect local affordability to ensure the
level of Affordable Private Rent homes to be provided (and                 homes meet the local need for affordable housing. Some properties
maintained in perpetuity) in any Build to Rent scheme. If local            (such as larger ones) may require a higher discount than others to
authorities wish to set a different proportion, they should justify this   meet local affordability requirements.
using the evidence emerging from their local housing need                  Build to Rent developers should assess the market rent using the
assessment and set the policy out in their Local Plan. Similarly, the      definition of the International Valuations Standard Committee as
guidance on viability permits developers, in exception, the                adopted by the Royal Institute of Chartered Surveyors (or local
opportunity to make a case seeking to differ from this benchmark.          equivalent).
Policy option: We would recommend that a minimum of 20% is
established, subject to local evidence. Subject to viability, local
authorities may wish to seek a higher percentage based on local
evidence and policy requirements.
Page | 56
Housing mix
Identified issue: Place Alliance, published a National Housing Audit In relation to Affordable Private Rent, consideration should be given to
in January 2020 on the design quality of new housing developments. providing a range of unit sizes, including family sized units, potentially
It was based on a design audit of 142 housing developments across in equal proportions to the market Build to Rent units, based on local
England, and correlations with data on market, contextual and design market conditions.
governance factors; a check list of 17 design considerations was
Management and location
published which confirmed the need to provide a mix of housing
types to meet housing local needs. Identified issue: Affordable Private Rent homes risk being relegated
to less prominent parts of the site.
The South Cambridgeshire Local Plan 2018 confirms: A wide choice,
type and mix of housing will be provided to meet the needs of Policy option: Affordable Private Rent homes should be under
different groups in the community including families with children, common management control, along with the market rent Build to Rent
older people, those seeking starter homes, people wishing to build homes. They should be distributed throughout the development and
their own homes, people seeking private rented sector housing, and physically indistinguishable from the market rent homes in terms of
people with disabilities. It goes on to give a percentage mix in relation quality and size. Combining the two tenures this way, as well as
to sizes of homes. supporting a more mixed community, improves viability and any
The Greater Cambridge Housing Strategy confirms the need for ‘a alternation of units between Affordable Private ent and market rent
wide and varied choice of good quality, sustainable homes of over time is made easier.
different sizes, types and tenures, including new provision of council
Covenants
homes, to meet the needs of a wide range of different households
and age groups’ Identified issue: Build to Rent schemes would normally be expected
to remain within the rental sector, under common ownership and
Policy option: Waterbeach provides opportunities for a wide mix of management, for the long term; although circumstances may arise
sizes, types and tenures of housing. This could include a variety of where schemes need to be decommissioned at some point in the
affordable housing tenures for rent and other affordable routes to future.
home ownership, purpose built private rented sector housing and
open market housing. There is also an opportunity to plan and deliver
a range of housing products aimed at specific groups, for example
local workers, as well as housing tethered to employment use within
the area.Page | 57
Any Affordable Private Rent homes included as part of a scheme, There will continue to be many sites coming forward of up to 250 units
through a section 106 agreement, are provided specifically as a but there is also likely to be a growth in developments of larger
community benefit in perpetuity. The sale of a Build to Rent scheme, numbers of units of 250+. There are also a significant number of
or the sale of individual homes within the scheme to other tenures, schemes of up to 100 units coming forward, and there will be more at
should not result in the withdrawal of the affordable housing 250+ as schemes are completed. There are 15 schemes in planning
contribution from the local community. National guidance sets out a at over 1000 units. Clearly the size of schemes is increasing.
recommended formula for calculating any clawback.
Policy option: As well as ensuring any affordable housing
Quarter 2 2019 Number of schemes by unit
contribution is set in perpetuity, consideration should be given to a size band
covenant period for the retention of private market rent homes in that 300
tenure and potential compensation mechanisms in the event that that 250
they are sold before the expiration of an agreed covenant period.
200
The government guidance on Build to Rent states that operators will 150
want sufficient flexibility to respond to changing market conditions
and onerous exit clauses may impede development. However, the 100
Greater London Authority’s latest planning guidance recommends 50
that all Build to Rent developments have 15-year covenants. The 0
Greater London Authority has the most experience of Build to Rent Up to 100 100-250 250-500 500-1000 1000+
in the UK and as such we recommend that the councils consider
Complete In construction Planning
using this as a baseline to work from.
Size of schemes Source: British Property Federation
Identified issue: There is no best practice or policy guidance on the At the end of Quarter 4 2019 (not illustrated), the average size of each
potential size of Build to Rent schemes. Generally, the national completed Build to Rent scheme was 141 homes; this increases to 253
market (those completed or in construction) is focused on schemes homes for the schemes under construction, while the average size of
of a scale around 100-250 units. The units in planning nationally schemes in the planning system is higher still at 317 homes.
confirms where the market is most likely to grow.Page | 58
The British Property Federation says the larger size of schemes The table below illustrates the sorts of rent levels that could potentially
underlines the growing importance of Build to Rent in increasing UK be affordable, based on different affordability ratios, for a number of
residential supply and meeting government house building targets. key worker groups and for someone on a local authority median full-
Policy option: The minimum number of units that a scheme should time wage.
have in Waterbeach, as a strategic site, should be 50 units. There is Monthl
no maximum number that it is appropriate to apply to all sites, but it South Cambridgeshire
y wage 30% 35% 40%2
is recommended that any planning submissions should evidence
1,28 1,50 1,71
how the scheme will support the place shaping agenda and meet 1.5 x median full time wage1 4295
9 3 8
local housing need, and demonstrate that the scheme complements
1,03 1,21 1,38
the existing or proposed surroundings in terms of scale and other Police sergeant (starting) 3458
8 0 3
wider policy considerations including overall scheme viability.
1,00 1,14
Median full time wage1 2864 859
Target markets and affordability 2 5
1,04
Identified issue: Waterbeach will provide mixed use functions Health visitor (starting) 2614 784 915
6
encompassing housing, retail, employment and leisure. It will 1,02
promote active travel and public transport and have excellent Teacher (mid-main range) 2550 765 892
0
transport links into Cambridge. Social worker (fully trained-
2470 741 864 988
Therefore, it will most likely attract a range of households and starting)
incomes, and access to a diverse range of quality jobs and excellent Police constable (3 years) 2186 656 765 875
neighbourhood facilities. This will mean providing accommodation for Supported lettings officer
2108 632 738 843
(starting)
a range of households who may not be able to afford to buy a
Classroom teacher (minimum) 2031 609 711 812
property given the affordability challenges in the area. It is also likely
Ward nurse/midwife (starting) 2018 605 706 807
to be attractive to younger households starting out who may not be
able to afford to buy or who may actively choose to rent, and working Notes:
households whose incomes limit their housing options and for whom 1. Median monthly earnings for people working in the local authority
securing a quality rental product would be attractive. area regardless of where they live. This gives a sense of the potential
earnings in the market.
2. 40% of gross income raises affordability issues and may not be
sustainable in the long term.You can also read