"We all want what's best for our kids" - Discussions of D.C. public school options in an online forum
←
→
Page content transcription
If your browser does not render page correctly, please read the page content below
“We all want what’s
 best for our kids”
 Discussions of D.C. public school
 options in an online forum

 Vanessa Williamson, Brookings Institution
 Jackson Gode, Brookings Institution
 Hao Sun, Gallaudet University

This project has been four years in development, and we thank the many
people who contributed along the way. Makada Henry-Nickie conducted the
webscrape with Hao Sun. Betsy Wolf’s “Data for DC” project provided crucial
multi-year data about the DC schools. Samantha Elizondo, Curtlyn Kramer,
Gavin Downing, Mohammed Memfis, Nicolas Smith, and Kennedy Teel provided
research assistance. We received extremely helpful feedback on earlier drafts
of the paper from Audrey Reese, Richard Reeves, Erin Roth, and Jon Valant. All
errors are the authors’ own.
D I S C U S S I O N S O F D. C . P U B L I C S C H O O L O P T I O N S I N A N O N L I N E F O R U M                                                     1

Table of Contents
Introduction. . . . . . . . . . . . . . . . . . . . . . . . . . . . . . . . . . . . . . . . . . . . . . . . . . . . . . . . . . . . . . . . . . . . . . . . . . . . . . . . . . . . . . . . . . . . . . . . . . . . . . . . .     2

Public Education in the Nation’s Capital. . . . . . . . . . . . . . . . . . . . . . . . . . . . . . . . . . . . . . . . . . . . . . . . . . . . . . . . . . . . . . . . . . . . . . . . . .                                       4

About the Data. . . . . . . . . . . . . . . . . . . . . . . . . . . . . . . . . . . . . . . . . . . . . . . . . . . . . . . . . . . . . . . . . . . . . . . . . . . . . . . . . . . . . . . . . . . . . . . . . . . . . .         5

Which Public Schools are Discussed on DC Urban Moms? Which Schools are Ignored?. . . . . . . . . . . . . . . . . . .                                                                                                              9

Location, Location, Lottery: DC Urban Moms and Strategies to “Win” School Assignment. . . . . . . . . . . . . . . .                                                                                                               18

How Do DC Urban Moms Participants Talk about Test Scores?. . . . . . . . . . . . . . . . . . . . . . . . . . . . . . . . . . . . . . . . . . . . . . .                                                                            27

Discussion.. . . . . . . . . . . . . . . . . . . . . . . . . . . . . . . . . . . . . . . . . . . . . . . . . . . . . . . . . . . . . . . . . . . . . . . . . . . . . . . . . . . . . . . . . . . . . . . . . . . . . . . . . .    31

Conclusion. . . . . . . . . . . . . . . . . . . . . . . . . . . . . . . . . . . . . . . . . . . . . . . . . . . . . . . . . . . . . . . . . . . . . . . . . . . . . . . . . . . . . . . . . . . . . . . . . . . . . . . . . .     34

Appendix A: Outside Sources and DC Urban Moms.. . . . . . . . . . . . . . . . . . . . . . . . . . . . . . . . . . . . . . . . . . . . . . . . . . . . . . . . . . . .                                                             35

About the Authors. . . . . . . . . . . . . . . . . . . . . . . . . . . . . . . . . . . . . . . . . . . . . . . . . . . . . . . . . . . . . . . . . . . . . . . . . . . . . . . . . . . . . . . . . . . . . . . . . .              36

Endnotes. . . . . . . . . . . . . . . . . . . . . . . . . . . . . . . . . . . . . . . . . . . . . . . . . . . . . . . . . . . . . . . . . . . . . . . . . . . . . . . . . . . . . . . . . . . . . . . . . . . . . . . . . . . .   37

2

                Introduction

          E    ven as the nation has grown more diverse, American public schools remain racially segregated.1 Economic
               segregation in education is also on the rise.2 In recent years, new attention has been brought to the
           role that upper-middle-class white parents living in diverse metropolitan areas have played in reinforcing
           segregation in their local school systems.3 The demographics of a school’s student population, particularly
           the racial and economic status of students, strongly influence parents’ perceptions of school quality.4 White
           families generally avoid schools with high percentages of minority students,5 and some actively resist plans
           that would integrate schools.6

        While informal comments from peers are known to be an important factor in parents’ decisionmaking
        about schools,7 we have little quantitative data about how this information is filtered through these parents’
                                                               networks, how bias and misinformation operate within
                                                               them, and how parents communicate with each other
                                                               about school quality. Using data from the online parent
Much of the local school system is                             forum, “DC Urban Moms and Dads” (commonly known
simply invisible; many schools are                             as “DC Urban Moms”) and publicly available Washington,
never discussed.                                               D.C., school data, this paper explores how an online com-
                                                               munity, one that appears to be dominated by privileged
                                                               parents, discusses its local school system. As the title
        suggests, we examine what kind of schools these parents see as “best” for their kids, and how they go about
        ensuring that their idea of “best” is what their kids receive.

           The conversations in the “DC Public and Public Charter Schools” forum shine a light on the mechanisms
           of segregation in the District’s public education system. We find that in DC Urban Moms’ conversations,
           schools are clustered—by grade, geography, and sector, but also by the racial makeup of the student body.
           These different school clusters are discussed using different terminology. We also find that within the DC
           Urban Moms’ forum much of the local school system is simply invisible; many schools are never discussed.
           Instead, a small fraction of the school system—generally, schools with a sizeable white population and
           schools in wealthy or gentrifying neighborhoods—receive an outsized share of attention. The correlation
           between attention to a school and its racial demographics persists, even within a gentrifying neighborhood.
D I S C U S S I O N S O F D. C . P U B L I C S C H O O L O P T I O N S I N A N O N L I N E F O R U M   3

A case study suggests that the release of a new system of official data on school quality did not alter these
patterns. Finally, a great deal of the activity on the forum is dedicated to discussing how to leverage the
District’s complex school choice system to ensure that
one’s children are in one of the small number of public
schools deemed acceptable, a process that reinforces
the District’s geographic and educational segregation.
                                                                                 The correlation between attention to
                                                                                 a school and its racial demographics
                                                                                 persists, even within a gentrifying
                                                                                 neighborhood.
4

              Public Education in the
              Nation’s Capital

        P   ublic education in the District includes a system of traditional public schools and a system of public
            charter schools; in 2018–19, these schools served over 90,000 students at 182 schools.8 The city is
        highly diverse, as is the incoming school-age population. Among children under five, 48 percent are Black, 27
        percent are white non-Hispanic, and 17 percent are Hispanic.9 54 percent of the city’s public school students
        are in traditional (DCPS) public schools, while 46 percent are in public charter schools (DCPCS). All students
        have the right to attend their local public school, or they can enter a lottery for a seat at another traditional
        public school or public charter school.10

        In practice, parents’ school choices are limited. Housing in Washington is strongly segregated by race and
        class, with popular schools generally located in expensive or rapidly gentrifying neighborhoods.11 Housing
        prices in the District are high and rising, and affordable housing is in exceptionally short supply.12 The District’s
        school system does not provide regular school bus transportation; children can ride public transit to school
        for free, but commutes can be long, and it is often impractical for working parents to accompany young
        children to a school that is far from home.13 Most students attend a school in their own wards, with students
        in poorer parts of the city facing longer commutes.14

                                                                Even for parents willing or able to enroll their children
                                                                far from home, there remain fewer options than might
In making decisions about where to                              first appear. The most popular traditional public schools
send their children to school, parents                          rarely have spaces available to students who live beyond
(and especially more privileged                                 the school’s catchment area. Popular charter schools
                                                                often have waitlists of hundreds of students.15 Moreover,
parents) are key contributors to school                         researching the schools available via the lottery requires
segregation and inequality.                                     time and resources; school lottery waitlists are dominated
                                                                by families that are more socioeconomically privileged.16

        In making decisions about where to send their children to school, parents (and especially more privileged
        parents) are key contributors to school segregation and inequality. As the District of Columbia Auditor’s office
        has stated, “there is a pattern of District families moving away from schools with more students considered
        at-risk17 to schools with fewer students considered at-risk. These moves are facilitated by the robust choice
        model in DC.”18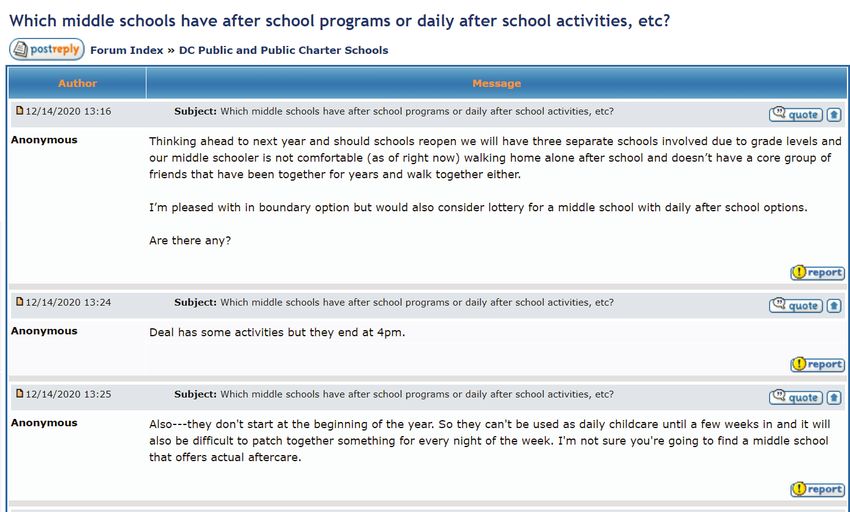
5

     About the Data

D   C Urban Moms has been a very active website for District parents since 2007. The website started as a
    mailing list in 2002 and was launched as a website in 2007.19 Currently, the site contains 55 forums on
subjects from religion to real estate to pets, but many of the most active forums pertain to education. Eleven
of the forums are devoted to schooling, including “DC Public and Public Charter Schools,” “Montgomery
County Public Schools,” and “Private/Independent Schools.” The education forums have a total of nearly 3
million messages.20

While the anonymity of the site prevents us from developing a comprehensive picture of participants, the
data suggest that many of those active in DC Urban Moms forums are highly privileged. Across all forums,
the zip codes most commonly referred to on DC Urban Moms are 20016, 20015, and 20007, the three most
expensive zip codes in the District.21 These three zip codes make up almost one-third of all District zip codes
referenced. Given the District’s residential segregation, it is also likely that the participants in DC Urban Moms
are substantially whiter than the city as a whole.22

Qualitative evidence reinforces the perception that many DC Urban Moms participants are upper-middle-class
professionals with substantial wealth. In one conversation titled ”Poll: Your Next Car,” the average sticker
price of the cars named was $37,800.23 Of course, we cannot entirely discount the possibility that some of
the participants in the DC Urban Moms community are providing aspirational, rather than accurate, pictures
of their financial well-being. But many of the conversations on the site suggest a deep familiarity, not just with
the objects of conspicuous consumption, but the more humdrum economic concerns of the upper-middle
class. A recent conversation on the “Money and Finances” forum was a lengthy and well-informed discussion
of the prospects for the repeal of the $10,000 cap on the state and local tax deduction.24 There may well
be substantial variation in the economic circumstances of DC Urban Moms participants, and also variation
between those who comment and those who merely read the site. Overall, however, the conversations that
occur on DC Urban Moms forums appear to be between people who live in economic comfort.

The forums are structured in the standard manner for online message boards, with community members
able to post a new topic or respond to existing conversations. For example, a recent conversation, “WaPo:
How D.C. and its teachers, with shifting plans and demands, failed to reopen schools,” contained over 275
messages, while another, “Does Latin accept 8th graders,” had only nine messages. Within a conversation,
replies are threaded; participants can respond to the initial message or respond to other responses. Almost
all commenters reply anonymously.25
6 D I S C U S S I O N S O F D. C . P U B L I C S C H O O L O P T I O N S I N A N O N L I N E F O R U M
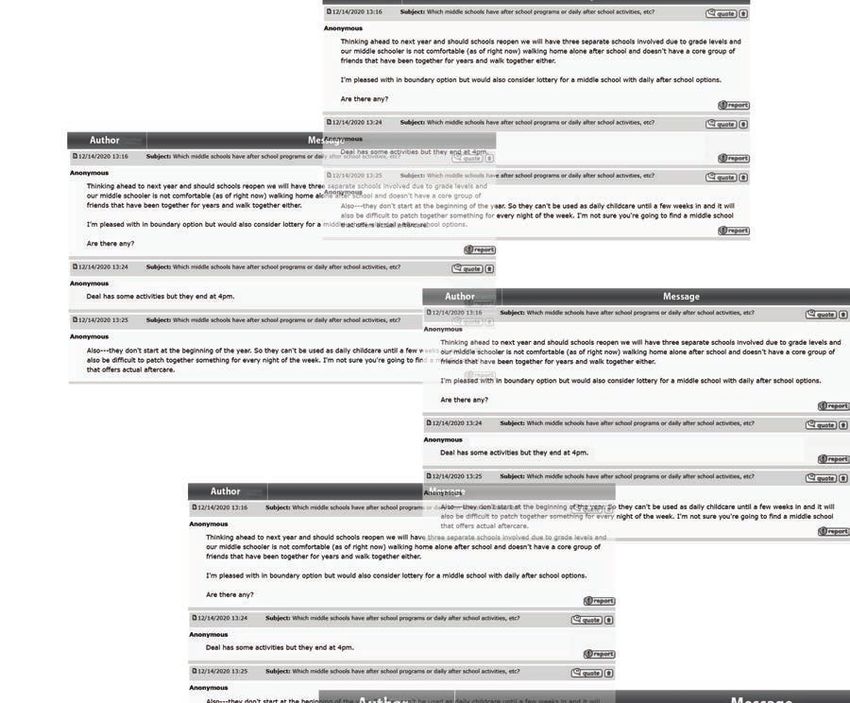
Figure 1: Sample of a Conversation Posted to the “DC Public and Public Charter
Schools” Forum
The following analysis focuses on the forum “DC Public and Public Charter Schools”; all data that follows
refers to this one forum. The dataset includes all posts between its launch in 2008 and April 2020, a total of
over 15,000 conversations and 400,000 messages.26 The median number of messages per conversation in
this forum is fourteen. Peak activity for “DC Public and Public Charter Schools” was in 2014 and 2015, with
over 2,000 new conversations started in each of those years.27 The forum remains extremely active, with an
average of more than 1,300 new conversations a year since 2016.
Within each conversation, we identified the schools that were mentioned.28 Overall, 78 percent of conversation
threads mentioned at least one school. The median number of schools mentioned in a thread is two, while
the average is just below five.
We also searched for over 500 keywords that help capture the substance of the discussion.29 These keywords
cover a wide array of topics, including basic vocabulary like “middle school” or “pre-k”; terms for the school
assignment process, such as “lottery” and “boundaries”; words for the governing institutions associated with
the school system, such as the “mayor”; words related to housing and the District’s neighborhoods; as well
as common adjectives like “best” or “happy.”30D I S C U S S I O N S O F D. C . P U B L I C S C H O O L O P T I O N S I N A N O N L I N E F O R U M 7
Of particular note are the words that refer to features of schools and the children who attend them. Tables
1 and 2 summarize the frequency of some of the most common words associated directly with the schools
and their students.
Table 1: What Features of Schools are Discussed?
Category (examples of included terms) Number of Conversations (%)
Staff (“principal” or “teacher”) 7357 (48.4%)
Subjects (“art”, “math”, or “science”) 6269 (41.2%)
Extracurriculars (“football” or “band”) 4632 (30.4%)
Language Programs (“dual language” or “immersion”) 3882 (25.5%)
Facilities (“after care”, “library”, or “playground”) 3723 (24.5%)
Buildings (“air conditioning” or “renovation”) 2607 (17.1%)
Advanced Programs (“AP” or “honors”) 2348 (15.4%)
Discipline (“tardy” or “suspension”) 2142 (14.1%)
Safety (“police”, “violence”, or “drugs”) 1526 (10.0%)
Size (“class size” or “overcrowded”) 812 (5.3%)
Table 2: What Words are Used to Describe the School Population?
Category (examples of included terms) Number of Conversations (%)
Involvement (“engaged” or “committed”) 5457 (35.9%)
Race (“Black”, “African-American”, or “white”) 4545 (29.9%)
Achievement (“high-achieving” or “underperforming”) 4320 (28.4%)
Income (“Affluent” “low SES”) 4015 (26.4%)
Behavior (“disruptive” or “troubled”) 2997 (19.7%)
Special Education (“special needs” or “disability”) 1655 (10.9%)
Language (“ELL” or “English speaking”) 1588 (10.4%)
At-Risk (“at risk” or “disadvantaged”) 1328 (8.7%)8 D I S C U S S I O N S O F D. C . P U B L I C S C H O O L O P T I O N S I N A N O N L I N E F O R U M
We can then connect the keywords to the schools that are discussed in any given conversation. For example,
in Figure 1, there is a reference to Alice Deal Middle School, as well as references to school boundaries, the
lottery, middle school, and aftercare.
We also linked the schools to publicly available data sources. Our analyses rely on demographic data, includ-
ing student race, at-risk student population, and students receiving free and reduced-price lunch (FRPL),
originally collected by the Office of the State Superintendent of Education (OSSE) and the National Center for
Education Statistics (NCES). These data were compiled and made available to us by education researcher
Dr. Betsy Wolf.31 To these data, we add 2018–19 PARCC and STAR Framework data, which also come from
OSSE, and 2018–19 school waitlist data from DCPS and DCPCS.329
Which Public Schools are
Discussed on DC Urban
Moms? Which Schools
are Ignored?
In principle, a District parent could research scores of schools, each with countless attributes to consider,
and compare all of these options when choosing a school for their child. In practice, however, most parents
would find such a strategy impractical, and instead seriously consider a far shorter list of schools. The median
number of schools listed by families participating in the school lottery is four.33
The first question, then, is simply what schools are given any consideration whatsoever. Among DC Urban
Moms participants, we find that some schools receive very high levels of attention, some schools are rarely
mentioned at all, and that certain groups of schools tend to be discussed together.
School Clusters
We begin by examining the clusters of schools that appear in DC Urban Moms conversations. If a DC Urban
Moms participant mentions a particular school, what other schools are also likely to be a part of the discus-
sion? Understanding networks of District schools as they present themselves within the forum reveals the
mental map of public education held by this community.
For every pair of schools in our dataset, we calculated how often they are mentioned in the same DC Urban
Moms conversation, measured as a percentage of all the conversations that mention either of the two
schools.34 We then used a clustering algorithm to identify groups of schools that are commonly discussed
together.35 For this first analysis, we were obliged to focus on the 76 schools appearing in at least 2 percent of
all conversations in the forum; we will refer to these schools as “commonly discussed.” Other schools appear
too sporadically to form a cluster of conversations. We return to the important subject of rarely discussed
schools in the following section.
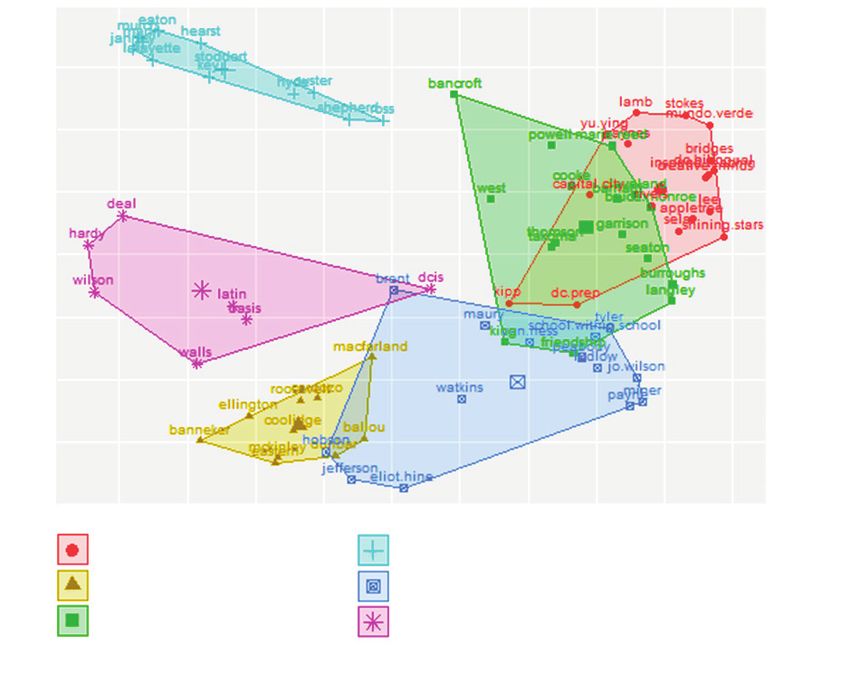
Figure 2 summarizes the results of the clustering. Though the analysis was based exclusively on the fre-
quency with which schools were referenced together on the DC Urban Moms forum, the results reveal clear
patterns in terms of sector, location, and grade level. For instance, four of the clusters primarily or exclusively
contain elementary schools (ES), while the other two clusters contain almost all of the commonly discussed
middle (MS) and high schools (HS).3610 D I S C U S S I O N S O F D. C . P U B L I C S C H O O L O P T I O N S I N A N O N L I N E F O R U M
Figure 2: School Clusters in DC Urban Moms Forum Conversations
145 Charter Cluster High-Attention ES Cluster
Low-Attention MS/HS Cluster Ward 6 Cluster
145 Traditional Cluster High-Attention MS/HS Cluster
In the top left of the figure is the “High-Attention ES Cluster,” which includes twelve traditional public elemen-
tary schools in the wealthy neighborhoods of Wards 2 and 3, plus two other elementary schools also zoned
for Alice Deal Middle School and Woodrow Wilson High School. This cluster is very frequently discussed on
DC Urban Moms, appears isolated from the other clusters, meaning that its schools tend to be discussed
separately from other schooling options in the District.37 In the bottom right of the figure is the “Ward 6 Cluster,”
which includes fourteen traditional public elementary and middle schools located in Ward 6, a diverse set of
neighborhoods around the U.S. Capitol.
The other four clusters are logically understood as sets of two. First, there are the two “145” clusters that
include schools in Wards 1, 4, and 5. Second, there are the two middle school/high school clusters.D I S C U S S I O N S O F D. C . P U B L I C S C H O O L O P T I O N S I N A N O N L I N E F O R U M 11 The “145” Clusters overlap in the top right of Figure 2, and what is true visually is also true geographically. The 145 Charter Cluster includes seventeen charter schools in Wards 1, 4, and 5, neighborhoods that have in recent years experienced substantial gentrification. The 145 Traditional Cluster includes sixteen traditional public schools in these same neighborhoods.38 The overlap of the clusters shows the extent to which the charter and traditional public schools in these areas are discussed together; these two clusters are far less distinct than the others. Nonetheless, the charter school cluster experiences a substantially higher level of discussion than the traditional school cluster. Finally, on the bottom left of Figure 2 are the two middle school/high school clusters. The “High-Attention MS/HS Cluster” and the “Low-Attention MS/HS Cluster” include most of the middle and high schools in the District. In the High-Attention MS/HS Cluster are four traditional public schools and three public charter schools, all located in the Northwest quadrant of the city. Of all the clusters, this cluster shows the highest level of discussion activity on DC Urban Moms. The Low-Attention MS/HS Cluster includes ten other public middle and high schools in the District, but has the lowest level of discussion activity among all clusters. Unlike the other clusters, the High-Attention and Low-Attention MS/HS Clusters are not distinct by sector or by geography; instead, these clusters appear to be distinguished by the demography of the students. For instance, the Low-Attention MS/HS Cluster includes Duke Ellington School of the Arts, a selective arts school located in wealthy Ward 2, like many of the High-Attention MS/HS schools. Nor does attention coincide with standard measures of school quality. The Low-Attention MS/HS Cluster includes Benjamin Banneker, a selective and academically rigorous magnet school, as well as schools that have low graduation rates and relatively few students testing at grade level. What the clustering algorithm appears to have detected is the racial segregation among DC’s middle and high schools. The High-Attention MS/HS Cluster contains only schools that have a greater than 15 percent white population, with an average of 30 percent of students being white. The Low-Attention MS/HS cluster contains only schools with a less than 15 percent white population, and an average of less than two percent of students being white. In addition to being discussed separately, the schools in the six clusters are also discussed differently. By looking at what terms are especially common when schools in each cluster are discussed, we can trace the contours of those conversations. Figure 3 examines terms associated with the High Attention ES cluster, as compared to other commonly discussed elementary schools. Discussions of schools in the High-Attention ES cluster are more likely to use words like “affluent” and to refer to “fundraising” for the school. More than conversations about other elementary schools, High-Attention ES Cluster conversations tend to involve superlatives, like “excellent” and to refer to individuals associated with the school such as “families,” “moms,” and “kids.” These discussions also refer to many specific school facilities and subjects and discuss class size and private school options.
12       D I S C U S S I O N S O F D. C . P U B L I C S C H O O L O P T I O N S I N A N O N L I N E F O R U M

     Figure 3: Selected Terms Associated with High-Attention Elementary Schools
     Compared to Other Commonly-Discussed Elementary Schools

               Private
        Overcrowded
           Renovate
            Principal
                  PTA
              Student
          Class Size
               Parent
              Diverse
              Wealthy
               Family
                   Art
             Involved
                  Rich
                 Field
            Excellent
             Reading
                   Kid
                 Mom
               Soccer
                Music
                 Child
                Active
          Wonderful
             Affluent
               Writing
                 Pool
              Science
               History
         Fundraising
        Independent
                 Gym
        Professional
               Terrific
                  Dad
            Fabulous
           Privileged
              Theater
          Basketball
        Phenomenal

                          0                              5                              10                       15   20
                                                                      Percentage Point Difference in Frequency

     Other than the references to affluence and perhaps the high number of positive descriptors, the words
     associated with the High-Attention ES cluster might not seem particularly extraordinary. Recall, however, that
     these are not simply common, substantive words used when these schools are discussed; they are the words
     used especially often compared to conversations about schools in the other elementary school clusters. That
     is to say, conversations about other elementary schools are less likely to mention subjects like art, reading,
     music, or science; less likely to mention extracurriculars like soccer or basketball; and less likely to talk about
     the people at the school using terms like family, children, or moms.

     The comparable data for the Ward 6 cluster, for example, look very different. Discussions of this cluster are
     especially likely to include terms that signify race and class, including “high SES [socioeconomic status],” “low
     SES,” “middle class,” “Black,” “white,” and “gentrifying,” among others. Despite these many terms that describe
     demographic groups of people, there is an absence of words like “moms” or “kids” or “children” that appear on
     the High-Attention ES list. There are also few terms associated with school subjects, extracurriculars, or facilities.
D I S C U S S I O N S O F D. C . P U B L I C S C H O O L O P T I O N S I N A N O N L I N E F O R U M 13
What about the 145 Clusters, and the two MS/HS clusters? Since these four clusters form logical groups of
two, it is informative to compare each of these clusters directly to its counterpart.
Figure 4 compares the two clusters in Wards 1, 4, and 5. Both the charter and the traditional cluster have a
number of bilingual and language immersion schools, and so it is no surprise that conversations about these
clusters have especially frequent references to language, though conversations about the charter sector more
often use the word “immersion,” while the conversations about the traditional schools use “dual-language.”
The 145 Traditional Cluster is more associated with references to ethnicity (e.g., “Hispanic” and “Latino”), while
the Charter Cluster has terms for individuals, such as “child” and “parent.” Discussion of the 145 Traditional
Cluster also features higher levels of attention to “safety.” The 145 Charter Cluster is associated with more
words like “ideal” and “highly regarded,” whereas the traditional public schools are associated with words
like “improving” and “up-and-coming.”
Figure 4: Selected Terms Associated with the 145 Charter Cluster or the
145 Traditional Cluster
Mandarin
Child
Private
Best
Immersion
Parent
Academic
College
Math
Science
Ideal
Successful
Rigorous
Independent
Discussed
High Quality
Selective
Highly Regarded
Responsible
Dad
Upper Middle Class
ESL
Lovely
Overcrowded
Latino
PTO
Up and Coming
Safety
Hispanic
ELL
Improving
PTA
Renovate
Gentrify
Principal
Dual Language
-20 -15 -10 -5 0 5 10
Percentage Point Difference in Frequency (Charter Minus Traditional)
More Associated with Traditional More Associated with Charter14 D I S C U S S I O N S O F D. C . P U B L I C S C H O O L O P T I O N S I N A N O N L I N E F O R U M
The final two clusters are those that include the District’s high schools. When the High-Attention MS/HS
Cluster is discussed on DC Urban Moms, participants use different words than when they discuss schools
in the Low-Attention MS/HS Cluster (Figure 5).
Figure 5: Selected Terms Associated with the High- or Low-Attention Middle
and High School Clusters
Child
Kid
Private
Family
Happy
Parent
Great
Fine
Diverse
Good
Advanced
Better
Concerned
Teacher
Math
Homework
Decent
Writing
Nice
Wonderful
Crowded
Playground
Play
Science
PTA
Debate
Discipline
Aftercare
Brown
Failing
African American
Football
Black
Mayor
Renovate
-10 -5 0 5 10 15 20
Percentage Point Difference in Frequency (High-Attention Minus Low-Attention)
More Associated with Low-Attention MS/HS More Associated with High-Attention MS/HS
High-Attention MS/HS Cluster schools are associated with terms referring to academics, as well as many
general positive descriptors. As with the High-Attention ES cluster, these discussions are also especially likely
to refer to the people at the school: “children” and “families.” The word “diverse” is also especially associated
with the High-Attention MS/HS Cluster. Far fewer common terms are more associated with discussions of
Low-Attention MS/HS Cluster schools. These words include “Black,” “African-American,” “football,” “failing,”
and “renovate.”D I S C U S S I O N S O F D. C . P U B L I C S C H O O L O P T I O N S I N A N O N L I N E F O R U M 15
Individual Schools
Turning to the individual schools, we again find large differences of attention and strong correlations between
how schools are discussed and the demographics of the student population.
Most striking is the near-invisibility of a very substantial percentage of the District’s public school system.
Nearly half of the public schools in the District are almost never mentioned on DC Urban Moms. 75 schools
appear in an average of less than one percent of forum conversations annually. These rarely mentioned
schools are also given very little individual attention. In fact, the most rarely mentioned schools often appear
on DC Urban Moms when a participant has copied and pasted into the forum a document from an official
source (such as a press release or data table) that contains the names of many District schools.39
Figure 6 shows the negative correlation between how often a school is discussed, and how many other
schools are mentioned in the same conversation. Many of the most frequently discussed schools are those
that appear in the High-Attention ES and High-Attention MS/HS clusters, such as Alice Deal, Woodrow Wilson,
Janney, Washington Latin or BASIS DC. These schools also tend to appear in conversations with few refer-
ences to other schools.
Figure 6: Number of Conversations Mentioning a School vs. Average Number of
Other Schools Mentioned
70
60
Average Number of Other Schools Mentioned
50
40
30
20
BASIS Janney
Wilson Deal
10 Latin
0
0 500 1000 1500 2000 2500 3000 3500
Total Conversations Referring to School16 D I S C U S S I O N S O F D. C . P U B L I C S C H O O L O P T I O N S I N A N O N L I N E F O R U M
Figure 6 summarizes the stark differences in attention schools receive on the DC Urban Moms forum. In
the previous section, we discussed the clusters of “commonly-mentioned” schools, those appearing in two
percent or more of the 15,213 conversations in our dataset. But, as Figure 6 attests, some schools are men-
tioned in much more than two percent of DC Urban Mom conversations, and many schools are mentioned in
far fewer conversations. We define a school as “frequently mentioned” if it is mentioned in, on average, more
than five percent of conversations a year. We define a school as “rarely mentioned” if it appears, on average,
in less than one percent of conversations a year.40
Rarely-mentioned schools have student bodies that are almost entirely Black, while frequently-mentioned
schools have large white populations. Rarely-mentioned schools also have higher rates of poverty, lower
test scores, and higher percentages of students in special education. The frequency of mentions on the DC
Urban Moms website also correlates with a real-world indicator of school popularity—the length of a school’s
waitlist.41 Table 3 summarizes these findings.
Table 3: Differences Between Rarely-Mentioned and Frequently-
Mentioned Schools42
Category Rarely-Mentioned Schools Frequently-Mentioned Schools
Mentioned in 5% of
Conversations (n=76) Conversations (n=33)
White 0.4% 40%
Black 92% 32%
Hispanic 7% 18%
At-Risk 68% 14%
Meeting or Exceeding English Language Standards 18% 66%
Meeting or Exceeding Math Standards 13% 60%
Special Education 16% 9%
Charter 35 12
Traditional 41 21
Elementary 44 23
Middle 8 5
High 9 3
Waitlist Length 90 732D I S C U S S I O N S O F D. C . P U B L I C S C H O O L O P T I O N S I N A N O N L I N E F O R U M 17 Other aspects of the schools show fewer differences. The frequently- and rarely- mentioned schools are similarly divided among elementary, middle and high schools. The rarely-mentioned schools are nearly evenly split between charter and traditional schools; frequently-mentioned schools include a higher fraction of traditional public schools, but about one-third of these schools are charters. Looking over time, we find that there is substantial stability in which schools receive frequent attention on DC Urban Moms. The major change over the period is the founding of charter schools that receive high levels of attention. For instance, charter schools such as BASIS DC (founded 2012) and Lee Montessori (founded 2014) have each been mentioned in at least five percent of DC Urban Mom conversations every year since their respective openings. What is not common, however, is for a school to go from low levels of attention to high levels of attention. In fact, excluding schools that opened or reopened during the period, only six schools that appeared in an average of less than two percent of conversations annually before 2015 were discussed in an average of more than three percent of conversations annually after 2016. In thinking about why some schools are given consideration by participants on DC Urban Moms, it is difficult to disentangle geographic segregation from school segregation. No schools located only in Wards 7 and 8, the heavily Black wards east of the Anacostia River, are among the schools frequently discussed on DC Urban Moms.43 None of the rarely-mentioned schools are in Wards 2 or 3, the wealthiest and whitest wards in the District.44 School segregation, in general and as it is evidenced by the conversations on the DC Urban Moms forums, reflects the history of racist housing and education policy in the United States.45 However, as the clustering of high schools suggests, and as we will see in the following section, geographic segregation alone does not entirely explain how and which schools are discussed by DC Urban Moms par- ticipants. Nonetheless, neighborhoods of residence play a critical role in a primary activity of the “DC Public and Public Charter Schools” forum: strategizing how to get access to a set of schools deemed desirable.
18

                Location, Location, Lottery:
                DC Urban Moms and
                Strategies to “Win” School
                Assignment

          D    C Urban Moms participants generally approach the school system from a consumer perspective:46 They
               ask for guidance from others about which schools are preferable and seek out advice about how to
          increase one’s chances of accessing those schools. In other words, a great deal of the conversation on DC
          Urban Moms is about where to live and what schools to seek through the lottery. The centrality of school
          choice to the forum is evident in the monthly ebb and flow of activity on the site; nearly 50 percent of all new
          conversations are posted in the first four months of the calendar year, when parents are choosing schools
          for the fall.

          On the forum, the process of decisionmaking is often fraught. School choice is not generally described by DC
          Urban Moms participants as a system of matching, in which people with different preferences each find a
          school that meets their specifications. Rather, school assignment is often treated as a high-stakes, zero-sum
          game, with clear winners and losers. The disparities in the District’s education system are indeed stark, due
          to the high levels of economic inequality and segregation, as well as inequities in funding.47 Nonetheless, the
          language on the site can be extreme. “Let the Hunger Games BEGINNNNNN!” writes one commenter in a 2015
          thread, comparing the school lottery to a fictional dystopia in which children are forced to fight to the death.48

                                                           Many school assignments are deemed unacceptable
                                                           outcomes to DC Urban Moms participants; it is common
Many school assignments are deemed                         to consider opting out of the District’s school system
unacceptable outcomes to DC Urban                          entirely, either by going to a private school or moving
Moms participants; it is common to                         out-of-district. Nearly a third of conversations on the “DC
                                                           Public and Public Charter Schools” forum make refer-
consider opting out of the District’s
                                                           ence to private educational options. For example, one
school system entirely.                                    parent writes, ”we think we like our in-bound elementary
                                                           school option, we just want to make sure those middle
                                                           school years are preparing our children for a good private
        high school.” Another recommends pulling a child from public education if rejected from their top choice
                     49

        elementary school: “I would apply [to] Janney and pay for private if I didn’t get in.”50
D I S C U S S I O N S O F D. C . P U B L I C S C H O O L O P T I O N S I N A N O N L I N E F O R U M 19
Given the perceived stakes, a major component of the activity on DC Urban Moms is strategizing in order
to gain access to the preferred public schools. The available tactics fall into two categories: establishing
residence or playing the school lottery. Table 4 summarizes the frequency of selected housing and lottery
terms, measured as the number and percentage of conversations including the term.
Table 4: Selected Housing and Lottery Terms
Terms Term Frequency
Total Percentage
“lottery” 5285 34.7%
“waitlist” 3550 23.3%
“preference” 1996 13.1%
“housing” 880 5.8%
“rent” 654 4.3%
Home type (e.g., “condo” or “townhouse”) 622 4.1%
“real estate" 588 3.9%
Housing Market (e.g., “buy a home” or “home value”) 454 3.0%
Home-Buying Websites (e.g., “redfin” or “zillow”) 81 0.5%
Though there is a separate forum for the discussion of renting and buying homes, over 13 percent of conver-
sations on the “DC Public and Public Charter Schools” forum relate to housing and real estate. For instance,
a participant may post their home purchase or rental budget and request recommendations about where
to move. “Our budget is 500k to buy a 2-bedroom condo,” wrote one participant, before soliciting feedback
on the schools in areas where they had toured homes.51 Another thread titled “Where to begin in evaluating
school options in DC” begins:
We are parents of an infant and are looking to buy a home in DC in the next year or so. We
think we can afford in the $450-575k range for a 3BR/2BA... What are the basics of picking
schools? Do you have any tips of good places to look in our price range?52
Over 50 messages responded to the post, providing feedback on where to buy. But new residents are not the
only ones seeking feedback on their housing plans. Some DC Urban Moms commenters discuss purchasing
a new or even a second home exclusively to gain access to particular traditional public schools, typically
those in Washington’s wealthiest and whitest neighborhoods.5320 D I S C U S S I O N S O F D. C . P U B L I C S C H O O L O P T I O N S I N A N O N L I N E F O R U M
A much higher percentage of conversations, over 53 percent, include words related to the school lottery,
including the word “lottery” but also related terms like “waitlist.” Some conversations are seeking general
advice about which schools to consider adding to one’s lottery list, while others are looking for guidance on
particular situations, such as having more than one child potentially applying to the same schools.54 One
thread suggests the commenter is a “repeat customer” of crowdsourced advice from DC Urban Moms:
So I have to lottery for PK this year. Can you suggest to me, what schools, and in what order,
I should lottery for? I don’t know what is closest to me, which ones have good PK programs,
etc. Would gladly take recommendations from everyone who has gone through this before!
For the record, moved here two years ago and older two are in Deal—at the recommendation
of this forum. I would take your advice with my eyes closed! Thank you!55
Sometimes the conversations suggest a very deep attention to lottery outcomes. For example, there are
threads in which commenters post their intended lottery lists for others to attempt to predict not only what
placement they will receive, but their waitlist numbers at the schools they do not get into.56
The tactical conversations about housing and the lottery are not occurring in isolation; instead, they shape
one another. Over 10 percent of conversations include a keyword related to both housing and the lottery—put
differently, 79 percent of housing conversations include mention of the lottery. If a family cannot afford to
be in-bound for the “right” schools, they are recommended to enter the lottery—and because they can play
the lottery, DC Urban Moms participants are willing to consider living in neighborhoods where they intend to
avoid the local schools.
The Importance of Being “In-Bound”
Of all the substantive terms we counted on any topic, the single most common was “in-bound,” which appeared
in nearly two-thirds of all conversations in the forum. To be “in-bound” (or “in-boundary”) for a school is to
live in its catchment area, so that your children are guaranteed the right to attend; this right applies only to
traditional public schools. References to “in-bound” outpaced many very common words, including references
to “DCPS,” the acronym for the traditional public school system, as well as “charter” and “parent.” Other
references to boundaries, such as being “out-of-bounds,” also feature in more than a fifth of all conversations.
The importance of being in-bound is often linked by DC Urban Mom participants to the school’s feeder
pattern. Students graduating from each traditional public elementary school are guaranteed a spot in specific
middle and high schools; if one attends, for instance, Raymond Elementary School, one can attend McFarland
Middle School and Theodore Roosevelt High School. Almost a fourth of all conversations on the forum refer
to feeder patterns.D I S C U S S I O N S O F D. C . P U B L I C S C H O O L O P T I O N S I N A N O N L I N E F O R U M 21
Table 5: Frequency of Terms for Boundaries and Feeder Patterns
Terms Term Frequency
Total Percentage
“in-bound” 9690 63.7%
“feed” 3596 23.6%
“out-of-bounds” 3338 21.9%
“zoned” 792 5.2%
Because different neighborhoods and elementary schools set a track for a child’s public education access, DC
Urban Mom commenters are sometimes planning as much as a decade ahead of their child’s actual school
attendance. For instance, when a parent of a four-year-old sought advice on home buying given their preschool
options, the first response was, “If you are thinking of moving, I’d move somewhere with a stronger school and
a path for middl[e]/high school.” Other comments followed in the same vein: “Homes that are comfortably
big enough for a family of 4 near Garrison start at $1.3. You can get something in-bounds for Deal for much
less than that (but still not cheap) near chevy chase circle or in other parts of upper, upper northwest.”57
As this last comment would imply, much of the discussion around boundaries and feeder patterns is specifi-
cally about getting into Alice Deal Middle School and Woodrow Wilson High School, the two most commonly
discussed schools on DC Urban Moms. While 16 percent of all conversations mention Wilson, 37 percent of
conversations discussing feeder patterns refer to Wilson. Similarly, 23 percent of all conversations refer to
Deal, but more than half of all conversations mentioning feeder patterns refer to Deal.
The forum’s focus on the Wilson feeder pattern mirrors actual enrollment patterns in the District. According
to one recent study of District parents’ decisions to attend their in-bound traditional elementary school:
Location within the feeder pattern for Wilson High School, D.C.’s top-performing in-boundary
high school, outweighs all other neighborhood aspects in explaining the tendency to enroll
at in-boundary schools.58
Other feeder patterns are commonly raised as an issue with elementary schools, even if the school itself is
seen as good. “I have a soon to be kindergartner and we’re in bounds for Brent. I like Brent for Elementary
school but don’t like the middle school options. What schools do kids go to after Brent if they don’t stay in
DCPS?” asks one DC Urban Moms commenter. “Half a dozen of my kids’ 3rd grade classmates, children
from his ECE [early childhood education] cohort at Brent, will invariably land in Deal feeders for 4th or 5th, no
matter what’s happening,” responds another.5922 D I S C U S S I O N S O F D. C . P U B L I C S C H O O L O P T I O N S I N A N O N L I N E F O R U M
There is substantial discussion of the enforcement and maintenance of existing school boundaries. A
common trope is to report seeing kids arrive at a school from a car with Maryland license plates, implying
that the parents are not District residents and therefore ineligible to send their children to District schools.
“I’m pretty cranky when I see MD plates doing drop off at the HRCS we got shut out of,”60 one commenter
grouses, using an acronym for “highly regarded charter schools.”61
The forum also features strong reactions to potential changes to boundaries and feeder patterns. These conver-
sations tend to discuss both residents’ access to schools and the potential implications for housing values. In a
message from 2012, the poster expresses schadenfreude at the possibility that residents of Duddington Place,
on Capitol Hill, might have their street rezoned from Woodrow Wilson High School to Eastern Senior High School:
If someone on Duddington complains that switching to Eastern is going to hurt their property
value, quelle dommage, baby! There is a 2 bedroom, 1 bath for sale right now on Duddington
for $650k. No parking, 70s kitchen.62
Using a French idiom meaning “what a pity,” the commenter suggests that because housing prices on the
street are very high, he or she feels no sympathy for complaints about rezoning.
A few years later, a more systematic rezoning plan provoked much more backlash on the message board. When
citywide boundaries and feeder patterns were under official reconsideration in 2014–2015, the Crestwood
neighborhood was slated to be moved out of the Deal Middle School feeder pattern.63 The issue was a hot
topic: “We bought in Crestwood with the expectation that deal would be available to us,” one commenter
complained.64 In total, there were twelve times as many conversations that referred to Crestwood in 2014,
compared to previous years.
No matter their attitude to particular mechanisms of
advantage, forum participants recognize real estate as
No matter their attitude to particular
a tool for achieving their preferred school assignments.
mechanisms of advantage, forum But they also use a second and related mechanism, the
participants recognize real estate as school lottery. Lottery strategies provoke immense fervor
a tool for achieving their preferred on the forum.
school assignments.
Lottery
My School DC, a district-wide public school lottery instituted in Washington, D.C., in 2014, replaced a system
of individual school lotteries that was widely agreed to be extraordinarily difficult for parents to navigate.
Parents now apply with their ordered list of up to 12 preferred schools prior to the citywide deadlines in
February (for high school) and March (for earlier grades). In recent years, the system has processed about
25,000 applications a year.65D I S C U S S I O N S O F D. C . P U B L I C S C H O O L O P T I O N S I N A N O N L I N E F O R U M 23
The effect of the new lottery system is visible in a sharp change in activity patterns on the forum. Though the
busiest time of year on the forum has always been spring, when parents are choosing schools for the fall, the
percentage of new posts that occur in January and February jumped 36 percent in the years after the lottery
was instituted. Overall, about one-third of all conversations on the forum refer to the school lottery, and more
than a fifth refer to waitlists (Table 5). The frequency of references to the lottery increases somewhat after
2014, rising from 30 percent in previous years to 37 percent thereafter.
While the lottery is, to some degree, an alternative to residential access to schools, it also influences the
housing strategies discussed on the forum. There is a strong geographic pattern to the frequency with which
the school lottery is mentioned; DC Urban Moms participants are more likely to refer to the lottery if they are
also talking about gentrifying neighborhoods. Figure 7 plots this relationship.66
Figure 7: Neighborhood Conversations and the Lottery
80 Bloomingdale
Percent of Post-2014 Conversations Mentioning the Lottery
75 Crestwood Adams Morgan
Petworth
Brightwood
Langdon
70
Edgewood
Shaw
Brookland
65 Columbia Heights
Capitol Hill Shepherd Park
Cleveland Park
60
Takoma
Tenleytown
55
Chevy Chase
50
Georgetown
45
-10 -5 0 5 10 15 20
Percent Change in White Population, 2010–2015
A closer look at the Brookland neighborhood shows how interest in the lottery plays out in practice. In Ward 5,
where Brookland is located, the percent of children under five who are white rose from nine percent to
21 percent in the last ten years, substantially altering the demography of incoming students in the neighbor-
hood.67 As research in other school districts would predict,68 white students in this gentrifying neighborhood
have mostly self-segregated into a handful of charter schools; the remaining schools serve almost exclusively
Black student populations.24 D I S C U S S I O N S O F D. C . P U B L I C S C H O O L O P T I O N S I N A N O N L I N E F O R U M
The conversations about Brookland schools on DC Urban Moms illustrate one mechanism by which this
self-segregation occurs. Nearly three thousand forum conversations, almost one-fifth of the total, mention
at least one Brookland elementary school, and total attention to these schools has grown over time. But
DC Urban Moms participants focus heavily on a few schools in the neighborhood. On average, elementary
schools in Brookland that are less than 50 percent Black are mentioned more than four times as often per
year as schools that are more than 50 percent Black. Figure 8 plots this correlation.
Figure 8: School Racial Demography and Attention on DC Urban Moms
10
Lamb
Percent of Conversations Mentioning School
8 Stokes
Lee
Ward Average
6
4
Shining Stars
Burroughs
2 DC Prep
Bethune
Noyes
Perry Street
Hope Community
0
0 20 40 60 80 100
Charter DCPS Percent of Students Who Are Black
Because we are looking within a single neighborhood, the differential in attention we see here is not a simple
result of the geographic segregation of Washington, D.C. Instead, we can see that even when schools are
geographically proximate, it is schools with a larger percentage of white students that receive attention on
the DC Urban Moms forum.
Given the changing demography of the neighborhood and opening of new schools over the period, it is
worthwhile to examine how attention to Brookland schools has varied. Figure 9 traces attention to Brookland
schools over time.D I S C U S S I O N S O F D. C . P U B L I C S C H O O L O P T I O N S I N A N O N L I N E F O R U M 25
Figure 9: Attention to Brookland Schools Over Time
15
Lamb
Percent of Conversations Mentioning School
Stokes
10
Lee
Shining Stars
5 Bethune
Burroughs
Bunker Hill
Noyes
DC Prep
Perry Street
0
2008 2009 2010 2011 2012 2013 2014 2015 2016 2017 2018 2019 2020
Two high-attention schools opened in Brookland during the time period: Lee Montessori and the Brookland
campus of Latin American Montessori Bilingual. These schools join Elsie Whitlow Stokes among the schools
much-discussed on the forum. Other options have seen either slow growth in attention or have not seen a
substantial increase in attention over time. In other words, parents looking to DC Urban Moms for information
about schools in Brookland have consistently heard far more about some schools than others, and the schools
they hear about are the schools with substantial white populations.
A deeper examination of the data, moreover, suggests
that the lesser-mentioned schools are spoken of differ-
ently than the highest-attention schools. As noted in the
Parents looking to DC Urban Moms
cluster analysis previously (Figures 2 and 4), the common- for information about schools in
ly-mentioned charter schools in Wards 1, 4, and 5 tend to Brookland have consistently heard far
be associated with superlative terms, while the cluster
more about some schools than others,
of commonly-mentioned traditional public schools in this
area is associated with more moderate praise. and the schools they hear about are
the schools with substantial white
populations.26 D I S C U S S I O N S O F D. C . P U B L I C S C H O O L O P T I O N S I N A N O N L I N E F O R U M
A typical example is the 2020 thread entitled “Northeast and Capitol Hill Schools,” in which a DC Urban Moms
commenter was concerned about the school options near a two-to-three bedroom home with “rent between
$2500–3000.” A respondent counselled that she should consider moving to Brookland and play the school
lottery until a preferable local school is attained:
In Brookland there are enough schools that you’ll get something eventually, and you’ll be
fine at Langley or Bunker Hill or Burroughs until you do.69
Bunker Hill and [John] Burroughs are two of the traditional public elementary schools in the neighborhood that
feed into Brookland Middle School, which residents have the right to attend if they live within their catchment
area; Langley Elementary is a traditional public school in neighboring Eckington. Here they are presented as
a stopgap measure until repeated lottery efforts secure access to a more desirable option.
There are undoubtedly many differences between the elementary schools of Brookland and many reasons for
choosing one or another. But there is certainly not a one-to-one correlation between quantitative measures of
student achievement and school attention on DC Urban Moms. Burroughs, for example, has Math and English
proficiency scores similar to Lee Montessori, but Lee is mentioned three times as often.70 In the following
section, we examine more closely the role of test scores in DC Urban Moms conversations.27
How Do DC Urban Moms
Participants Talk about
Test Scores?
F orum participants use the forum to evaluate, compare, and often explicitly rank the education options
available to them. For example, in at least two percent of all conversation threads, the subject line of a
“DC Public and Public Charter Schools” post is an explicit comparison: “Murch vs. Janney”71, “Moving to
Woodley—Oyster v. Eaton”72, or “Two Rivers or Inspired Teaching for Middle School?”73 But these conversations
are not typical of the conversation on the site as a whole; they are heavily weighted to the schools that are
frequently discussed on the forum, and those schools are discussed differently from other schools.
How, then, do forum participants respond to the criteria that are available for nearly all schools? Almost
every public school in the District does share at least one potential metric for comparison: test scores and
ratings. In Washington D.C., students take the Partnership for Assessment of Readiness for College and
Careers (PARCC) every year starting in 3rd grade. The results of this standardized test also make up a central
component of the STAR Framework rating system that the District began applying to public schools in 2018.74
This is not to suggest that test scores are necessarily a good metric for school comparison.75 Children are
tested in only a few subjects, and high stakes testing can encourage “teaching to the test” rather than well-
rounded education.76 Measures of student proficiency (as opposed to growth77) are also strongly correlated
with the socioeconomic status of the students, and so provide little information about the impact of the
school on student learning. A striking finding of one recent study was that college entrance exam scores were
measurably worse for low income students if the test were taken in the last two weeks of a SNAP benefit
cycle, when poor families’ food supplies tend to run low.78 Under such circumstances, low test scores do
indicate failure—not of teachers or of students, but rather a societal failure to ensure the basic health and
wellbeing of children.
Nonetheless, test scores seem at first glance to be an important consideration in DC Urban Moms conversa-
tions. Test scores are a common topic; 22 percent of all threads in our dataset mention test scores, PARCC,
or standardized tests. That number increases substantially in threads that are discussing specific schools.
Among the 76 most commonly discussed schools, at least 30 percent of threads referring to each school also
mentioned test scores.79 Moreover, as Table 3 would suggest, schools with better test scores receive more
attention on DC Urban Moms, and a school’s low scores are commonly cited as a reason to avoid attending.28 D I S C U S S I O N S O F D. C . P U B L I C S C H O O L O P T I O N S I N A N O N L I N E F O R U M
But test scores may serve more as a shorthand or euphemism, rather than an empirical measure of school
quality. For instance, comments referring to test scores are not typically described as evidence of teaching
ability at the school, but rather as an indicator that the students at that school would make undesirable peers.
Commenters are sometimes quite explicit about “getting
away from low scoring students.”80
Comments referring to test scores are
So, do test scores “matter” on DC Urban Moms? The best
not typically described as evidence evidence for the impact of test scores on school reputa-
of teaching ability at the school, tion would be if new data releases changed attention to
but rather as an indicator that the schools. Because a new system of school ratings was
released during the time period of our dataset, we can
students at that school would make explore this possibility.
undesirable peers.
Seeing Stars
In 2018, the District of Columbia released a new “report card” for its traditional and charter public schools.
The “School Transparency and Reporting (STAR) Framework” weighted various school metrics, but primarily
standardized test scores, to produce an overall rating for each school, ranging from one to five stars. The
Framework also reported performance data for subgroups within a school, including at-risk students and
students with disabilities. While the algorithm used to produce the ratings was hotly contested,81 the STAR
Framework provided District parents with what appeared on the surface to be a simple, quantitative ranking
of school quality. How was this new information incorporated into conversations on DC Urban Moms?
Prior to its release, conversations about the STAR Framework included concerns about the heavy reliance
on standardized tests, speculation about how particular schools would perform, and appreciation for “an
easy apples to apples comparison tool.”82 The release of the report engendered threads with hundreds of
messages responding to the data.83 In the following weeks and months, DC Urban Moms commenters referred
to schools according to their star ratings. Figure 10 shows the increase in phrases like “two-star” or “five-star”
after the initial release of the rating system (denoted by a red dotted line).You can also read