"WE ARE. . .CONVAL!" - CONTOOCOOK VALLEY SCHOOL DISTRICT
←
→
Page content transcription
If your browser does not render page correctly, please read the page content below
CONTOOCOOK VALLEY SCHOOL DISTRICT

“We Are. . .ConVal!”

                                       January 2020
Table of Contents
Introduction…………………………………………………………………………………………….. 3
Letter from the Superintendent………………………………………………………………………… 5
Vision, Mission, and Core Beliefs ……………………………………………………………………...6
Strategic Plan…………………………………………………………………………………………... 7
Technology in the ConVal School District …………...……………………………………………….. 9
District Highlights........………………………………………………………………………………...11
Enrollment History....…………………………………………………………………………………..15
Future Enrollment Projection ………………………………………………………………………… 16
School Attendance ……………………………………………………………………………………..17
Drop-Out Rate …………………………………………………………………………………………18
Graduation Requirements ......………………………………………………………………………….19
Post-Graduate Education .……………………………………………………………………………...20
Student Services………………………………………………………………………………………..21
Special Education .……………………………………………………………………………………..23
District and State Assessments .……………………………………………………………………….24
Scholastic Aptitude Test (SAT) .……………………………………………………………………… 25
Advanced Placement Courses ………………………………………………………………………… 27
New Hampshire Statewide Assessment ……….……………………………………………………… 28
AIMSweb .......………………………………………………………………………………….............30
NWEA .…………………………………………………………………………………………………33
Educational Level of Professional Staff ………………………………………………………………..36
Experience Level of Professional Staff ………………………………………………………………...37
SAU #1 2018-2019 Organizational Chart ……………………………………………………………...38
Facilities .……………………………………………………………………………………………….39
Per Pupil Costs …………………………………………………………………………………………42
School Profiles …………………………………………………………………………………………43

Page 2 of 67
Introduction
                                              We Are…ConVal!
The Contoocook Valley School District (ConVal) is a cooperative school district located in the Monadnock Region
of Southwest New Hampshire.

The Monadnock Region has long been connected to Mount Monadnock, and at 3,165 feet, Mount Monadnock is
the dominant geographic feature of the area. Known as New Hampshire’s “quiet corner”, the area boasts lakes and
rivers, town commons, art galleries, music festivals, and the MacDowell Arts Colony, the oldest artists’ colony in
the United States.

The nine towns that make up the District are: Antrim, Bennington, Dublin, Francestown, Greenfield, Hancock,
Peterborough, Sharon, and Temple.

 The ConVal School District is a large, complex public school organization. Nine towns, Antrim, Bennington,
Dublin, Francestown, Greenfield, Hancock, Peterborough, Temple, and Sharon, joined together in 1967 and
established a set of “Articles of Agreement.” Currently, the cooperative District covers over 250 sq. miles and
incorporates 11 schools; 8 elementary schools (3 Pre-K to 4, 4 K-4, 1 K-5), 2 middle schools grades 5-8, and 1
regional high school grades 9-12.

All of our member towns host an elementary school, with the exception of Sharon. Sharon’s elementary students
attend Peterborough Elementary School. The District’s central School Administrative Unit (SAU) is housed as part
of South Meadow Middle School in Peterborough.

“We Are…ConVal!” serves as a collective document that describes the primary program components of our District
on behalf of our constituents. While this information is available as separate resources on our website convalsd.net,
this report provides an inclusive source of District information in one comprehensive document.

This report also contains vision and mission statements and a comprehensive set of quantifiable data that illustrate
student academic performance. Faculty and staff are committed to offering a guaranteed K-12 curriculum that
promises the same rigorous learning opportunities for all students regardless of town residence or school of
attendance.

                                                                                                        Page 3 of 67
Introduction continued
  Map of the ConVal District

Page 4 of 67
Letter from the Superintendent
Welcome to the 2019-2020 edition of “We Are . . .ConVal.” This publication is created to give the community a
comprehensive report on the District. In this year’s edition, you can review everything from historical to present
enrollment trends, achievement data, graduation rates, strategic plan progress, and even facility use.

As we move forward into the 2020-2021 school year, we will continue to use the Strategic Plan as the guiding
document for our work.              You can find the strategic plan on the ConVal website at,
http://schoolboard.convalsd.net/committees/strategic-plan/ . You can also get regular updates on what is happening
in our schools, including delays and cancellations, by following the District on Twitter, @WeAreConVal.

As a community-based institution, we want to be sure that you have the information you need about our programs
and practices to enable you to make informed decisions about your school system. If you have suggestions on what
you would like to see in “We Are. . .ConVal,” please do not hesitate to let us know.

Thank you for your continued support of ConVal.

Kimberly Rizzo Saunders, Ed.D.
Superintendent

                                                            Congratulations to ConVal Junior Sarah Hull who has
                                                            been accepted as a Senate Page for Senator Jeanne
                                                            Shaheen in Washington, D.C. Hull will head to
                                                            Washington in late January and will stay in D.C. until
                                                            June, attending school and working as a Page in the
                                                            United States Senate.

                                                                                                          Page 5 of 67
Vision, Mission, and Core Beliefs
Mission
To provide opportunities and inspire our learners to explore interests, pursue new knowledge and skills, learn about
self and others, and give of oneself to the greater community.

Vision
In the ConVal community, all learners will achieve academically, act thoughtfully, and contribute to the larger
society.

Core Beliefs
These beliefs are those ideals, thoughts, and attributes that we feel must exist for our students, our community, and
our society to thrive.

    •   We believe that All must mean All. We must provide the opportunity for each and every student to reach
        his/her maximum potential.
    •   We believe that there is not only one path to student success and achievement. We must offer students a
        variety of learning opportunities to achieve his/her version of success.
    •   Although we value the unique characteristics of each of our schools, we believe that all ConVal schools
        should provide a guaranteed, viable curriculum and be equitable in terms of learning opportunities and
        services.
    •   We believe that ConVal should continue to participate and “give back” to our local communities.
    •   ConVal is committed to full inclusion for students with disabilities. ConVal will ensure teachers and staff
        are supported to ensure all students have access to rigorous curriculum within the general education setting
        and by presuming competence of all students.
    •   We believe that understanding the learning process is paramount to our work, we are committed to knowing
        when students are and are not learning, and we believe that it is our responsibility to ensure that learning
        and student growth occur.
    •   We believe that positive relationships are the fundamental
        building block for learning.

Page 6 of 67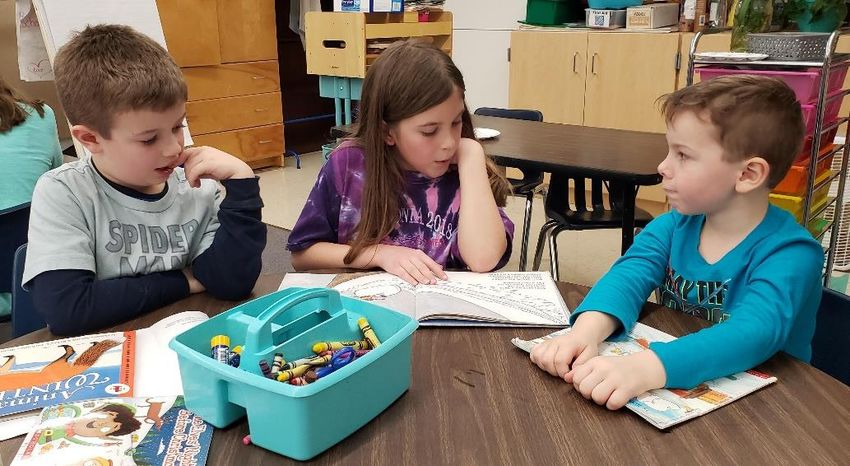
Strategic Plan
The Contoocook Valley School District has been working on the goals contained in our Strategic Plan covering
2015-2021.

The four overarching goals, as well as the priority focus areas for each goal are listed below.

Goal #1: Student Achievement/Performance
Recognizing that the primary mission of the ConVal School District is student learning, the ConVal School District
will provide high quality educational opportunities for all students that foster academic growth, the acquisition of
identified critical skills, and the development of dispositions that lead to success in higher education and the
workplace.

Priority focus areas for goal one include:

    •   Implement research-based learning frameworks, as they relate to content area, teaching strategies, critical
        thinking, and problem-solving skills to increase student learning and student achievement.
    •   Implement a fully inclusionary and equitable model across all school buildings. All students will be
        included fully in the general education experience to the greatest extent possible.
    •   Utilize a balanced student assessment program to assess student progress toward curriculum goals, inform
        instruction, and determine appropriate intervention for students.
    •   Prepare students to participate fully in their careers and workplace experiences.
    •   Support students to become partners in their own education and in the process of their own learning.

Goal #2: Culture & Community
Recognizing the importance of maintaining a strong, supportive culture among students, staff, families, and fellow
ConVal citizens, the ConVal School District, will work with these groups to foster a responsive, caring, and high-
achieving culture where all feel highly engaged, valued, and included.

Priority focus areas for goal two include:

    •   Integrate students with special education and behavioral needs into the general education classroom to the
        maximum extent appropriate to meet their needs.
    •   Promote collaboration between students, staff, and community by demonstrating respect for self, peers,
        adults, and the facility.
    •   Provide enhanced curricular opportunities through community partnerships.
    •   Prepare students to participate fully in their careers and workplace experiences.
    •   Showcase student activity and achievement to increase school visibility in community.
    •   Provide clear communication tools for use by students, staff, and community.
    •   Engage the community in determining and assessing District goals.

Goal #3: Organizational Structure
Recognizing the importance of aligning our schools and staffing with the current best practices, demographic
realities, and geographic challenges, the ConVal School District will develop an organizational structure to ensure
that all students receive the most equitable high quality resources and opportunities available.

                                                                                                       Page 7 of 67
Priority focus areas for goal three include:

    •   Consider multi-grade/multi-age as a philosophy for providing instruction in the community schools rather
        than a monetary decision.
    •   Pursue the notion of a ConVal Culture.
    •   Provide students, families, and community members with different, educationally sound, organizational
        structure options to determine which one(s) may be most acceptable to our students and the broader ConVal
        community.
    •   Develop a framework for considering new school configuration options.
    •   Consider additional uses for excess space.
    •   Finalize plans for renovating the high school in order to improve, and cluster, arts and sciences, as well as
        to improve logistics and meet new curricula standards.
    •   Explore financial impacts and conduct an analysis of cross subsidies.

Goal #4: Operations (including Personnel, Leadership, Facilities, and Technology)
Recognizing that maintaining high quality learning environments and highly competent staffing is necessary to
ensure student success, the ConVal School District will effectively research, plan, and implement best practices
around facilities, personnel, leadership, and technology.

Priority focus areas for goal four include:

    •   Maintain safe physical schools and grounds.
    •   Emergency Management Plan is current.
    •   Centralize building data sites for access by all appropriate personnel.
    •   Hire, train, and retain highly competent, efficient staff.
    •   Negotiate fair and competitive collective bargaining agreements and compensation packages.
    •   Create an evaluation system that identifies best practices in all disciplines for each group of employees.
    •   Develop a targeted professional development master plan for all staff members that supports each staff
        member’s attainment of articulated District standards for exemplary performance.
    •   Provide support for physical, social, and academic needs of students, staff, and community.
    •   Create a process to develop and provide internal leadership opportunities as appropriate.
    •   Promote the use of its facilities as a community resource.
    •   Provide equitable access to technology across all schools at each level.
    •   Provide standardized software access for each school.
    •   Develop a consistent K-12 Technology experience and set of competencies for students and staff.
    •   Transform school libraries into Learning Commons.
    •   Create digital learning environments for students.
    •   Promote digital citizenship and media literacy at all grade levels.
    •   Create and maintain an updated, interactive, user-friendly website linked to community, state, and regional
        sites, where applicable.

Join us at a monthly Strategic Plan Committee meeting for more details.

Page 8 of 67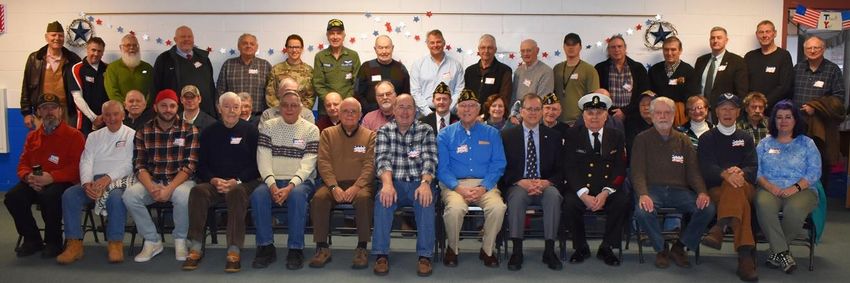
Technology in the ConVal School District
In February of 2016, the members of the ConVal Technology Committee presented a proposal titled
Anywhere/Anytime Learning Powered by One-to-One Computing to the Board of the ConVal School District. As a
result of this proposal and the accompanying presentation, the Board approved the purchase of Chromebook laptop
computers for 7th and 8th grade students at the middle schools of Great Brook and South Meadow, as well as for
9th and 10th grade students at ConVal Regional High School.

Starting in the fall of 2017, 1:1 learning environments were introduced and established in grades seven through ten.
In an on-going effort to create robust 1:1 learning environments, students in grades five and six at the middle schools
and students in grades eleven and twelve at the high school received Chromebooks this school year.

The prime motivator for approving the purchase of Chromebooks and supporting the shift to 1:1 learning
environments were Board members’ concerns over digital equity. In addition, there were aspirational goals to
provide more widespread access to digital resources and to create 21st century learning opportunities, opportunities
that emphasize the 4Cs (critical thinking, communication, collaboration, and creativity) and better prepare students
to succeed in a “digitally and globally interconnected world” (Partnership for 21st Century Learning, 2016,
January).

In the ConVal School District, as elsewhere, the digital divide is characterized by the substantive gap between
demographics that have ready access to modern information and communication technologies and those who have
only restricted access or no access at all. This differential in technology access tends to contribute to inequities in
educational opportunities that, in the end, can result in uneven chances for employment and disparate options to
participate in social and civic affairs.

ConVal’s 1:1 initiative seeks to address these existing inequities by leveling the playing field for all students,
regardless of their geographic location or financial circumstances. Both the District’s five-year strategic plan and
its three-year technology plan affirm the principle that, when it comes to providing an education in the ConVal
School District, “all means all. We must provide the opportunity for each and every student to reach his/her
maximum potential” (Contoocook Valley Regional School District, 2017).

In addition to achieving greater educational equity, ensuring “all means all,” goals of the 1:1 Initiative include:

          ●    Empower teachers and students to become collaborative partners in the learning process.
          ●    Enrich student-learning experiences through personalization and increased access to information and
               knowledge.
          ●    Enable students to be creative problem solvers and creators of content.
          ●    Encourage greater student ownership of their educational pathway.
          ●    Equip students to be self-directed and persistent in their endeavors.

Blended Learning
1:1 learning environments support the development of blended learning opportunities, which focus on
“blending together” in robust, technology-enabled learning environments:

      ●       excellent face-to-face instruction,
      ●       collaborative experiences that support students learning with and from each other, and
      ●       an emphasis on critical thinking, complex problem solving, and communicating effectively.

                                                                                                          Page 9 of 67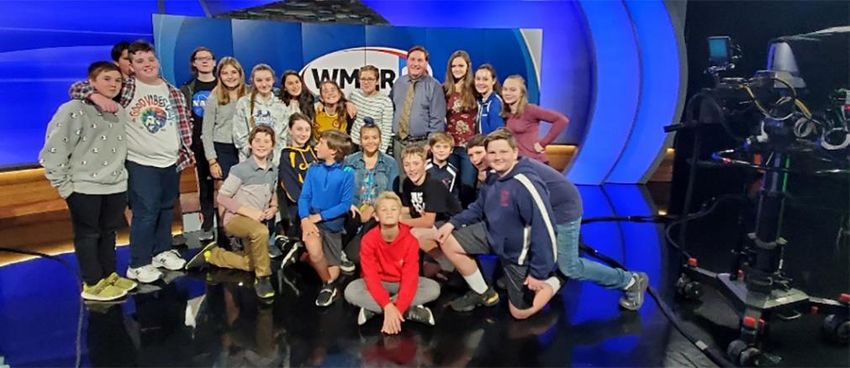
Ultimately, the ConVal School District seeks to leverage excellent instruction with the purposeful use of
technology to transform and personalize learning experiences, promoting greater student engagement,
involvement, and achievement.

                        During a CVHS Faculty meeting, students from the ConVal 2025 Committee
                        present on their upcoming school climate survey.

Page 10 of 67
District Highlights
2019 – 2020
On Thursday December 5th, Antrim Elementary School staff and PTO presented a FAMILY FUN NIGHT with
the theme, "Jump Into a Book". Each classroom had a different theme from Harry Potter to Elephant and
Piggy. A book fair was offered in the library, and pizza, salad, and desserts were served. It was fun literary night
for all.
Dublin Consolidated School had a wonderful field trip to Magic Wings butterfly place in Deerfield,
MA. Students and staff practiced patience while waiting for a butterfly to land on them.
Great Brook students accepted a "21 Day Good Citizen Challenge," and more than met it. As a result, they
enjoyed a "Paw Color Field Day" on Friday Sept. 27th.
ConVal High School’s NH Tackles Hunger Campaign resulted in 2,830 lbs. of food collected and delivered to the
Peterborough Food Pantry. In addition, $239.32 in Shaw’s Gift Cards and $741.93 in Cash Donations were
collected. ConVal Middle School and HS students joined the Food Drive held on a Saturday by the Peterborough
Food Pantry at Shaw's and assisted them in raising another $785 and 19 grocery carts of food!
Dublin Consolidated students are focusing upon citizenship and making connections to our community. On
Halloween, instead of walking up Dublin Hill, we invited community members into our building to trick or treat
with our students! Friday we started writing letters to local Veterans in honor of Veterans Day. These activities
will contribute to good citizens in our community.
Greenfield Elementary students and families enjoyed their first ever Pizza Pumpkin Palooza Literacy Night on
October 23rd. Families came together for a pizza dinner then we did a read aloud and craft activity. Teachers also
shared tools for families to bring home to help support student literacy. The evening ended with a raffle of 12
pumpkins that were decorated by students and staff.
Peterborough Elementary school nurse Pam Murphy led a Community Clothing Closet event on November 9th at
PES. She had collected used clothing that was offered to anyone in the community at no cost.
South Meadow School had the 4th annual Stemfest with approximately 60 students grades 4-8 from both middle
schools and elementary schools. The 16 UNH student ambassadors offered classes in different types of energy,
coding, and architecture. It was a great day of collaboration with UNH, local business partners and all the
schools.
The Pierce Student Leadership Team is conducting a school-wide act of giving event connected to our core
values. Students may earn bear paws for one another by being kind, safe, doing the right thing, showing courage
or giving to one another - either through a smile, helping each other keep trying at some new skill or other
ways. To date they have earned 75 bear paws for our chart in the lobby!
Bear Paws Update:
The Pierce Student Leadership Team raised 118 pounds of food for the local food pantry and earned an
unbelievable 190 bear paws (!) during their Act of Giving Challenge. Bear paws were earned for student to
student observations of giving, such as helping with reading, practicing math facts, sharing materials or just with
tying a shoe for a friend. Congratulations Pierce students!
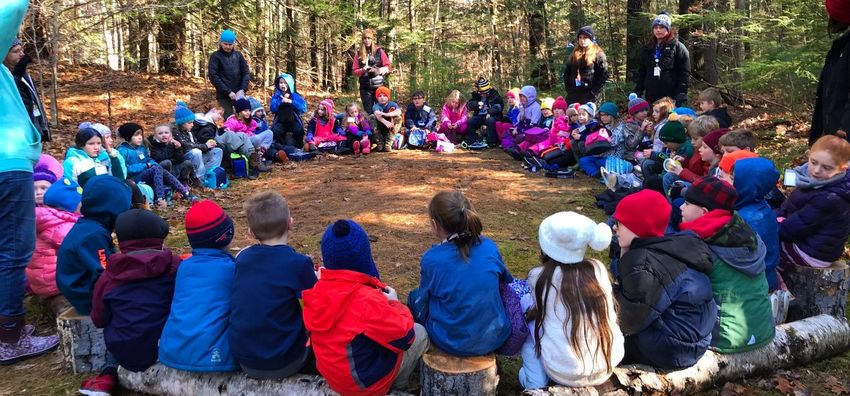
Francestown Elementary School recently held their second Outdoor Lions Learning Time where the students and
the teachers take the learning outside for the whole morning. Community members and students have all helped to
Page 11 of 67shape the outdoor learning spaces and the teachers have done an amazing job connecting the learning to our natural surroundings. Greenfield Elementary students have participated in a weeklong Page to Stage Dance Residency with ConVal graduate and GES parent Tanya Bosse. Students brought the book “The Snow Party” to life and performed for families at the recent event. Great Brook School "Friends of Music" held their eight annual "Holiday Craft Fair," earning $1600 for the music program. FES staff recently met with their Community Expert Partners to begin planning their projects that students will be participating in from January through June. Students will be working in small groups to learn about local community organizations and help to solve real-world issues that are facing the organizations. Hancock Elementary School 3rd graders shared their learning of reptiles through a museum walk. The students researched and wrote an informational paragraph about a chosen reptile. They then created a clay replica of the reptile. Their work was displayed in the library allowing all children to see the displays and learn a bit about the different animals. Peterborough Elementary 4th graders presented an Abenaki Museum walk on Monday, November 25th. Students from all grades, staff, and families viewed a plethora of replica Abenaki artifacts, info, games, houses, and even got to sample a variety of stone and sister soups. Great Brook School: the WGBS students presented at the Christa McAuliffe Technology Conference in Manchester on Dec. 4th. South Meadow School hosted their Annual Veteran's Breakfast on Dec. 6. This event was and always is a wonderful experience for our students and veterans. ConVal High School: • Congratulations to the ConVal music students went to Hartford High School in Vermont on Saturday, December 7, to participate in the New England Music Festival Association's Solo and Ensemble Festival. From these performances, students will be selected to participate in the New England Band, Choir, or Orchestra. This year's concert will be held at Dartmouth in Hanover. • ConVal freshmen Abbey Shumway and Callie Boisvert have organized a 5k fun run to highlight the need for Mental Health Awareness. The fundraiser brought in over $1,500 that will be donated to the New Hampshire chapter of the American Foundation for Suicide Prevention. • Catrina Kipka was the driving force behind the planning to bring motivational speaker James Orrigo to ConVal in the spring of 2020; Orrigo performs under the stage name Lad in a Battle and seeks to inspire students to live purposefully through service to others. • CVHS’s Junior, Sarah Hull has been accepted as a Senate page for Jean Shaheen in Washington DC. She will be heading there in late January and will be in DC until June attending school and working as a page in the US Senate. The page program is very competitive, and she is the first student from CVHS to be accepted to this program. • Six members of the CVHS faculty, including two academic teachers and the head of school counseling, attended the ACTE Vision 2019 conference to learn more about career and technical education and the many ways it can support and engage students. • Students met with Olivia Belanger of the Keene Sentinel to talk about student-led initiatives to bring mental health and suicide awareness to students at ConVal as well as inspire students to be kind to one another during the year. The students supporting the Yellow Tulip Project were Rosie Crooker (11), Cruz Dellasanta (12), and Hannah Doherty (12). The Yellow Tulip Project seeks to address the stigma surrounding mental Page 12 of 67
illness and to build a community of people who realize that hope happens when youth and community leaders
    work together.
•   Senior Justin Kiblin placed in the top ten automotive students in the state on a skills competition and has been
    invited to participate in the NH Auto Dealers Association applied competition at Lakes Region Community
    College on January 11.
•   ConVal Regional High School junior Brigham Boice of Peterborough was presented with the Daughters of
    the American Revolution Mary Desha Medal for Youth at the New Hampshire DAR Fall Meeting this past
    Friday. The Mary Desha Medal for Youth honors a Youth for outstanding service to the community, state, or
    nation, through participation and/or leadership in such activities as conservation, organized sports, scouting,
    church or community, and state or national service organizations. This individual will have exceeded
    expectations for the nominee’s age.
•   CVHS Vex Robotics team was awarded a robotics education grant from the NHDOE to help with costs
    during competition season!
•   ConVal hosted a regional TechWomen Ambassadors event on 11/12. Jane Mauer of SNHU addressed
    students, as did Cyrena Arnold of Athenium Analytics regarding different career opportunities in various
    technology fields for students of all genders. Over 65 students attended, including 12 from Conant.
•   Everett “Rett” Landers, senior, was chosen to represent ConVal as the designer of this year’s Children in the
    Arts Lantern Parade poster designer.
•   The Varsity Boys Soccer team won the Division 2 State Championship for the second season in a row.
•   Lily James and Molly Cole played in the Division 2 Senior All-Star Volleyball game on 11/16.
•   The production of “Our Town” by Thornton Wilder, directed by junior Abby Theberge in her directorial
    debut had a successful opening on Thursday, November 14 thru Saturday, November 16.

2018 -2019

    •   The Sanford Programs at National University System officially let us know that Maryanne Cullinan is a
        2018 Sanford Teacher Award recipient, which comes with a $10,000 recognition. She will be part of an
        esteemed group of 51 inspiring teachers representing each state and the District of Columbia.
    •   On December 5, 2018, ConVal celebrated its admission to the global network of “Partners for the Future”
        schools. The program was launched in 2008 by Germany’s Federal Foreign Office for the development
        and advancement of German language education. ConVal is one of just 13 schools nationwide to receive
        this award.
    •   CVHS students Garrett Shows and Andres Tourgee received the Walter A. Smith Special Recognition
        Award at the NHIAA Annual Meeting.
    •   ConVal art teacher Mary Goldthwaite-Gagne was the featured artist of a cut paper exhibit entitled
        “Guided By (Female) Voices” at the Aviary Gallery in Jamaica Plain, MA, during the month of February.
        In October, Goldthwaite-Gagne was the spotlight artist of the month on the Arts Alive website.
    •   The ConVal Varsity Boys Soccer team won the school’s first-ever state championship.
    •   ConVal Unified Soccer won back-to-back state championships.
    •   The ConVal Cross Country team earned runner-up for the Division II State Title.
    •   Evan Coyne won an athletic scholarship to attend Bryant University, a private, Division I university in
        Smithfield, Rhode Island.
    •   Rachel Hurley won an athletic scholarship to attend Lafayette College, a Division I school in Easton,
        Pennsylvania.
    •   The WGBS students, along with Maryanne Cullinan and Ellen Kidd, presented at the "Integrating STEM
        in K-12 Education" Technology Conference in Laconia New Hampshire on October 26th. This event was

                                                                                                      Page 13 of 67
put on by the New Hampshire Technology Teachers Association. Reports were that many teachers
commented on the poise and creativity of our GBS Bobcats.
• Nine SMS students have been accepted to be published as authors. This was out of 13,000 entries. Ms.
Hopgood’s 8th grade students were encouraged to enter a creative writing contest through "Young
Writers" some months ago. These students will be published in Stranger Sagas - New Hampshire that is
scheduled for publication February 28, 2019.
• On December 5th SMS fifth grader Max Cail ran at the Junior Olympics cross-country championships in
Reno, Nevada. Out of 300 runners, Max placed 15th! That makes him one of the fastest fifth graders in
the USA- congratulations Max!
• Eleven ConVal students were chosen to play in the All-New England Festival Band.
Page 14 of 67Enrollment History
ConVal School Enrollment by School Level
2009 - 2019
3000
2755
2500 2581
2504
2390 2332
2230 2179 2194 2181 2207
2130
2000
Axis Title
1500
1000
500
0
2009 2010 2011 2012 2013 2014 2015 2016 2017 2018 2019
Axis Title
Elem Middle High Dist
The 2019-2020 enrollment numbers are based on January 1, 2020 data.
Elementary enrollment count includes Preschool students.
Page 15 of 67Future Enrollment Projection Page 16 of 67
School Attendance
ConVal School District Attendance Percentages

                    2013-2014       2014-2015        2015-2016       2016-2017   2017-2018    2018-2019
                   CV     State     CV State         CV State        CV State    CV State     CV State
 Kindergarten      95      94       95     94        95     94       96     95   95     94    95     94
 Elementary        96      95       96     95        96     96       96     95   95     95    96     95
 Middle School     95      95       95     95        95     95       94     95   95     95    94     94
 High School       93      93       93     93        92     93       90     94   92     93    92     93
 District Total    95      95       94     94        95     94       95     94   94     94    94     94

    •   ConVal is consistently at or above the state attendance average.

                                                                                             Page 17 of 67
Drop-Out Rate
Dropout Rate
CVHS Compared to State of NH
2012 - 2018
2.50%
2.00%
Drop-out Rate
1.50%
CVHS
NH
1.00%
0.50%
0.00%
2012 2013 2014 2015 2016 2017 2018
• 2019 Drop-out rates unavailable at the time of this publication.
Page 18 of 67Graduation Requirements
Competencies
ConVal Regional High School (CVHS) identified core competencies as part of a detailed curriculum review process
in 2005. These core competencies identified critical skills to best prepare student success in the 21st century. CVHS
is now involved in a detailed curriculum mapping process to review, reflect and revise these competencies as
needed, as well as building connected assessments to assure proficiency of skills. These competencies are directly
connected to the grade in each course graduation requirement as identified by the New Hampshire State Board of
Education and the ConVal School District.
Credit Requirements:
The ConVal School Board requires that students acquire 26 course credits in order to graduate with a CVHS
diploma. This must include 14 credit courses in certain areas required by the State, as well as 2 to 3 credits in
specific areas deemed necessary by the School Board. The following outlines all requirements:
Subject Minimum Credit
English 4 credits
Global Studies 1 credit
Economics .5 credit
Government/Civics .5 credit
US History 1 credit
Physical Science 1 credit
Life Science 1 credit
Lab Science 1 credit
Mathematics 4 credits
Physical Education 1 credit
Health 1 credit
Information & Communication Technologies .5 credit
Art Education .5 credit
Career Explorations .5 credits
Consumer Education .5 credits
Elective Offerings 9 credits
NH State Scholars:
New Hampshire Scholars is a collaborative venture between local businesses and school districts that is designed
to encourage students to challenge themselves by taking more rigorous courses than State requirements demand as
they proceed through the high school years. The program specifies the courses that students need to take in order to
receive the New Hampshire State Scholars seal on their transcript. Successful completion of this course of study
could result in scholarship opportunities that are becoming increasingly available to these students, not only in the
State of New Hampshire, but also throughout the country as the National Scholars Program becomes more wide
spread. Currently, there are 41 school districts, including ConVal, who subscribe to this effort.
Page 19 of 67Post-Graduate Education
Post-Graduate Plans for CVHS Graduates
70%
59%
60%
56%
51% 50%
50% 48% 48%
% of ConVal Graduates
43%
40%
30%
25%
20% 18% 18% 17% 17%
13%
10%
5% 5% 5% 7% 5%
3% 3% 3%
0%
2013 2014 2015 2016 2017 2018 2019
4-year colleges 2-year colleges Military
• The percent of students planning to attend post-secondary education has remained at or above 65% prior
to 2013.
2018 Post Graduation Plans
CVHS comparted to State of NH
70%
59%
60%
52%
50%
% of 2018 Graduates
40%
30% CVHS
20% State
20%
13%
10%
3% 3%
0%
4-year Colleges 2-year Colleges Military
• 2019 State data unavailable at the time of this publication.
Page 20 of 67Student Services
In support of the ConVal School District’s mission, Student Services provides a full spectrum of services for more
than 2,100 students. Student Services provides enrollment, instructional, and school counseling services, and on-
demand crisis prevention and crisis intervention services. Student Services serves as the District’s resource center
for students who experience abuse or neglect and assist families who are in transition or homeless.
Student Services is currently responsible for the Student Services staff which includes; School Social Workers,
School Counselors, English Language Learner Teacher, and Nurses. The Director of Student Services serves as the
McKinney Vento Homeless Liaison and the school District’s Court Liaison. Student Services monitors portions of
the District Budget and coordinates staff trainings/Professional Development focusing on student mental health
(Youth Mental Health First Aid-YMHFA), as well as behavioral intervention training and support for school District
staff (Life Space Crisis Intervention-LSCI and Crisis Prevention Intervention-CPI). Student Services works with
school district administration regarding enrollment and attendance policies as well as procedures. Student Services
also supports 504 accountability across the District.
Student Services implements the School-Wide Integrated Framework for Transformation (ConVal 2025). The
Student Services oversees Community and Regional Grant Management, Youth Education Employment Service
(YEES), program development and management, ensuring compliance with established policies and procedures
and/or regulations, understanding the educational needs of ConVal’s students, and the monitoring of data to make
informed decisions.
At ConVal Student Services, we believe in an integrated team approach to problem solving. We take pride in the
fact that the Student Services Department is where parents, students, teachers, and staff go when they need help,
resources, or support.
The Student Services mission is to achieve the strategic vision of SAU #1 by providing direction and support to
each member school to ensure legal compliance and successful implementation of best practices to meet the needs
of all students.
If you have questions, please feel free to contact Cari Christian-Coates, Director of Student Services, (603) 924-
7503, x. 2048 or ccoates@conval.edu.
Page 21 of 67Student Services continued
Student Services Organizational Chart
Page 22 of 67Special Education
The Special Education Department is responsible for special education staff and Individualized Education Programs
for the District’s educationally identified students to meet all Federal/State requirements. The Special Education
Department’s responsibilities include: Preschool Teachers, Paraprofessionals, School Psychologists, Physical
Therapists, Special Education Teachers, Speech Language Pathologists, Speech Language Pathology Assistants,
Occupational Therapists, Occupational Therapist Assistants, Teacher of the Deaf, High School Transition
Coordinator, High School Special Education Administrator, Special Education Coordinators, Emotional Support
Program, Intensive Learning Support Program, Behavior Elementary Support Team, Extended School Year
Programs, Out of District Placements, on site evaluations, state visitations and State Performance Plan indicators,
professional development for personnel within the department, specialized transportation, and support to the
Assistant Superintendent for instructional services and professional development. Special Education overlaps with
Student Services Department in responsibilities related to First Friends Preschool Program and Court Liaison.
In closing, the mission of the Special Education Department is to achieve the strategic vision of SAU 1 by providing
direction and support to each member school to ensure legal compliance and successful implementation of best
practices to meet the needs of all students. If you have questions, please feel free to contact Ben Moenter, Director
of Special Education, 603-924-7503.
Page 23 of 67District and State Assessments
Why We Assess
District and State assessments help us to better understand and report on students’ learning throughout the school
year. Results from these assessments are used diagnostically by teachers to decide what skills and knowledge to
prioritize when working with students. Following the administration of District assessments, grade-level or subject-
area teams typically meet to review the results. During these meetings, teachers analyze students’ performance in
order to identify key areas of strength and need. Information gathered from this analysis directly informs the
instruction that teachers offer students. Our goal is to tailor the instruction provided to students in such a way that
it maximizes levels of learning and achievement.
Information from State and District assessments also plays an important role in our on-going review and analysis
of school and District performance. Student achievement, as measured and reported by these assessments, help us
to evaluate the effectiveness of our instructional strategies and programs in supporting students to meet grade-level
standards.
How Much Time Does All This Take?
In 2012, ConVal carefully studied the total time spent on District and state assessments and found that these
assessments reflect approximately 3% of total teaching time, leaving 97% for instruction and other kinds of
classroom-based progress monitoring.
Typical Assessment vs. Instruction Most Closely Monitored Students
Time Assessment vs. Instruction Time
97% 93%
7%
3%
Instruction
Instruction
Assessment Assessment
Page 24 of 67Scholastic Aptitude Test (SAT)
The ConVal School District administers the Scholastic Aptitude Test (SAT) to all high school juniors. Each year,
more than two million students take the SAT. Nearly every college in America uses the test as a common and
objective scale for evaluating a student's college readiness.
The College Board offers guidelines on the appropriate use of SAT scores, and notes that most College Board tests
are taken only by particular groups of self-selected students. The results are important indicators in predicting
college success for individual students. It is not a curriculum-based achievement test, and is limited in that it does
not measure work habits, enthusiasm, desires, study skills, responsibility, creativity, artistic ability, musical talent,
leadership skills, interest, motivation, perseverance, initiative or character.
The SAT assesses reading, writing, and mathematical reasoning skills. These skills are developed over time both in
and outside of the classroom. Therefore, SAT scores are useful in making decisions about an individual student’s
linguistic and mathematical abilities, and in assessing academic preparedness.
Furthermore, the College Board stresses that in looking at average SAT scores, the user must understand the context
in which the particular test scores were earned. Other factors related to performance on the SAT include academic
courses studied in high school, family background, and education of parents. These factors, and others which are
less apparent, may have a significant influence on average test scores.
Average SAT scores, along with many other indicators of quality, may be analyzed over time to reveal trends
regarding the academic preparation of students who take the test. A careful examination of all these factors, as well
as conditions impinging on the educational process, such as teacher pupil ratios, adequate classroom space, and
expenditures is also important.
Congratulations to Allison Bull, Ian Aldrich, and
Kelley Akerley! The ConVal Envirothon Team
took 1st place in the forestry category and 3rd
in the wildlife category on Competition Day.
Page 25 of 67Scholastic Aptitude Test continued
SAT Critical Reading Scores
2010 2011 2012 2013 2014 2015 2016
ConVal 528 549 528 532 547 521 546
NH 520 523 521 524 524 525 527
National 500 497 496 496 497 495 494
SAT Mathematics Scores
2010 2011 2012 2013 2014 2015 2016
ConVal 542 549 533 518 530 514 531
NH 523 525 525 528 538 530 531
National 515 514 514 514 513 511 482
SAT Writing Scores
2010 2011 2012 2013 2014 2015 2016
ConVal 506 531 500 511 525 509 515
NH 510 511 510 515 512 511 510
National 491 489 488 488 487 484 482
2019 SAT Scores
Reading & Writing Scores Math Scores
ConVal 536 518
NH 535 528
National 536 531
2018 SAT Scores
Reading & Writing Scores Math Scores
ConVal 536 523
NH 525 518
National 533 527
2017 SAT Scores
Reading & Writing Scores Math Scores
ConVal 531 549
NH 522 514
National 533 527
Page 26 of 67Advanced Placement Courses
Advanced Placement (AP) is a program created by the College Board offering college-level curriculum and
examinations to high school students. American colleges, as well as some international institutions, waive
prerequisite courses for students who obtain high scores on the examinations. The AP curriculum for the various
subjects is created for the College Board by a panel of experts and college-level educators in each subject. For a
high school course to have the AP designation, the course must be audited by the College Board to ascertain it
satisfies the AP curriculum requirements.
CVHS 2012 2013 2014 2015 2016 2017 2017 2018 2019
Total AP Students
100 97 78 80 92 101 101 86 106
Number of Exams
169 167 122 130 148 150 150 135 174
AP Exams with Scores 3+
73 73 97 113 120 125 125 111 139
% of Total AP Exams
43% 44% 80% 87% 81% 83% 83% 82% 80%
with Scores 3+
• ConVal High School currently offers Advanced Placement (AP) courses in Biology, Calculus, Calculus
and Physics, Chemistry, English Language and Composition, English Literature, German Language,
Spanish Language, Studio Art, United States History, and World History.
• Achieving a score of 3 or above is considered exemplary performance on an Advanced Placement exam.
Many post-secondary institutions will waive pre-requisite course requirements for scores of 3 and above.
• Most ConVal AP students take multiple AP exams in one season.
CVHS Students in Dr. Milne’s class learn about freezing point depression.
Page 27 of 67New Hampshire Statewide Assessments
The New Hampshire Statewide Assessment System (SAS) was administered for the first time during the
2017-2018 school year. The New Hampshire Statewide Assessment for English Language Arts (ELA) and Math
replaced the Smarter Balanced Assessment Consortium (SBAC), and the New Hampshire Statewide Assessment
for science replaced the New England Common Assessment Program (NECAP). Students in grades 3-8 take the
New Hampshire Statewide Assessment for ELA and math, and students in grades 5, 8, and 11 take the New
Hampshire Statewide Assessment for science.
New Hampshire Statewide Assessments are designed to measure students’ progress in meeting New Hampshire’s
College and Career Readiness Standards, which focus on the critical thinking, problem solving, and reasoning skills
students need in today’s world.
State Test for Math
Percent of Students Proficient or Above
60
52 53
50
48 47 47
50 45
43 44 44
41
39 39 39 38 38 39
40 36 35 36 36
33 33 32
31 30
28 27
30
23
21
20
10
0
Gr. 3 Gr. 4 Gr. 5 Gr. 6 Gr. 7 Gr. 8
2015 - SBAC 2016 - SBAC 2017 - SBAC 2018 - SAS 2019 - SAS
State Test for English Language Arts
Percent of Students Proficient or Above
70 64
61 59 61 60
58 56 57 58
60 53 53 54 53 54
52 52
47 47 48 49 48 46
49
50 45 45 45
38 40 42
40 37
30
20
10
0
Gr. 3 Gr. 4 Gr. 5 Gr. 6 Gr. 7 Gr. 8
2015 - SBAC 2016 - SBAC 2017 - SBAC 2018 - SAS 2019 - SAS
Page 28 of 67New Hampshire Statewide Assessments continued
State Test for Science
Percent of Students Proficient or Above
60 55
51 50
48
50
42
38
40
32 32 31 31 32
30
30 27
19 19
20
10
0
2015 - NECAP 2016 - NECAP 2017 - NECAP 2018 - NH SAS 2019 - SAS
Gr. 4 Gr. 5 Gr. 8 Gr. 11
Congratulations to ConVal High School students
Greta Topping, Zoe Werth, Finn Wegmueller, and
Katrina Kipka for winning an international video-
making contest about a Wincent Weiss song.
Page 29 of 67AIMSweb AIMSweb® is a benchmarking and progress monitoring system based on direct, frequent, and continuous student assessment. A “benchmark” is a standard measure of what a student should know and be able to do at a given time. These benchmarks span from letter naming at the primary level to reading fluency and comprehension through high school. The results are reported to teachers and administrators online and shared with students and parents. AIMSweb’s assessments are aligned with grade-level expectations and used for monitoring students’ learning progress. How is AIMSweb testing done? • AIMSweb testing is administered orally and/or “paper/pencil” style • Testing is done individually or in groups, depending on the measure • AIMSweb measures take 1–10 minutes to complete (most take 1–4 minutes) • Scores are uploaded into the AIMSweb system Benchmarking helps to inform instruction and to improve achievement. Benchmark assessments are given three times per year (September, January, and May) for all students in grades kindergarten through fourth, using grade-level assessment tools. Reports help focus areas of individualized instruction and evaluate student progress. Page 30 of 67
AIMSweb Reading Test Results

                                        Kindergarten AIMSweb
                              Percent of Students At or Above Benchmark
90                                  81           81               82                     83
                    77                                                                               77
80                                                                           72
70      60
60
50
40
30
20
10
 0
       2012        2013            2014        2015              2016       2017        2018        2019

                                     First Grade AIMSweb
                          Percent of Students At or Above Benchmark
80      71
70                                                                           66
                                    60           62               61
                                                                                         56          58
60                  53
50
40
30
20
10
 0
       2012        2013            2014        2015              2016       2017        2018        2019

                                    Second Grade AIMSweb
                          Percent of Students At or Above Benchmark
80         72            73
      64          67                                  64                                      67
                                         62
                                               58                60 63                  59                60
60
                                  56                                        55 58
                                                                                                    50

40

20

 0
     2011-2012   2012-2013       2013-2014    2014-2015        2015-2016   2016-2017   2017-2018   2018-2019

                                                      Fall   Spring

                                                                                                   Page 31 of 67
AIMSweb Testing Results continued
Third Grade AIMSweb
Percent of Students At or Above Benchmark
80 71 70
68
70 64
57 59 60 58 58 57
60 56 56 54 55 56
50
50
40
30
20
10
0
2011-2012 2012-2013 2013-2014 2014-2015 2015-2016 2016-2017 2017-2018 2018-2019
Fall Spring
Fourth Grade AIMSweb
Percent of Students At or Above Benchmark
66
70 63 65 63
59 60 58 59
60 57
52 54
50 51
48
50
39
40 36
30
20
10
0
2011-2012 2012-2013 2013-2014 2014-2015 2015-2016 2016-2017 2017-2018 2018-2019
Fall Spring
Page 32 of 67NWEA
NWEA’s Measures of Academic Progress™ (MAP) assessment provides teachers and parents with a clear picture
of students’ achievement and growth year-over-year in the areas of reading and math. Additionally, beginning in
the Fall of 2013, the MAP assessment aligned with the skills and content outlined in New Hampshire’s College and
Career Readiness Standards.
One of the unique advantages of MAP is that it is a computer test that adapts to a student’s level of learning. What
this means is that as a child answers questions accurately the test questions get harder, if they get questions incorrect
the following questions will be easier. This creates a context for each student to have the same opportunity to
succeed and maintain a positive attitude toward testing. With MAP tests, we can administer shorter tests and use
less class time while still receiving detailed, accurate information about a student’s growth. Teachers use the
results to guide their instruction and planning as they work to meet each child’s learning needs.
Reading Math
Fall 2018 Spring 2019 Fall 2018 Spring 2019
Proficient or Proficient or Proficient or Proficient or
Above Above Above Above
Kindergarten - 60% Kindergarten - 66%
Grade 1 64% 64% Grade 1 62% 65%
Grade 2 67% 70% Grade 2 73% 82%
Grade 3 55% 66% Grade 3 56% 56%
Grade 4 53% 50% Grade 4 53% 41%
Grade 5 60% - Grade 5 45% -
Grade 6 64% - Grade 6 45% -
Grade 7 68% - Grade 7 51% -
Grade 8 73% - Grade 8 56% -
Grade 9 65% 57% Grade 9 57% 52%
Grade 10 75% 74% Grade 10 70% 67%
Page 33 of 67NWEA continued
Reading Math
Fall 2017 Spring 2018 Fall 2017 Spring 2018
Proficient or Proficient or
Proficient or Proficient or
Above Above
Above Above
Kindergarten - 60% Kindergarten - 69%
Grade 1 58% 66% Grade 1 61% 76%
Grade 2 71% 74% Grade 2 69% 74%
Grade 3 56% 52% Grade 3 48% 54%
Grade 4 57% 52% Grade 4 47% 43%
Grade 5 67% - Grade 5 49% -
Grade 6 61% - Grade 6 39% -
Grade 7 61% - Grade 7 43% -
Grade 8 57% - Grade 8 50% -
Grade 9 59% 70% Grade 9 57% 58%
Grade 10 69% 53% Grade 10 75% 45%
Reading Math
Fall 2016 Spring 2017 Fall 2016 Spring 2017
Proficient or Proficient or Proficient or Proficient or
Above Above Above Above
Kindergarten - 59% Kindergarten - 58%
Grade 1 65% 71% Grade 1 64% 73%
Grade 2 57% 58% Grade 2 57% 63%
Grade 3 58% 60% Grade 3 53% 49%
Grade 4 57% 61% Grade 4 45% 45%
Grade 5 68% - Grade 5 49% -
Grade 6 61% - Grade 6 42% -
Grade 7 63% - Grade 7 51% -
Grade 8 64% - Grade 8 53% -
Grade 9 74% 72% Grade 9 79% 69%
Grade 10 85% - Grade 10 79% 76%
Page 34 of 67We Are...ConVal
Page 35 of 67Educational Level of Professional Staff
2012 - 2020 Education Level of Professional Staff - Comparison of ConVal vs State of NH
70
59 60 59 60 59 60 59 60
60 59 58 59
57 57 56
55
50
43 42 42
% of Staff Members
41 40 40 41
39 39 39 39 39 39 38
40 37
% Bachelor's
% Master's
30 % Beyond Masters
20
10
3 2 3 2 3
1 1 1 1 1 1 1 1 1 2
0
ConVal State ConVal State ConVal State ConVal State ConVal State ConVal State ConVal State ConVal
District Total District Total District Total District Total District Total District Total District Total District
2012-2013 2013-2014 2014-2015 2015-2016 2016-2017 2017-2018 2018-2019 2019-20
• The ConVal School District is a Professional Learning Community whose members continue their own education through professional
development workshops and course work for advanced degrees.
• More than half of ConVal teachers have attained a Master’s Degree in their field.
• State data for the 19-20 school year is unavailable at time of publication.
Page 36 of 67You can also read