What determines in higher education? - students' social integration
←
→
Page content transcription
If your browser does not render page correctly, please read the page content below
What determines
                students’ social integration
                   in higher education?
THEMATIC R EVI EW • 202 1
What determines
students’ social integration
   in higher education?
       T HE M AT IC R E V IE W • 202 1
EUROSTUDENT VII PARTICIPANTS
ISO-code / Country name
AL Albania GE Georgia NL Netherlands
AT Austria HR Croatia NO Norway
CH Switzerland HU Hungary PL Poland
CZ Czech Republic IE Ireland PT Portugal
DE Germany IS Iceland RO Romania
DK Denmark IT Italy SE Sweden
EE Estonia LT Lithuania SI Slovenia
FI Finland LU Luxembourg TR Turkey
FR France MT Malta
Authors Ardita Muja, Sylvia Mandl, Joris Cuppen, Kristina Hauschildt
Design Maff design, Ewijk - the Netherlands
Print BENDA druk & print, Wijchen - the Netherlands
Cite as Muja, A., Mandl, S., Cuppen, J. & Hauschildt, K. (2021). What determines
students’ social integration in higher education? Wijchen: Benda druk & printContent
1 Background 6
2 Data and operationalisation 9
EUROSTUDENT data 9
Aggregated EUROSTUDENT VII data 10
Micro data EUROSTUDENT VII 11
Operationalisation 11
3 Descriptive findings 14
4 Multivariate results 19
General findings 19
Country differences in social integration 26
5 Summary & discussion 34
6 References 381
Background
An inclusive environment in higher education that fosters equity and diversity is a
stated goal of European higher education policy (Annex II to the Rome Communiqué,
2020; European Commission, 2020). Nevertheless, data from the EUROSTUDENT
SURVEYS (Hauschildt et al., 2021; DZHW, 2018; Hauschildt et al., 2015) have repeatedly
shown that students’ study and living conditions are greatly shaped by their parents’
educational and financial background. Students whose parents have not attained a
tertiary degree are underrepresented in most EUROSTUDENT countries, and their
parents are financially less well-off than those of students with parents with a tertiary
degree. Students’ financial difficulties have been shown to be clearly related to their
parents’ financial status. Students whose parents have not attained a tertiary degree
tend to enter into higher education (HE) later and do so more often using alternative
access routes. Non-universities and short-cycle and Bachelor’s (vs. Master’s)
programmes register higher proportions of these students. Working alongside studies is
more common for ‘first-generation’ students. They rely on their family to finance their
studies less often.
Besides objective differences in students’ study and living conditions, increasingly, the
individual student’s subjective experience has attracted the interest of researchers.
Particularly, but not exclusively in fee-funded systems, students’ assessments of their
learning experiences and environment play an important role in quality assurance and
serve to provide feedback to institutions (Klemenččičč & Chirikov, 2015). Gaining insight
into students’ perceptions has also been highlighted as important for understanding
their study-related decisions and behaviour, e.g. persistence (Tinto, 2017). Due to
the key role student experiences are thought to play in linking the institutional
environment and student outcomes, understanding students’ perceptions of their study
environment can help identify potentially at-risk groups and help to develop measures
to support students who are less satisfied with their study experiences.
A key element of the student experience with particular relevance for the social
dimension of higher education is students’ social integration, which refers to the
extent of interactions students have with other relevant actors in the higher education
6system (fellow students and lecturers)1. How students in higher education interact with
the institution’s social and academic system is influenced by a range of background
characteristics and goal commitments (Pascarella & Terenzin, 1980). Students
who do not have a higher education background can struggle to integrate into the
unknown culture and practices within higher education (Bourdieu, 1984; Holmegaard,
Madsen, & Ulriksen, 2017). Research shows that students from better educated
families have chances of tertiary degrees themselves (Bar Haim & Shavit, 2013; OECD,
2018; Vossensteyn et al., 2015) and that familial financial status strongly influences
educational attainment across generations (Pfeffer, 2018; Stuhler & Biagi, 2018;
Wightman & Danziger, 2014). Not having to work besides studies can increase the time
Maseviččiūtė et al.,
spent on studies (Masevi al. 2018), which may also influence social integration.
The social integration of students and their sense of belonging in higher education
varies due to actual differences in the learning environment, such as type of housing
(Riker & Decoster, 2008; Schudde, 2011), but has also been shown to vary according to
student characteristics, as impairments (Hauschildt et al., 2020), parental education
(Gillen-O’Neel, 2019), minority status (Fan et al., 2021; Johnson et al., 2007) and socio-
economic status (Ahn & Davis, 2020). Studies have shown that students with higher
degrees of social integration are more motivated and display higher persistence (Garza
et al., 2021; Hausmann et al., 2007; Noyens et al., 2019; Snyder, 2017; Tinto, 2017).
Building on these findings, a closer look is taken within this review on how specific
social background characteristics (i.e. parental and educational background), financial
study resources, work and study experiences (i.e. time spent on work and studies) are
related to the social integration of students from different countries. This review aims,
firstly, to provide a comparative overview of students’ social integration related to both
fellow students and lecturers. Descriptive statistics for different groups of students (by
demographic characteristics, social background, living conditions and study situation)
allow for the analysis of common cross-country patterns and highlight which student
groups may face particular challenges. Secondly, multivariate analyses are used to
identify the most relevant factors that contribute to high or low levels of students’
social integration by analysing and controlling for several variables at once, including
socio-demographic characteristics of students, aspects of their living and study
1. This definition is based on Dahm et al. (2016); as Wol-Wendel, Ward, and Kinzie (2009) note,
integration is used by different scholars to mean different things.
7situation, as well as indicators relating to their current study situations. The research
questions are therefore:
1. Which factors contribute to students’ social integration at higher
education institutions?
2. How do they vary across countries?
The conceptual approach used for analysis in this paper partly draws upon Tinto’s (1975)
theoretical explanations of dropout behaviour of students within higher education, as
well as its operationalisation by Dahm et al. (2016). Tinto views university as a social
system that has its own values and social structures, which students need to go along
with to avoid dropping out. He distinguishes between academic integration and social
integration. While the first can be measured in grades and intellectual development,
the latter is defined as “the interaction between the individual with given sets of
characteristics (backgrounds, values, commitments, etc.) and other persons of varying
characteristics within the higher education institution” (p. 107). Social integration thus
not only involves peers, but also the faculty and administrative personnel of the higher
education institution. Although social and academic integration are usually related (e.g.
exchange with peers leading to better grades), it is possible to achieve integration in
only one of the two areas.
This thematic review contributes to the understanding of a key element of the
student experience in higher education – social integration – and, due to the large
number of countries covered from a comparative perspective, provides insights into
country-specific patterns, thus laying the groundwork for further research and policy
development. Through the simultaneous analysis of several potentially relevant factors,
the results allow for a differentiated and comprehensive understanding of the factors
relevant to students’ social integration.
82
Data and operationalisation
EUROSTUDENT data
We examine our research questions with cross-national data from the EUROSTUDENT
VII project. EUROSTUDENT provides information based on student surveys on the social
and economic conditions of student life in Europe. It holds important indicators on the
current state of the social dimension in many European countries. A variety of topics on
current study life are covered: (1) students’ background (demographic characteristics
and social background), (2) study conditions and experiences (access to and transition
within HE, study conditions and quality, time budget and mobility), and (3) students’
living conditions (employment, resources, expenses and housing situation). The data
from EUROSTUDENT VII provide comprehensive information to describe, explain and
assess the state of the social dimension in the European higher Education Area (EHEA).
EUROSTUDENT topics
• Socio-economic background of students
• Transition into and within higher education
• Types and modes of study
• Students’ time budget
• Students’ employment and internships
• Students’ resources
• Students’ expenses
• Housing situation
• Students’ international mobility
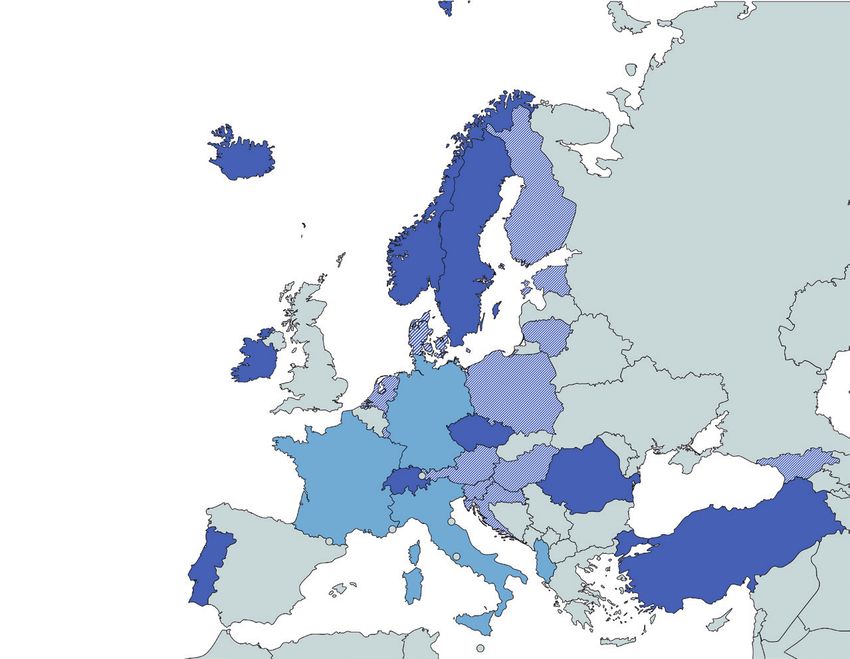
For the current round (VII), 26 countries in the EHEA collected data between 2019 and
2021.
9 Participant with aggregated data
Participant with micro data and aggregated data
Participant with no data on discussed items (yet)
EUROSTUDENT’s target group includes all students who, at the time of observation, are
enrolled in any national study programme regarded as higher education in a country.
Generally, this corresponds to ISCED (2011) levels 5, 6 and 7. Short descriptions of the
aggregated data and micro data are provided in the following sections.
Aggregated EUROSTUDENT VII data
In the EUROSTUDENT project, all participating countries provide data on the
aforementioned topics in aggregated form for public usage. For the descriptive
analyses within this review, data is used from all EUROSTUDENT VII countries that
provided data (and enough cases) on the relevant aspects (before July 2021): Austria,
Czech Republic, Denmark, Estonia, Finland, Georgia, Croatia, Hungary, Ireland, Iceland,
Lithuania, Luxembourg, Malta, Netherlands, Norway, Poland, Portugal, Romania,
Sweden, Switzerland, Slovenia and Turkey. One needs to be aware that data from
several countries may have been affected by the effects of the COVID-19 pandemic.
Portugal, Romania and Turkey collected data in 2020 and 2021 (reference period during
COVID-19 pandemic).
10Micro data EUROSTUDENT VII
A major innovation in EUROSTUDENT VII is the collection of cross-national microdata,
which allows in-depth multivariate analyses on a variety of topics on the social
dimension of European higher education. For the micro data analyses, we make use
of the Eurostudent VII Scientific Use File (Cuppen et al., 2021). At the point of writing,
13 out of 26 participating countries have completed their micro data preparation, and
more countries are following. The following countries are included in our multivariate
analyses on the micro data: Austria, Croatia, Denmark, Estonia, Finland, Georgia,
Hungary, Ireland, Lithuania, Luxembourg, Netherlands, Poland and Slovenia. Fieldwork
was completed in these countries in 2019. The dataset comprises 134,255 respondents.
Operationalisation
To measure both dimensions of social integration, four items were used within the
questionnaire of the EUROSTUDENT project. In line with Tinto’s theory (1975), the first
two items focus on students’ interactions with their peers, while the others on how well
they are integrated concerning lecturers. The items we used are adopted from the NEPS
study (Dahm et al., 2016). Regarding fellow students, students were asked to indicate
to what extent they agree with the following statements (five-point Likert Scale with
the higher the score, the more the student agrees with the statement):
“I know a lot of fellow students with whom I can discuss subject-related questions”
“I have contact with many students in my current study programme”
The average of these two items was taken to construct a measure for social integration
related to fellow students (Cronbach’s alpha of 0.82). Regarding lecturers, the students
were presented the following statements:
“I get along well with lecturers in my current study programme”
“Lecturers are interested in what I have to say”
Again, the scores on the two items were averaged (Cronbach’s alpha of 0.77). Higher
scores indicate a stronger sense of social integration with lecturers or fellow students.
Whether and to what extent different factors relate to students’ social integration, and
whether these relationships vary across countries is examined with the micro data.
11Of main interest is the relation between parental educational background, parental
financial situation (i.e. parental socio-economic background), time spent on work and
study intensity with a student’s level of social integration with (fellow) students and
lecturers. Parental educational background was measured as the highest educational
attainment of one of the parents and was coded into three categories: ‘Low’ (ISCED
0-2), ‘Medium’ (ISCED 3-5) and ‘High’ (ISCED 6-8). Parental financial situation was
measured with the following question which originates from the PIRLS survey (2006):
“How well-off financially do you think are your parents (or guardians) compared with
other families?”. The answers were recoded into three categories: “Not very or not
at all well-off”, “Averagely well-off” and “Somewhat or very well-off”. Time spent on
work was measured by asking students how many hours they spend on their paid job(s)
during a typical week in their lecture period. The answers in hours were recoded into
the following three categories: “Low” (0 hours), “Medium” (1–20 hours) and “High”
(> 20 hours). Study intensity was measured in weekly hours spent on taught studies/
lectures, personal study time and study related activities. It was then recoded into
three categories: “Low intensity” (0–20 hours), “Medium intensity” (> 20–40 hours)
and “High intensity” (> 40 hours).
For the analyses, we also included the following control variables: gender, age,
migration background, delayed transition into HE, the type of higher education, being
a first-year student, students’ living situation, financial dependency and field of
study. Gender was coded (0) for males and (1) for females. Age was measured in four
categories: “up to 21 years”, “22 to < 25 years”, “25 to < 30 years” and “30 years
or over”. Migration background indicates whether at least one of the parents was
born abroad. Delayed transition into HE indicates whether students went into higher
education within two years after leaving school (0), or with a delay of more than two
years (1). HEI type measured whether students attended a university (0) or a non-
university type (e.g. a university of applied sciences) (1). First-year student indicated
whether the respondent was a first-year student (1) or not (0) at the time of the survey.
Students’ living situation was divided into three categories: “Living with parents”,
“Living away from parents (but not in a student residence)” and “Living in a student
residence”. Financial dependency indicated whether students were more than 50%
dependent on: self-earned income (i.e. themselves), family or other financial sources of
income 2. Field of study included the following ten categories: “Education”, “Arts and
humanities”, “Social Sciences, journalism and information”, “Business, administration
and law”, “Natural sciences, mathematics and statistics”, “ICTs”, “Engineering,
12manufacturing and construction”, “Agriculture, forestry, fisheries and veterinary”,
“Health and welfare” and “Services”. For the sake of a better readability of the models
and figures, some variable names are shortened in the sections below.
2. ‘Other financial sources of income’ include financial support from the (non-)university, support
from another country (e.g. grants, scholarships, loans), savings used for living/studying during
the current lecture period, other income from public sources (e.g. housing benefits, child benefits),
repayable income from private sources (e.g. loans) or non-repayable income from private sources
(e.g. alimony, property, income from capital, private scholarships).
133
Descriptive findings
To get a first impression of students’ level of social integration in the different
EUROSTUDENT countries, the countries’ aggregated data is compared along the four
different integration items (Figure 1). While, on average (light grey), all four items
ranked rather high with values of about 4, taking a closer look, one can see slight
differences between the four items and between the countries.
The Czech Republic, Croatia and Sweden are the countries where students most often
know fellow students to discuss subject-related questions (all scores of 4.0) while
Georgia ranks lowest, together with Portugal (both 3.5). When it comes to contact with
peers, the Czech Republic, Ireland and Sweden (all 3.9) score the highest and Portugal
(3.3), Austria and Finland (both 3.4), the lowest.
“Getting along well with lecturers” is the item that scored the highest amongst all
students. Especially in the Czech Republic, Iceland (both 4.4) and Lithuania (4.3),
students seem to get along especially well with their teaching staff, while in Georgia
(3.5) this seems to be the case less often. When it comes to the question of whether
lecturers are interested in what students have to say, slightly fewer students agree
overall. Comparing the two items on lecturers, one can see that for students of all
countries, getting along with their lecturers does not automatically mean feeling heard
by them. Especially in the Czech Republic and Lithuania, the differences between the
two items on lecturers are striking. Icelandic students are again those who rate the
item relatively high (4.3), and Georgian (3.5) and Polish students (3.4) rather low.
143.9 4.4 4.0 4.2 4.2 3.5 4.0 4.0 4.0 4.0 4.4 4.3 3.9 4.1 4.0 4.0 3.9 3.8 4.0 4.1 4.2 3.9 4.0
1.0 AT CZ DK EE FI GE HR HU CH IE IS LT LU MT NL NO PL PT RO SE SI TR AV
AT CZ DK EE FI GE HR HU CH IE IS LT LU MT NL NO PL PT RO SE SI TR AV
Lecturers interested in what student has to say
Lecturers interested in what student has to say
5.0
5.0
4.0
4.0
3.0
3.0
2.0
FIGU 3.5
2.0
1.0
RE
3.5
1 3.53.5| CO
3.8 U NT
3.8
3.7 RY 3.7
3.7
CO M3.53.5
3.7
PARI3.63.6SO N3.53.5
: FO 3.6
UR
3.6
I T3.73.7E M S4.14.1O F 3.63.6SO C I3.73.7AL I3.93.9
N T EGRATION
3.8
3.8
3.7
3.7
3.4
3.4
3.6
3.6
3.7
3.7
3.8
3.8
3.6
3.6
3.6
3.6
3.7
3.7
1.0 AT CZ DK EE FI GE HR HU CH IE IS LT LU MT NL NO PL PT RO SE SI TR AV
AT CZ DK EE FI GE HR HU CH IE IS LT LU MT NL NO PL PT RO SE SI TR AV
Knowsaalotlotofoffellow
Knows fellowstudents
students to discuss
to discuss subject-related
subject-related questions
questions
Knows a lot of fellow students to discuss subject-related questions
5.0
5.0
4.0
4.0
3.0
3.0
2.0
2.0 3.8 4.0 3.8 3.7 3.7 3.5 4.0 3.9 3.8 3.9 3.9 3.8 3.8 3.9 3.9 3.8 3.7 3.5 3.8 4.0 3.9 3.6 3.8
1.0 3.8 4.0 3.8 3.7 3.7 3.5 4.0 3.9 3.8 3.9 3.9 3.8 3.8 3.9 3.9 3.8 3.7 3.5 3.8 4.0 3.9 3.6 3.8
1.0 AT CZ DK EE FI GE HR HU CH IE IS LT LU MT NL NO PL PT RO SE SI TR AV
AT CZ DK EE FI GE HR HU CH IE IS LT LU MT NL NO PL PT RO SE SI TR AV
Contact with many students in study programme
Contact withmany
Contact with manystudents
studentsin in study
study programme
programme
5.0
5.0
4.0
4.0
3.0
3.0
2.0
2.0 3.4 3.9 3.5 3.6 3.4 3.5 3.8 3.7 3.7 3.9 3.5 3.7 3.7 3.8 3.5 3.5 3.8 3.3 3.6 3.9 3.8 3.7 3.7
1.0 3.4 3.9 3.5 3.6 3.4 3.5 3.8 3.7 3.7 3.9 3.5 3.7 3.7 3.8 3.5 3.5 3.8 3.3 3.6 3.9 3.8 3.7 3.7
1.0 AT CZ DK EE FI GE HR HU CH IE IS LT LU MT NL NO PL PT RO SE SI TR AV
AT CZ DK EE FI GE HR HU CH IE IS LT LU MT NL NO PL PT RO SE SI TR AV
Get along
Get alongwell
wellwith
withlecturers
lecturers
5.0 Get along well with lecturers
5.0
4.0
4.0
3.0
3.0
2.0
3.9 4.4 4.0 4.2 4.2 3.5 4.0 4.0 4.0 4.0 4.4 4.3 3.9 4.1 4.0 4.0 3.9 3.8 4.0 4.1 4.2 3.9 4.0
2.0
1.0
3.9
AT 4.4
CZ 4.0
DK 4.2
EE 4.2
FI 3.5
GE 4.0
HR 4.0
HU 4.0
CH 4.0
IE 4.4
IS 4.3
LT 3.9
LU 4.1
MT 4.0
NL 4.0
NO 3.9
PL 3.8
PT 4.0
RO 4.1
SE 4.2
SI 3.9
TR 4.0
AV
1.0
AT CZ DK EE FI GE HR HU CH IE IS LT LU MT NL NO PL PT RO SE SI TR AV
Lecturers interested in what student has to say
5.0 Lecturers interestedin inwhat
Lecturers interested what student
student hashas to say
to say
5.0
4.0
4.0
3.0
3.0
2.0
3.5 3.5 3.8 3.7 3.7 3.5 3.6 3.5 3.6 3.7 4.1 3.6 3.7 3.9 3.8 3.7 3.4 3.6 3.7 3.8 3.6 3.6 3.7
2.0
1.0
3.5
AT 3.5
CZ 3.8
DK 3.7
EE 3.7
FI 3.5
GE 3.6
HR 3.5
HU 3.6
CH 3.7
IE 4.1
IS 3.6
LT 3.7
LU 3.9
MT 3.8
NL 3.7
NO 3.4
PL 3.6
PT 3.7
RO 3.8
SE 3.6
SI 3.6
TR 3.7
AV
1.0
AT CZ DK EE FI GE HR HU CH IE IS LT LU MT NL NO PL PT RO SE SI TR AV
Knows a lot of fellow students to discuss subject-related questions
5.0 Knows a lot of fellow students to discuss subject-related questions
Source: EUROSTUDENT VII Aggregated Data (2021) ]
[ 4.0
5.0
4.0
3.0
3.0
2.0
3.8 4.0 3.8 3.7 3.7 3.5 4.0 3.9 3.8 3.9 3.9 3.8 3.8 3.9 3.9 3.8 3.7 3.5 3.8 4.0 3.9 3.6 3.8
2.0
1.0
3.8
AT 4.0
CZ 3.8
DK 3.7
EE 3.7
FI 3.5
GE 4.0
HR 3.9
HU 3.8
CH 3.9
IE 3.9
IS 3.8
LT 3.8
LU 3.9
MT 3.9
NL 3.8
NO 3.7
PL 3.5
PT 3.8
RO 4.0
SE 3.9
SI 3.6
TR 3.8
AV
1.0
AT CZ DK EE FI GE HR HU CH IE IS LT LU MT NL NO PL PT RO SE SI TR AV
Figure
Contact 2
withshows the
many students relationship
in study programme between the two different aspects of social integration
Contact with many students in study programme
concerning: a) students’ peers (x-axis), and b) lecturers (y-axis). Students in most
5.0
5.0
4.0
4.0
of the countries rate integration with their lecturers higher than with their peers
3.0
3.0
2.0
3.4 3.9 3.5 3.6 3.4 3.5 3.8 3.7 3.7 3.9 3.5 3.7 3.7 3.8 3.5 3.5 3.8 3.3 3.6 3.9 3.8 3.7 3.7
2.0
(countries above the line), particularly those in Iceland. The opposite only holds true
1.0
3.4
AT 3.9
CZ 3.5
DK 3.6
EE 3.4
FI 3.5
GE 3.8
HR 3.7
HU 3.7
CH 3.9
IE 3.5
IS 3.7
LT 3.7
LU 3.8
MT 3.5
NL 3.5
NO 3.8
PL 3.3
PT 3.6
RO 3.9
SE 3.8
SI 3.7
TR 3.7
AV
1.0
AT CZ DK EE FI GE HR HU CH IE IS LT LU MT NL NO PL PT RO SE SI TR AV
for Poland, Croatia, Ireland, the Czech Republic and Georgia.
15FIGU RE 2 | SO CIAL INT EGRAT I O N CO N C E RN I N G L ECT URE RS & ST UD E N TS
4.3
IS
4.2
4.1
4.0
MT SE
EE
FI LT
Integration: lecturers
CZ
3.9 DK
NL SI
AV
LU
NO RO IE
3.8 CH
TR HU HR
AT
3.7
PT PL
3.6
GE
3.5
3.4
3.4 3.5 3.6 3.7 3.8 3.9 4.0 4.1 4.2 4.3
Integration: students
[ Source: EUROSTUDENT VII Aggregated Data (2021) ]
Differences in social integration between student groups
Differences in social integration between different student groups are investigated by
analysing an index of all four social integration items.
Demographic background
Second generation migrants who were domestically educated are, in general, neither
better nor worse integrated than the average; the same holds true for older students
and female students (all 3.8). However, looking at the different countries, one can see
that second generation migrants in Romania who were domestically educated are a bit
better integrated than the national average, while the opposite is true in Luxembourg.
In Georgia, Ireland, Lithuania, Poland, Romania, Slovenia and Turkey, older students
16are better integrated than others. In the other countries, this group rates just slightly
above or below the average of other students there. There seem to be no differences in
social integration regarding gender in the individual countries.
FIGU RE 3 | SO CIAL INT EGRAT I O N O F D I F F E RE N T GRO UP S : D E M O GRA P H IC BACKG ROU N D
5,0
4,0
3,0
2,0
1,0
AT CZ DK EE FI GE HR HU CH IE IS LT LU MT NL NO PL PT RO SE SI TR AV
5,0
all students 2nd generation migrants, domestically educated 30 years and older female
4,0
Source: EUROSTUDENT VII Aggregated Data (2021) ]
[ 3,0
Note:
2,0 No data available for SE: 2nd generation migrants, domestically educated.
1,0
AT CZ DK EE FI GE HR HU CH IE IS LT LU MT NL NO PL PT RO SE SI TR AV
Social background
5,0
Students whose parents did not attain tertiary education do not differ drastically in
4,0
terms of their social integration in higher education. However, when it comes to their
5,0
3,0
financial background, students coming from families that are not at all well-off are, in
4,0
2,0
general, slightly less well integrated.
3,0
1,0
AT CZ DK EE FI GE HR HU CH IE IS LT LU MT NL NO PL PT RO SE SI TR AV
2,0
5,0
FIGU
1,0
RE 4CZ | DKSO CIEEAL INT
AT FI EGRAT
GE IHRO N OHUF DCHI F F E IERE N TIS GROLTUP SLU: SOMTC I ALNL BACKG
NO ROU
PL N PTD RO SE SI TR AV
4,0
5,0
3,0
4,0
2,0
3,0
1,0
AT CZ DK EE FI GE HR HU CH IE IS LT LU MT NL NO PL PT RO SE SI TR AV
2,0
1,0
AT CZ DK EE FI GE HR HU CH IE IS LT LU MT NL NO PL PT RO SE SI TR AV
5,0
all students parents without tertiary education family not at all well-off
4,0
Source: EUROSTUDENT VII Aggregated Data (2021) ]
[ 3,0
Note:
2,0 No data available for CH: not at all well-off.
1,0
AT CZ DK EE FI GE HR HU CH IE IS LT LU MT NL NO PL PT RO SE SI TR AV
5,0
4,0
3,0
2,0
1,0
AT CZ DK EE FI GE HR HU CH IE IS LT LU MT NL NO PL PT RO SE SI TR AV
175,0
4,0
3,0
Living conditions
2,0
Students with low study intensity are overall slightly less integrated than their peers.
1,0
AT CZ DK EE FI GE HR HU CH IE IS LT LU MT NL NO PL PT RO SE SI TR AV
Neither working more than 20 hours a week nor being dependent on self-earned
5,0
income makes a big difference for students’ integration in any of the countries. Only
4,0
those living in student accommodation in Georgia are less socially integrated.
3,0
2,0
FIGU
1,0
RE 5 | SO CI AL INT EGRAT I O N O F D I F F E RE N T GRO UP S : L I V I N G CO N DITION S
AT CZ DK EE FI GE HR HU CH IE IS LT LU MT NL NO PL PT RO SE SI TR AV
5,0
4,0
3,0
2,0
5,0
1,0
AT CZ DK EE FI GE HR HU CH IE IS LT LU MT NL NO PL PT RO SE SI TR AV
4,0
5,0
3,0
all students low intensity students students depent on self-earned income students with paid job >20h/week
students living in a student accommodation
4,0
2,0
3,0
1,0
[ Source:
AT
EUROSTUDENT
CZ DK EE
VII Aggregated
FI GE
DataHU(2021)
HR CH
] IE IS LT LU MT NL NO PL PT RO SE SI TR AV
2,0
Note:
5,0 No data available for LU & DK: students dependent on self-earned income; MT: students living in student accommodation.
1,0
AT CZ DK EE FI GE HR HU CH IE IS LT LU MT NL NO PL PT RO SE SI TR AV
4,0
Study conditions
3,0
Overall, students from universities who start studying at university later and those in
2,0
their first year do not differ to their peers in terms of their social integration. However,
1,0
AT CZ DK EE FI GE HR HU CH IE IS LT LU MT NL NO PL PT RO SE SI TR AV
taking a closer look at the countries’ individual scores, one can see that in Luxembourg,
5,0
students with delayed transition to higher education are less socially integrated than
4,0
the country’s average, while the opposite is the case in Poland and Romania.
3,0
2,0
FIGU
1,0
RE 6CZ | DKSO CIEEAL INT
AT FI EGRAT
GE IHRO N OHUF DCHI F F E IERE N TIS GROLTUP SLU: STMTUDY NLCONNODITION
PL S PT RO SE SI TR AV
5,0
4,0
3,0
2,0
1,0
AT CZ DK EE FI GE HR HU CH IE IS LT LU MT NL NO PL PT RO SE SI TR AV
all students university students students with delayed transition students in their first year of studying in higher education
[ Source: EUROSTUDENT VII Aggregated Data (2021) ]
184
Multivariate results
In order to answer our research questions, we conduct multivariate multilevel models
on the micro data from EUROSTUDENT VII. More specifically, we examine the role of
the parental educational background, parental financial situation, time spent on work
and study intensity in students’ level of social integration with (fellow) students and
lecturers. In addition, we are also interested in the extent to which these relationships
may differ across countries.
Students’ level of social integration is examined with regards to their fellow students
on the one hand, and their lecturers on the other hand. As is shown in Chapter 3, the
majority of students (across all countries) feel well socially integrated with fellow
students and lecturers. As a result, the distribution of the two measurements is highly
skewed. We therefore turn to logistic two-level multilevel models, where individuals
(level 1) are nested within countries (level 2). In these models, we accounted for the
influence of gender, age, migration background, delayed transition into HE, the type
of higher education, being a first-year student, students’ living situation, financial
dependency and field of study. After we excluded missing values for all variables
through listwise deletion, the sample of the micro data was reduced to 124,695
respondents across 13 countries.
General findings
First, we are interested in the extent to which students’ level of social integration
varies between countries. The extent to which students’ level of social integration
(regarding both teachers and students) is explained by differences between countries,
is very low: around 1%3. In other words, the level of social integration does not seem
to differ that much between countries. However, countries can still show different
patterns in, for instance, the role of parental educational background and parental
financial situation in the level of social integration with fellow students and lecturers.
3. ICCstudents= 0.7%; ICClecturers= 1.2% (Ncountries=13; Nindividuals=124,695).
19In order to examine possible different patterns in these relations across countries,
we thus ran multivariate logistic models. First, we show the general findings (or the
average relationships) across all 13 countries. In the next section, we present the
findings per country (i.e. country-specific findings).
Social integration with fellow students
Figure 7 illustrates the findings of the full model on social integration with fellow
students, including all independent variables (for an overview of the models, see
Table 1 in the Appendix). Each Exp(B) of the model is depicted by a separate bar.
Positive statistical effects are shown as green bars, whereas negative effects are
shown as red bars. Note that only dark-coloured bars indicate significant effects
(p < 0.05), while light-coloured bars indicate non-significant effects.
Starting off with parental educational background, Figure 7 demonstrates that there
is no significant relation between parents’ educational attainment and students’ level
of social integration with their fellow students when controlling for other factors (see
Appendix). Contrary to expectations, we do not find that students with parents with
higher educational attainment feel more socially integrated (with other students).
However, this model presents the average effect across all 13 countries. A possible
explanation for this unexpected finding is that this relation varies across countries.
The next section focuses on differences between countries.
Next, turning to the role of parents’ financial situations, we found that students with
parents who are not (at all) well-off feel less socially integrated compared to students
with parents who are averagely well-off. Consequently, students with very
well-off parents, feel more socially integrated with fellow students. This is in line with
findings from previous research (Ahn & Davis, 2020).
Regarding time spent on work, Figure 7 provides no evidence that time spent working
is negatively related to students’ integration with fellow students. In fact, students
who spend more time working, feel more socially integrated with their fellow students.
This indicates that there is no trade-off; time spent on work does not seem to conflict
with being able to socially integrate with fellow students. Another explanation for
this finding may be that students often have (side) jobs in sectors where many other
students work as well, for example in catering, pubs, coffee shops or on campus. Also
with regard to students’ study intensity, we found a positive and significant relation.
20Students who indicate a medium or high study intensity feel more socially integrated
with other students than those who indicate that their study intensity is low.
Across the EUROSTUDENT countries, we found that some student groups feel more or
less socially integrated with their fellow students. On average (across all countries),
the following groups feel significantly less socially integrated with fellow students (for
models, see Table 1 in the Appendix):
• Female students
• Older students, especially those older than 30 years
• Students with a migration background (i.e. at least one of the parents
is born abroad)
• International students
• Students in the field of business (vs. all other fields of study)
In contrast, the following groups of students feel, on average, more socially integrated
with other students:
• Delayed transition students (i.e. students who entered HE with a delay of more
than two years after leaving school)
• Non-university students (vs. university students)
• First-year students
• Students who do not live with their parents and students living in dorms
(vs. students living in their parental home)
• Students who financially depend more on public funds (vs. those who
financially depend more on their own income/earnings)
21FIGU RE 7 | T WO -LEVEL LO GI ST I C REGRESS I O N O N SO C I AL I N T EGRATION W ITH STU DE N TS
(N CO U NTRIES =13; N IND IVID UA L S =124, 695 )
Gender: Female
Age: < 21
Age: 22 - 25 (ref.)
Age: 25 - 30
Age: 30 >
No migration background (ref.)
Migration background
International student
Lower parental education
Middle parental education (ref.)
Higher parental education
Parental financial situation: not well-off
Parental financial situation: average (ref.)
Parental financial situation: well-off
Delayed transition (ref.= Direct)
Non-university (ref.= University)
First year student (ref. = Later year student)
Living with parents (ref.)
Not living with parents
Living in dorm
Self dependent (ref.)
Depending on family
Depending on public sources
Depending on other sources
Working hours: low (ref.)
Working hours: medium
Working hours: high
Study intensity: low (ref.)
Study intensity: medium
Study intensity: high
Field: business (ref.)
Field: education
Field: arts and humanities
Field: social sciences
Field: natural sciences
Field: ICT
Field: engineering
Field: agriculture
Field: health
Field: services
0 1 2
[ Source: EUROSTUDENT VII Micro Data (Cuppen et al., 2021) ]
Note: Dark-coloured orange (negative) and turquoise (positive) bars indicate significant effects
(p < 0.05), while light-coloured bars indicate non-significant effects.
22Social integration with lecturers
Figure 8 demonstrates the findings of the full model on social integration with regards
to lecturers. First, we found an unexpected negative relationship between parental
educational background and students’ level of social integration with their lecturers.
Contrary to expectations, students with higher educated parents feel less socially
integrated with regard to their lecturers than those with medium educated parents.
However, and as mentioned earlier, this model presents average effects across all 13
countries. Again, the next section provides evidence that this relationship varies across
countries and addresses these national differences.
The relationship between the parents’ financial situation and students’ level of social
integration with lecturers is similar to integration with their fellow students: the more
well-off parents are, the more socially integrated students feel (with their lecturers).
This is in line with findings from previous research (Ahn & Davis, 2020).
Next, findings show that students who spend more time working feel less socially
integrated with their lecturers. However, this is only the case among those who
work a lot of hours (more than 20 hours a week). What is interesting is that there
seems to be a trade-off in feeling socially integrated with lecturers, but not with
other students. This underscores the importance of distinguishing social integration
between lecturers and students (i.e. groups of people one can feel a stronger sense
of social integration for). Turning to study intensity, we found that only students who
experience medium study intensity feel more socially integrated with their lecturers,
which is different from what we found for social integration with fellow students. With
regards to students, the higher the study intensity, the more students feel integrated
with their fellow students. However, regarding lecturers, only students who indicate
they have a medium study intensity, have stronger feelings of social integration with
their lecturers. An explanation might be that students with a low study intensity
feel less connected with lecturers, whereas students with high study intensity have
other reasons (such as uncertainty about study performance) why they feel less
integrated. Another explanation for the latter pattern is that their study intensity is
done (mostly) independently of their lecturers, in their own time, resulting in lower
social connectedness. However, more research is needed to empirically test these
assumptions.
23In the previous model we saw that some student groups feel a greater or lesser sense
of being socially integrated with fellow students. For being socially integrated with
lecturers, we also see differences among groups of students. On average (across all
countries), the following groups feel less socially integrated with lecturers (for models,
see Table 2 in the Appendix):
• Female students
• Older students, especially those older than 30 years
• Students with a migration background (i.e. at least one of the parents
is born abroad)
• Students in the field of business (vs. almost all other fields of study except
engineering and ICT)
In contrast, the following groups of students feel, on average, more socially integrated
with lecturers:
• Non-university students (vs. university students)
• First-year students
• Students who live in dorms (vs. those living at their parental home), so not all
students who live away from their parents
• Students who financially depend more on public funds or other financial resources 4
(vs. those who are more financially self-dependent)
4. ‘Other financial resources’: see footnote 2
24F IG URE 8 | TWO - L EVEL LOG I ST I C REG RESS I ON ON SOCI A L I NT EG RAT IO N W IT H L ECT UR ER S
(N CO U NTRIES = 1 3; N INDIVIDUALS =124, 695 )
Gender: Female
Age: < 21
Age: 22 - 25 (ref.)
Age: 25 - 30
Age: 30 >
No migration background (ref.)
Migration background
International student
Lower parental education
Middle parental education (ref.)
Higher parental education
Parental financial situation: not well-off
Parental financial situation: average (ref.)
Parental financial situation: well-off
Delayed transition (ref.= Direct)
Non-university (ref.= University)
First year student (ref. = Later year student)
Living with parents (ref.)
Not living with parents
Living in dorm
Self dependent (ref.)
Depending on family
Depending on public sources
Depending on other sources
Working hours: low (ref.)
Working hours: medium
Working hours: high
Study intensity: low (ref.)
Study intensity: medium
Study intensity: high
Field: business (ref.)
Field: education
Field: arts and humanities
Field: social sciences
Field: natural sciences
Field: ICT
Field: engineering
Field: agriculture
Field: health
Field: services
0 1 2
[ Source: EUROSTUDENT VII Micro Data (Cuppen et al., 2021) ]
Note: Dark-coloured orange (negative) and turquoise (positive) bars indicate significant effects (p < 0.05), while light-coloured
bars indicate non-significant effects.
25Country differences in social integration
Now that we have discussed the average (fixed) effects across all countries, the
following section focuses on differences between countries for our three main topics
of interest, namely the relationship of (1) students’ socio-economic background, (2)
time spent on work, and (3) their study intensity, with regard to students’ level of
social integration with other students and lecturers. We ran logistic multivariate models
including all independent variables for each country separately. In the graphs, we only
show (and discuss) the parameters of socio-economic background and time spent on
work and study intensity. The statistical models are similar to the models previously
described.
Socio-economic background: social integration with fellow students
Starting off with social integration with fellow students, we see different patterns
across countries with regards to the role of the parental financial situation (see
Figure 9). In nine out of 13 countries, students with parents who are not (at all)
well-off feel less socially integrated with other students compared to students that
are averagely well-off. Only Luxembourg stands out, where students with not (at all)
well-off parents actually feel more socially integrated with their fellow students. The
three remaining countries (Hungary, the Netherlands and Slovenia) show no significant
difference between these groups. Next, in ten out of 13 countries, students with
parents who are well-off feel more socially integrated with other students than their
counterparts who are averagely well-off. Apart from a few differences, most countries
show similar patterns in that students whose parents are more well-off feel more
socially integrated than students that are less well-off.
Next, the average effect of parental educational background on social integration with
other students is not significant. When looking at the country patterns, we do find a
positive relationship in Denmark. Here, students with highly educated parents feel
more socially integrated with their fellow students than students with parents who
have an average educational attainment. All in all, parental educational background
seems to have a very limited effect when other variables are taken into account.
26F IG URE 9 | LOGISTIC MU LT I VA RI AT E REG RESS I ONS P E R COU NT RY: EF F ECTS O F ST UDEN TS’ SO C IO -
ECON OMI C BACKGROUND ON SOCI A L I NT EG RAT I ON WI T H FE LLOW ST U DEN TS
AT DK EE FI
Parental financial situation: not well-off
Parental financial situation: average (ref.)
Parental financial situation: well-off
Lower parental education
Middle parental education (ref.)
Higher parental education
GE HR HU IE
Parental financial situation: not well-off
Parental financial situation: average (ref.)
Parental financial situation: well-off
Lower parental education
Middle parental education (ref.)
Higher parental education
LT LU NL PL
Parental financial situation: not well-off
Parental financial situation: average (ref.)
Parental financial situation: well-off
Lower parental education
Middle parental education (ref.)
Higher parental education
0 1 2 0 1 2 0 1 2
SI
Parental financial situation: not well-off
Parental financial situation: average (ref.)
Parental financial situation: well-off
Lower parental education
Middle parental education (ref.)
Higher parental education
0 1 2
[ Source: EUROSTUDENT VII Micro Data (Cuppen et al., 2021) ]
Note: Dark-coloured orange (negative) and turquoise (positive) bars indicate significant effects (p < 0.05), while light-coloured
bars indicate non-significant effects.
27Socio-economic background: social integration with lecturers
The relationship between students’ socio-economic background and their level of social
integration with lecturers also varies across countries (see Figure 10). In the majority
of the countries (eight out of 13), students with parents who are not (at all) well-off
feel less integrated with their lecturers compared to averagely well-off students.
Significant differences between students of parents who are well-off versus averagely
well-off are only found in Austria, Hungary, the Netherlands and Poland. Thus, in most
countries, students who are not well-off run the risk of feeling less socially integrated
with lecturers.
The role of parental educational background is more diffuse. In no single country do
students with higher educated parents feel more socially integrated with lecturers
than students with medium educated parents. In fact, these students feel less socially
integrated with lecturers in Austria, Finland, Hungary, Lithuania and Poland. With
regards to students with lower educated parents (vs. students with medium educated
parents), students feel more socially integrated with their lecturers in Hungary,
Lithuania and Slovenia; however, this group feels less integrated with lecturers in the
Netherlands. An important conclusion we draw from this is that future research should
be careful in overgeneralising the positive relation between parental educational
background and social integration in higher education with both students and lecturers,
as this may differ between countries but may also weaken or prove insignificant if
confounding factors are (sufficiently) accounted for in the models. Another possible
explanation is that different groups of students have different expectations. For
instance, students with higher educated parents may have higher expectations and may
then be disappointed if these expectations are not met.
28F IG URE 1 0 | LO GI STIC MU LT I VA RI AT E REG RESS I ONS P E R COU NT RY: EF F ECTS O F ST UDEN TS’ SO C IO -
ECON OMI C BACKGROUND ON SOCI A L I NT EG RAT I ON WI T H LECT U RE RS
AT DK EE FI
Parental financial situation: not well-off
Parental financial situation: average (ref.)
Parental financial situation: well-off
Lower parental education
Middle parental education (ref.)
Higher parental education
GE HR HU IE
Parental financial situation: not well-off
Parental financial situation: average (ref.)
Parental financial situation: well-off
Lower parental education
Middle parental education (ref.)
Higher parental education
LT LU NL PL
Parental financial situation: not well-off
Parental financial situation: average (ref.)
Parental financial situation: well-off
Lower parental education
Middle parental education (ref.)
Higher parental education
0 1 2 3 0 1 2 3 0 1 2 3
SI
Parental financial situation: not well-off
Parental financial situation: average (ref.)
Parental financial situation: well-off
Lower parental education
Middle parental education (ref.)
Higher parental education
0 1 2 3
[ Source: EUROSTUDENT VII Micro Data (Cuppen et al., 2021) ]
Note: Dark-coloured orange (negative) and turquoise (positive) bars indicate significant effects (p < 0.05), while light-coloured
bars indicate non-significant effects.
29Study intensity and time spent on work: social integration with fellow students
Earlier findings showed that, on average (across all countries), both time spent on work
and study intensity are positively related to students’ level of social integration with
fellow students. Figure 11 shows how study intensity relates to students’ level of social
integration with fellow students in each country separately. For all countries, except
for Georgia, we see a similar relation: the higher the study intensity, the higher the
probability that students indicate that they feel socially integrated with their fellow
students.
Next, the relation between the number of working hours is much more diverse between
countries. For four countries (Austria, Finland, Lithuania and Luxembourg), students
who indicate that they spend a medium or high amount of time on work (or both in
the case of Finland) also indicate being more socially integrated with fellow students,
compared to students who spend a low amount of time on their job. The opposite is
found in Georgia. Here, students feel less socially integrated with their fellow students
the more time they spend on working (medium or a high amount of time). We also found
this also to be the case among Danish students, but only among those who indicate to
spend a high amount of time working (i.e. more than 20 hours a week). In the remaining
seven countries (i.e. Estonia, Croatia, Hungary, Ireland, the Netherlands, Poland and
Slovenia) no significant effects are found for time spent working and social integration
with fellow students when controlling for all other variables.
30F IG URE 1 1 | LO GI STIC MU LT I VA RI AT E REG RESS I ONS P E R COU NT RY: EF F ECTS O F ST UDEN TS’ T IM E
SPENT O N WORK AN D ST U DY I NT E NS I T Y ON SOCI A L I NT EG RAT I ON WI T H F EL LOW ST UDEN TS
AT DK EE FI
Study intensity: low (ref.)
Study intensity: medium
Study intensity: high
Working hours: low (ref.)
Working hours: medium
Working hours: high
GE HR HU IE
Study intensity: low (ref.)
Study intensity: medium
Study intensity: high
Working hours: low (ref.)
Working hours: medium
Working hours: high
LT LU NL PL
Study intensity: low (ref.)
Study intensity: medium
Study intensity: high
Working hours: low (ref.)
Working hours: medium
Working hours: high
0 1 2 3 0 1 2 3 0 1 2 3
SI
Study intensity: low (ref.)
Study intensity: medium
Study intensity: high
Working hours: low (ref.)
Working hours: medium
Working hours: high
0 1 2 3
[ Source: EUROSTUDENT VII Micro Data (Cuppen et al., 2021) ]
Note: Dark-coloured orange (negative) and turquoise (positive) bars indicate significant effects (p < 0.05), while light-coloured
bars indicate non-significant effects.
31Study intensity and time spent on work: social integration with lecturers
Regarding students’ level of social integration with their lecturers, the findings in the
previous section showed that, on average, a medium study intensity is associated
more with feeling more socially integrated with lecturers, whereas a high amount of
time spent on working is associated with a lesser sense of feeling socially integrated
with lecturers. Figure 12 shows different patterns across countries with regards to the
role of study intensity. In four out of 13 countries (Austria, Denmark, Finland and the
Netherlands), a medium study intensity is related to a higher level of social integration
with lecturers. Interestingly, a high study intensity is associated with feeling less
socially integrated with lecturers in Slovenia. In the remaining countries (a total of
seven), no significant relation is found.
Next, Figure 12 shows a negative relation between time spent on work and social
integration with lecturers in seven out of 13 countries. This is especially the case
among students who spend a high amount of time working. Only in the Netherlands
do students who spend a medium amount of time working feel slightly more socially
integrated with lecturers compared to students who spend a low amount of time on
work. Lastly, no significant relationship is found in the remaining six countries.
32F IG URE 1 2 | LO GI STIC MU LT I VA RI AT E REG RESS I ONS P E R COU NT RY: EF F ECTS O F ST UDEN TS’ T IM E
SPENT O N WORK AN D ST U DY I NT E NS I T Y ON SOCI A L I NT EG RAT I ON WI T H L ECT UR ER S
AT DK EE FI
Study intensity: low (ref.)
Study intensity: medium
Study intensity: high
Working hours: low (ref.)
Working hours: medium
Working hours: high
GE HR HU IE
Study intensity: low (ref.)
Study intensity: medium
Study intensity: high
Working hours: low (ref.)
Working hours: medium
Working hours: high
LT LU NL PL
Study intensity: low (ref.)
Study intensity: medium
Study intensity: high
Working hours: low (ref.)
Working hours: medium
Working hours: high
0 1 2 0 1 2 0 1 2
SI
Study intensity: low (ref.)
Study intensity: medium
Study intensity: high
Working hours: low (ref.)
Working hours: medium
Working hours: high
0 1 2
[ Source: EUROSTUDENT VII Micro Data (Cuppen et al., 2021) ]
Note. Dark-colored orange (negative) and turquoise (positive) bars indicate significant effects (p < 0.05), while light-colored bars
indicate non-significant effects.
335
Summary and discussion
In summary, the descriptive analyses shows that students generally feel relatively
well socially integrated, with values above the midpoint of the scale for all four
items (knowing fellow students to discuss subject-related questions, having contact
with other students, getting along well with lecturers and feeling that lecturers are
interested in what students have to say). Overall, feelings of integration are stronger
with regard to lecturers than with peers in most countries, with feeling heard by
lecturers being rated lower in all countries than getting along with them.
The descriptive analysis of differences between student groups based on their
demographic and social background and their living and study conditions highlights
that students’ families’ financial status plays a particular role: in all countries, students
from families that are not at all well-off report a lower level of social integration than
their peers from better-off families in all countries. Contrary to expectations, students
from different educational backgrounds do not differ in their assessment of their
integration – students with parents without tertiary education are socially not less
well integrated than others. With regard to demographic characteristics, no differences
between males and females were found, and no clear pattern according to migration
background or age emerged – in some countries, the latter two characteristics are
associated with a higher level of social integration; in others, the pattern is reversed.
With regard to living conditions, neither working more than 20 hours a week nor
being dependent on self-earned income makes an essential difference for students’
overall social integration, but students with low study intensities are slightly less well
integrated overall. Among study-related aspects, only a delayed transition into higher
education is associated with varying levels of social integration, but not in a clear way,
whereas the type of institution or progress in study (first year vs. later) does not make
a difference for overall social integration.
The multivariate models broadly confirm the overall findings but add some insights. As
in the descriptive analyses, somewhat surprisingly, the overall multivariate model does
not show a relationship between parents’ education and students’ social integration
with either fellow students or lecturers. However, in single country models, this effect
does prove to be significant – however, not necessarily in a way that could be expected.
34In Denmark, students’ with highly educated parents actually report feeling less well
integrated with their fellow students, and this unexpected relationship between
parental educational background and students’ level of social integration is also found
with regard to lecturers on average across all countries: students with higher educated
parents feel less socially integrated with regard to their lecturers than those with
medium educated parents. Analysis of country patterns shows that this is due to these
students feeling less socially integrated with lecturers in Austria, Finland, Hungary,
Lithuania and Poland.
Parental financial status, however, shows a clear effect in the expected direction in
the multivariate model: students with parents who are not (at all) well-off feel less
socially integrated compared to students with parents who are averagely well-off,
and vice versa, with regard to both lecturers and students. With a few exceptions,
these patterns are found in most countries. The models also confirm that students
who indicate a medium or high study intensity feel more socially integrated with other
students than those who indicate that their study intensity is low in all countries
but one. When it comes to lecturers, only students that experience medium study
intensity (not high) feel more socially integrated with their lecturers. With regard
to this factor, different factors appear to be at play. Furthermore, this effect can be
traced back to the respective pattern being present in only four countries (Austria,
Denmark, Finland and the Netherlands) – no significant effects are found in the
remaining countries. Finally, time spent on work is also apparently related differently
to students’ integration with students versus with lecturers: students who spend more
time working feel more socially integrated with their fellow students, indicating that
time spent on work does not seem to conflict with being able to socially integrate with
fellow students. Potentially, this is due to the fact that students often have (side) jobs
in sectors where many other students work as well, for example in catering, pubs,
coffee shops or on campus. Again, when looking at the country patterns, this effect
can be traced back to four countries (Austria, Finland, Lithuania and Luxembourg)
in which students who indicate that they spend a medium or high amount of time on
work (or both in the case of Finland) also report being more socially integrated with
fellow students, compared to students who spend a low amount of time on their job.
By contrast, on average, students who spend more time working (more than 20 hours
per week) feel less socially integrated with their lecturers. This negative relation
between time spent on work and social integration with lecturers is found in seven
out 13 countries. There is therefore a clear difference in the potential effects of time
35You can also read