What do we know about the effects of austerity? - American Economic ...
←
→
Page content transcription
If your browser does not render page correctly, please read the page content below
What do we know about the effects of austerity?
By A LESINA A., C.A. FAVERO AND F.G IAVAZZI
The literature on fiscal multipliers is far from first recorded by Giavazzi and Pagano (1990).
having reached an agreed upon conclusion about Second, we illustrate alternative theoretical ex-
their size (sometimes even their sign) and how planations for our findings about spending- ver-
they might be state contingent.1 There is sus tax-based consolidations and we discuss
much debate about this issue, so much so that which ones seem more appropriate in different
Eric Leeper defined this literature as “alchemy". cases.
One result, however, seems very robust: in
OECD economies fiscal consolidations (auster- I. Austerity: recent evidence
ity) based upon expenditure cuts are much less
A. Estimating the Macroeconomic Effects of
costly than those performed on the tax side.
Austerity
This result was originally shown by an early
literature which studied episodes of austerity be- As mentioned above, when legislatures decide
fore the financial crisis and the Great Reces- to launch a consolidation program, it rarely con-
sion characterized by (large) reductions in the sists of a budget lasting only one year. It is in-
cyclically adjusted government deficit. Alesina stead, typically, a multi-year policy package de-
and Ardagna (2010) summarized and extended signed to reduce the budget deficit by a certain
these results, which were then confirmed in IMF amount. The first decision is by how much the
(2010) and Guajardo et (2014) using a method- deficit should be reduced 3 ; then, and often af-
ology based upon the narrative method pio- ter much discussion, which taxes to increase and
neered by Romer and Romer (2010).2 which expenditure items to cut. This means that
The purpose of this paper is twofold. First we if the goal is to reduce the deficit by a certain
review more recent evidence based upon an ex- amount, spending cuts and tax increases are not
tension of the narrative method which consid- independent of each other since they must add
ers multi-year fiscal plans rather than year-by- up to a defined sum. In addition, some mea-
year shifts in fiscal variables, like in Romer and sures are announced long before they are car-
Romer (2010) and Guajardo et al.(2014). We ried out, while other are implemented immedi-
shall argue that analyzing multi-year plans is a ately. Thus the standard approach to evaluating
better way of studying the effects of fiscal pol- fiscal policy — which consists of assessing the
icy because in the real world governments typ- effects of year-by-year "isolated" shifts in taxes
ically adopt, and legislatures vote, multi-year or spending — overlooks two important points.
budget laws which have little resemblance to One is the multi-year nature of fiscal adjust-
isolated fiscal “shocks”. We will also docu- ments which affects the planning of consumers
ment cases of "expansionary austerity", namely and investors to the extent that their expectations
episodes in which even large reductions of gov- matter. The other is the interdependence of the
ernment spending were associated on impact decisions about how much to cut spending and
with increases in GDP growth – a possibility how much to raise taxes which cannot be as-
sumed to be independent of one another and thus
Alesina: Dept of Economics, Harvard Univer- cannot be studied in isolation. Finally, in order
sity,aalesina@harvard.edu, Favero: Dept.of Finance, Bocconi to measure the macroeconomic consequences of
University, carlo.favero@unibocconi.it, Giavazzi: Dept. of Eco- a fiscal adjustment plan one must use an empiri-
nomics, Bocconi University, francesco.giavazzi@unibocconi.it.
Acknowledgements
cal model which can track the effects of the vari-
1 For reviews of the literature on fiscal multipliers see Ramey ous measures (distinguishing between Expendi-
(2016) and Alesina, Favero and Giavazzi (forthcoming) chapt. 4.
2 Alesina and Ardagna (2013) show how the results by Gua- 3 In the case of EU countries this decision needs to be re-
jardo et al (2014) are in fact very similar to those by Alesina and viewed by the European Commission before being submitted to
Ardagna (2010). Parliament.
12 PAPERS AND PROCEEDINGS MONTH YEAR
ture Based (EB) and Taxed Based (TB) plans) salaries, education, health care, government in-
on macroeconomic variables. vestment, among other. We include transfers in
To construct fiscal consolidation plans 4 we g because, theoretically, we expect a cut in trans-
started from detailed information on the con- fers to be less distortionary than an increase in
solidations implemented by 16 OECD countries taxes – for instance transfers do not affect the
between 1978 and 2014. We address the po- marginal rate of substitution between consump-
tential endogeneity of shifts in fiscal variables tion and leisure. Our choice is supported by the
using the Romer and Romer (2010) “narrative” findings in Alesina et al 2017b who use a three-
approach later applied to the countries in our level disaggregation: tax-based plans, spending-
sample by Devries et al (2011) and extended by based plans and transfers-based plans. We clas-
Alesina et al (2015). The fiscal consolidation sify as taxes changes in direct taxes – e.g. in-
measures in the Devries et al dataset (both tax come, profits, capital gains and property taxes –
increases and spending cuts) are selected read- and indirect taxes – e.g. VAT, sales taxes, excise
ing the records available in official documents duties on goods, and stamp duties. We include
to identify the size, timing and principal mo- both changes in tax rates and measures designed
tivation for each fiscal action. They are “ex- to broaden the tax base.
ogenous” because their adoption was not mo- Fiscal plans consist of a sequence of actions
tivated by the state of the economic cycle but decided upon when a budget law is adopted, but
rather (i) were geared towards reducing an in- some implemented immediately, other to be im-
herited budget deficit or were meant to correct plemented in following periods. Plans are also
its long run trend, e.g. an increase in pension a mix of measures, some affecting government
outlays induced by population aging, or (ii) were expenditures, other affecting revenues. Typi-
motivated by reasons which are independent of cally legislatures start debating the overall size
the state of the business cycle, thus exclud- of an adjustment and then discuss its composi-
ing adjustments motivated by short-run counter- tion: by how much to cut spending (and which
cyclical concerns. We have extended the Devries programs) and by how much to raise taxes (and
et al dataset adding the consolidation measures which ones). The design of plans thus gener-
implemented between 2010 and 2014. In order ates inter-temporal and intra-temporal correla-
to construct fiscal plans we have analyzed and tions among fiscal variables. The inter-temporal
identified the legislative source of about 3500 correlation is the one between the announced
different fiscal measures adopted in these coun- (future) and the unanticipated (current) compo-
tries over our sample. This was necessary in or- nents of a plan. The intra-temporal correlation
der to use these measures to reconstruct fiscal is the one between the changes in revenues and
plans, for instance discriminating between mea- in spending that determine the composition of a
sures announced and measures immediately im- plan, given its size.
plemented. This disaggregation was not in the The exogenous fiscal measures selected in our
original Devries at al dataset. While doing this, narrative analysis are thus classified in three cat-
we double checked their classifications. For ex- egories: measures that were immediately imple-
ample we exclude the Netherlands, which is in- mented (“unexpected” measures), measures that
cluded in the D&al. sample, because the data were written in the legislation but whose im-
were not exogenous to the cycle by our defini- plementation was deferred (“announcements”)
tion. and measures that were implemented in a given
We distinguish between several categories of year but had been previously announced. We
fiscal measures. For the analysis in this paper, distinguish fiscal plans between those that are
however, we group measures in just two broad expenditure based (EB) and those that are tax
categories: spending, g, and taxes, . We clas- based (TB) by first summing all fiscal measures
sify as spending all measures related to gov- (unanticipated, implemented but previously an-
ernment spending and investment: current ex- nounced and announcements) and then labelling
penditure for goods and services, public sector a plan TB if the largest component of the fiscal
correction (measured as a fraction of GDP the
4 Our database on fiscal plans is available at year before the budget law is introduced) is an
www.igier.unibocconi.it/fiscalplans increase in taxes. Similarly for EB plans.VOL. VOL NO. ISSUE AUSTERITY 3
To be able to simulate over time the effect of a of about half of a percentage point relative to the
plan we need to construct "artificial" announce- average GDP growth of the country, which lasts
ments. We do so estimating the in-sample corre- less than two year. Moreover, if an EB austerity
lation between announcements and unexpected plan is launched when the economy is not in a
measures. Note that EB and TB plans are mu- recession, the output costs are zero on average.
tually exclusive and this gets around the prob- This average small downturns are the result of
lem posed by the intra-temporal correlation of cases of EB plans that were more recessionary
individual changes in g and in t Measuring the and others that were associated with almost im-
macroeconomic impact of a plan requires mod- mediate surges in output growth, that is "expan-
elling the relationship between plans and macro- sionary austerity". Cases of expansionary aus-
economic variables. This can be done either terity before the financial crisis include, amongst
through Moving Average projections of macro- other, Austria, Ireland, Belgium and Denmark in
economic variables on the different components the eighties, Spain and Canada in the nineties.
of a plan, or by embracing such components in On the other hand TB plans are associated with
a VAR which includes both macroeconomic and large and long lasting recessions. A TB plan
fiscal variables (see Favero and Giavazzi, 2012). worth one per cent of GDP is followed, on av-
The Moving Average approach has the advan- erage, by a two percent fall in GDP relative to
tage of being parsimonious; the VAR compen- its pre-austerity path. This large recessionary
sates the need for more degrees of freedom with effect lasts several years. We report in Figure
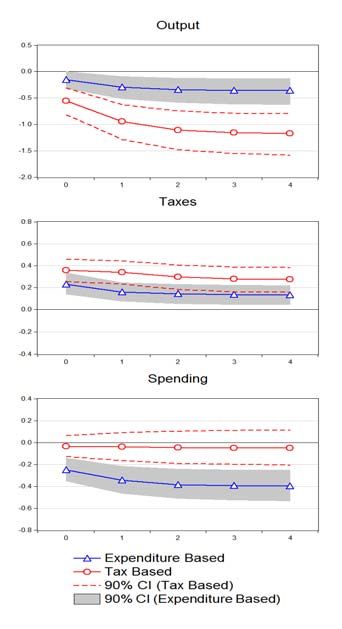
several advantages. First using a VAR which in- 1 the responses of output growth to an EB and
cludes changes in revenues and spending (as a TB plan worth one per cent of GDP as shown in
fraction of GDP) and tracks the impact of the Alesina et al (2017a) within a plan-augmented
narratively identified shifts in fiscal variables on multi-country panel VAR specification for three
total revenues and total spending allows us to variables: output growth, the change of tax rev-
check the strength of our narratively identified enues as a fraction of GDP and that of primary
instruments – for instance it allows us to ver- government spending, also as a fraction of GDP.
ify if, following a positive shift in taxes, rev- 2) The effects of reductions in entitlement
enues indeed increase. Second, in a VAR the es- programs and other government transfers are
timated coefficients on the narratively-identified very different from those of tax increases. They
shifts in fiscal variables measure the effect on are accompanied by mild and short lived down-
output growth of the component of such adjust- turns, probably because these cuts are perceived
ments that is orthogonal to lagged included vari- as permanent, leading to a lower expected tax
ables: thus the estimated multipliers are not af- burden. Thus the evidence suggests that trans-
fected by the possible predictability of plans on fers are not akin to negative taxes.
the basis of the lagged information included in 3) Amongst the components of private de-
the VAR. Finally, a VAR allows to compute mul- mand, investment growth responds very differ-
tipliers in two different ways: with respect to an ently following the introduction of the two types
initial fiscal impulse and with respect to the cu- of austerity plans. It responds positively to EB
mulated change in fiscal variables. plans and negatively to TB plans. Business con-
fidence behaves consistently with private invest-
B. Empirical results ment. Consumption, though, and also net ex-
Alesina Favero and Giavazzi (forthcoming) ports, on average do not differ during the two
uncover many strong regularities.5 types of adjustments.
1) There is a large and statistically significant 4) The recent episodes of austerity which oc-
difference between the effects on output of EB curred after the financial crisis, and started dur-
and TB austerity. EB fiscal consolidations have, ing a recession, were not significantly different
on average, been associated with a very small from previous cases. The sheer size of some of
downturn in output growth: a spending based these austerity plans was exceptional, not only
plan worth one percent of GDP implies a loss in Greece but also in Spain, Portugal, Ireland,
and to a lesser extent Italy and the UK. These
5 See also several papers by the same authors with co-authors episodes confirm the major asymmetry in the
Alesina et al (2015, 2016, 2107). effects of the two types of plans. Countries4 PAPERS AND PROCEEDINGS MONTH YEAR
F IGURE 1. T HE E FFECTS OF EB AND TB ADJUSTMENTS
Source: Alesina et al. (2017a)VOL. VOL NO. ISSUE AUSTERITY 5
that chose TB austerity suffered deeper reces- The most obvious candidate is monetary policy.
sions compared to those that decided to adopt In fact Guajardo et al (2014) argue that indeed
EB plans. Amongst the latter are Ireland, de- differences in the response of monetary pol-
spite a massive bank bailout program 6 and the icy are substantially responsible for these find-
UK, which posted a much more successful eco- ings. Alesina, Favero and Giavazzi (forthcom-
nomic performance than the IMF had predicted ing) show that only a small fraction of the het-
when the country announced its spending based erogeneous effects of EB and TB adjustments is
plan in 2010 (eventually the IMF apologized for related to monetary policy. They do so by run-
having severely criticized the UK government). ning a counterfactual simulation: they augment
5) Whether or not fiscal consolidations, on the baseline model including in the specifica-
both the tax side and the spending side, are tion a monetary policy indicator, the change in
more costly when started during an economic the short-term rate. They then compare the re-
downturn is a difficult point to discern. The an- sponse of output growth to EB and TB plans in
swer depends on a variety of issues regarding a baseline scenario, where monetary policy rates
the measurement of the dynamic pattern of the are allowed to respond to fiscal policy, and in a
economy before and during the adjustment (see counterfactual scenario where interest rates are
Auerbach and Gorodnichenko 2012, Ramey and constrained not to respond to shifts in fiscal vari-
Zubairy 2014). However, the asymmetry be- ables. The counterfactual simulation shows that
tween AB and TB based austerity is robust to the heterogeneous effect of TB and EB plans on
the adoption of a model that allows for different output is mitigated somewhat by the absence of a
effects of fiscal adjustment in an expansion and monetary policy response, but it remains highly
a downturn (Alesina et al 2017a). The only ex- significant.
ception is observed when the Zero Lower Bound A second and related possibility could be that
for monetary policy rate is also considered, al- the difference is explained by the behavior of the
though data from periods at the ZLB are still too exchange rate. Note that exchange rate move-
few to draw clear conclusions. ments during a fiscal plan are clearly endoge-
nous to it; but a devaluation prior to the intro-
II. What could explain these findings ?
duction of a plan may not be 7 and thus might ex-
How can we explain these results which are plain the lower output cost of EB plans. Alesina
empirically quite striking? We can think of at Favero and Giavazzi (forthcoming) show that
least four arguments which we now review in this is not the case. On average there is no
turn. systematic difference in the behavior of the ex-
change rate before fiscal adjustments based upon
A. Accompanying policies. tax increases or spending cuts. The authors ex-
clude from their sample all episodes of fiscal
One "theory" is that the difference between consolidation that are preceded by a devalua-
TB and EB programmes is simply due to a tion of at least three percent to at least 10 per-
systematic difference in accompanying policies. cent over the previous three years (which is ap-
proximately the 10th percentile of the distribu-
6 In chooing a EB plan the Irish government mentioned the
tion of the three-year cumulative change in the
fidings about the relative cost of tax hikes and expenditure exchange rate). The results were unchanged. In
cut:“In framing Budget 2010, the Government focused on curb-
ing spending to adjust expenditure needs to the revenue base addition if the exchange rate had been an impor-
which has been reduced as a result of the overall contraction of tant explanation of the difference between TB
the economy and the loss of certain income streams. In addition, and EB plans, the difference between the two
in formulating policy the Government took on board evidence cases in terms of GDP growth, should be as-
from international organizations, such as the EU Commission,
the OECD and the IMF, as well as the relevant economic lit- sociated to a different behavior of net exports.
erature which indicates that consolidation driven by cuts in ex- This is not the case. As we discussed above, the
penditure is more successful in reducing deficits than consolida-
tion based on tax increases. Past Irish experience also supports
this view and suggests that confidence is more quickly restored 7 Whether devaluations stimulate growth, or not, remains a
when adjustment is achieved by cutting expenditure rather than debated subject. Krugman and Taylor (1978) argue against the
by tax increases.” (Ireland Stability Programme Update, Decem- conventional wisdom that devaluations unambiguously increase
ber 2009, p. 15). growth.6 PAPERS AND PROCEEDINGS MONTH YEAR
driving force is domestic private investment. certainty are more likely to occur in the pres-
Finally, large fiscal adjustments are often pe- ence of EB rather than TB consolidation plans:
riods of "deep" structural reforms which may in- a TB plan which does not address the automatic
clude products and/or labor market liberaliza- growth of entitlements and other spending pro-
tion. The latter may stimulate growth and if grams which grow over time if much less like
they were systematically occurring at the time likely to produce a long lasting effect on the bud-
of spending cuts, they may explain the finding. get. If the automatic increase of spending is not
The answer is no: these reforms do not occur addressed, taxes will have to be continually in-
systematically during periods of spending cuts. creased to cover the increase in outlays. Thus
Note that this result is not inconsistent with the the confidence effect is likely to be much smaller
evidence and the case studies reported in Perotti for TB plans, as expectations of future taxes will
(2013) and Alesina and Ardagna (1998, 2013). continue to rise. EB plans produce the opposite
What these papers show is that amongst all fis- effects. 9
cal adjustments, the least costly were those ac- Alesina and Ardagna (2010) and several pa-
companied by supply side reforms and by wage pers reviewed therein, present evidence on
moderation. Our robustness check is different: the dynamics of government budgets consis-
we check whether the adoption of EB and TB tent with this interpretation: spending based ad-
adjustments can be explained by supply side re- justments lead to more long lasting debt stabi-
forms, and we find that it cannot. lization. Alesina, Favero and Giavazzi (forth-
coming) present results on business confidence
B. Confidence which support this view. They show that, at
least in their sample of OECD countries, busi-
With this (admittedly vague) term we iden- ness confidence increases immediately at the
tify situations in which a fiscal consolidation start of an EB consolidation plan, much more
removes uncertainty and stimulates demand so that at the beginning of a TB plan. Croce et al
by making consumers and especially investors (2012) examine the effects of corporate taxation
more optimistic about the future. Imagine a sit- on firms’ decisions, and hence on asset prices.
uation – for instance as described in Alesina and Shocks to government expenditure generate tax
Drazen (1991) — in which an economy is on risk for firms, and the extent of this uncertainty
an unsustainable path with an exploding public depends on the government’s financing policy
debt. Sooner or later a fiscal stabilization has and on its ability to pin down long-run tax dy-
to occur. The longer one waits, the higher the namics.
taxes that will need to be raised (or spending
to be cut) in the future When the stabilization C. The supply side: labor supply
occurs it removes the uncertainty about further
delays which would have increased even more Thus far we have not considered the supply
the costs of the stabilization.8 Blanchard (1990) side of the economy, but clearly tax hikes and
provides a simple model which illustrate this spending cuts – beyond other effects – have dif-
point. A stabilization which eliminates the un- ferent effects on labor supply.
certainty about higher fiscal costs in the future Consider the effects of TB and EB plans in
stimulates demand today — especially, we may the context of a basic neo-Keynesian model with
add, demand from investors, who are more sen- tax distortions. EB plans are the least reces-
sitive to uncertainty about the future given the sionary the longer lived is the reduction in gov-
long run nature of their plans. ernment spending. Symmetrically, TB plans
In their models Blanchard (1990) and Alesina are more recessionary the longer lasting is the
and Drazen (1991) do not distinguish between increase in the tax burden and thus in distor-
stabilizations occurring on the tax or spending tions. To grasp the intuition, think in terms of
side. However it is quite likely that the benefi- a simple demand and supply framework. As-
cial effects associated with the removal of un-
9 These models do not incorporate the possibility of default.
8 Alesina and Drazen (1991) explain delays of the unavoid- But if the latter is expected to have major adverse effects, a fiscal
able stabilization as a result of a war of attrition, a political game stabilization which removes the risk of default will have similar
amongst competing groups trying to avoid taxation. implications.VOL. VOL NO. ISSUE AUSTERITY 7
sume that the government budget is always bal- D. The supply side: network effects
anced through compensating changes in non-
distortionary transfers.10 A cut in government Following a different line of thought Ace-
expenditure has two effects. The demand curve moglu et al (2015 and 2016) study the role of
shifts inward, due to the direct effect of lower networks linking different sectors in the econ-
demand from the government. The supply curve omy and the propagation of shocks across such
also shifts inward: following a cut in govern- networks. Network based analysis of the trans-
ment spending consumers feel richer because mission of macroeconomic shocks starts from
they expect higher transfers in the future. This the observation that input-ouptut linkages can
lowers labor supply, which in turn leads to an neutralize the law of large numbers. Studying
increase in firms’ marginal costs. The shifts in the propagation of adjustments through input-
aggregate demand and supply are functions of output linkages Acemoglu et al (2016) show that
the persistence of fiscal adjustments: higher per- supply-side shocks propagate upstream more
sistence implies both higher demand and higher powerfully than downstream: downstream cus-
supply elasticities, because the long-term nature tomers of sectors that are hit by a supply shock
of fiscal shocks makes consumers more sensi- are affected more strongly than upstream sup-
tive to changes in prices and firms more aggres- pliers. The converse is true for demand shocks:
sive in their price settings. On the other hand, they propagate more powerfully upstream. The
the present value of transfers increases with the reason for this asymmetric pattern lies in the
persistence of spending cuts. The result is that fact that supply side shocks change the prices
aggregate demand reacts less, but labor supply faced by customer industries, while demand side
falls more because of the wealth effect. When shocks have much smaller effects on prices and
persistence increases, the demand shift due to a propagate upstream.11
cut in government expenditure starts to be domi- How are these results related to the evidence
nated by the supply shift due to lower labor sup- illustrated in the previous paragraph? Fiscal
ply. The demand effect falls faster than the sup- adjustments based on increasing taxation have
ply effect, so that the government spending mul- a strong supply-side component, while EB ad-
tiplier decreases with persistence. justments are one of the benchmark cases of
Symmetrically, in the case of an increase in demand-side adjustments. Because their prop-
labor taxes, the multiplier increases with persis- agation is totally different, the size of the final
tence. An increase in labor taxes has only a di- effect on output of the two different types of fis-
rect effect on aggregate supply. This is because cal adjustments depend on different elements of
labor taxes create a wedge in the labor market the input-output matrix. EB adjustments, be-
but do not distort demand directly. As in the ing mainly demand shocks, have a network ef-
case of reductions in government consumption, fect that goes through the connection of indus-
higher persistence raises the elasticities of both try i with its customers. Symmetrically, TB ad-
supply and demand. Now, however, the shift in justments, being mainly supply shocks, have a
supply dominates: as persistence rises, this shift network effect that goes through the connection
amplifies. To put it simply, a persistent increase of industry i with its suppliers. The empirical
in labor taxes makes the static substitution effect model for the measurement of the effect of a fis-
between labor and leisure more permanent and cal adjustment on value added growth is thus a
this increases the wage tax multiplier. global VAR model in which the effect of EB and
TB adjustments are the sum of a direct effect and
To the extent that fiscal adjustments are per-
an indirect effect driven by a sector and an ad-
ceived to be permanent, and are on the supply
side, a standard neo-keynesian model thus im-
11 In the simplified benchmark model studied in much of the
plies that spending cuts are (much) less reces-
literature (Long and Plosser 1983, and Acemoglu, Carvalho,
sionary than tax hikes. Ozdaglar and Tahbaz-Salehi 2012), where both production func-
tions and consumer preferences are Cobb-Douglas (so that in-
come and substitution effects cancel out), the asymmetry in the
10 This is assumed for simplicity or exposition but the intuition propagation of demand and supply shocks becomes extreme.
can be extended to the case of budget deficits and to an open There is no upstream effect from supply-side shocks and no
economy (see Alesina et al 2017b) downstream effect from demand-side shocks.8 PAPERS AND PROCEEDINGS MONTH YEAR
justment specific global variable, i.e. a weighted Auerbach A. and Y. Gorodnichenko (2012),
average of added value growth in all the other “Measuring the Output Responses to Fiscal Pol-
sectors with weights that are specific to each sec- icy”, American Economic Journal: Economic
tor and to the nature of the adjustment. Briganti Policy, 4(2), 1-27
et al (2017) show that the simulation of such a Blanchard O. (1990), “Comments on Gi-
model produces output effects of TB and EB ad- avazzi and Pagano”, NBER Chapters in NBER
justments that reproduce the asymmetry docu- Macroeconomics Annual 1990, vol. 5, 75-122
mented in the previous paragraph. Briganti E., C. Favero and M. Karamy-
sheva (2017), “The Network Effects of Fiscal
III. References Adjustments ”, mimeo IGIER, Bocconi Univer-
sity
Acemoglu D., V. Carvalho, A. Ozdaglar, Croce, M. M., H. Kung, T. T. Nguyen,
and A. Tahbaz-Salehi (2012), “The Network and L. Schmid (2012), “Fiscal Policy and As-
Origins of Aggregate Fluctuations”, Economet- set Prices”, Review of Financial Studies, 25(9),
rica, 80(5), 1977-2016 2635-2672
Acemoglu D., A. Ozdaglar, and A. Tahbaz-
DeVries P., J. Guajardo, D. Leigh and A.
Salehi (2015), “Systemic Risk and Stability in
Pescatori (2011), “A New Action-based Dataset
Financial Networks ”, American Economic Re-
of Fiscal Consolidation”, IMF Working Paper
view , 105(2), 564-608
No. 11/128, International Monetary Fund
Acemoglu D., U. Akcigit and W. Kerr
Favero, C. and F. Giavazzi (2012), “Mea-
(2016), “Networks and the Macroeconomy:
suring Tax Multipliers: The Narrative Method
An Empirical Exploration”, NBER Macroeco-
in Fiscal VARs”, American Economic Journal:
nomics Annual, 30(1), 273-335
Economic Policy, 4 (2), 69-94
Alesina A. and S. Ardagna (1998), “Tales
Giavazzi F. and M. Pagano (1990), “Can
of Fiscal Adjustment”, Economic Policy, 13(27),
Severe Fiscal Contractions Be Expansionary?
489-585
Tales of Two Small European Countries ”,
Alesina A. and S. Ardagna (2010), “Large
NBER Chapters in NBER Macroeconomics An-
Changes in Fiscal Policy: Taxes versus Spend-
nual 1990, vol. 5, 75-122
ing”, Tax Policy and the Economy, 24, 35-68,
edited by J.R. Brown Guajardo, J., D. Leigh, and A. Pescatori
Alesina A. and S. Ardagna (2013), “The De- (2014), “Expansionary Austerity? International
sign of Fiscal Adjustments”, Tax Policy and the evidence ”, Journal of the European Economic
Economy, 27(1), 19-68 Association, 12(4), 949-968
Alesina A. and A. Drazen (1991), “Why Are IMF (2010), “Will it Hurt? Macroeconomic
Stabilizations Delayed?”, American Economic Effects of Fiscal Consolidations”, Chapter 3,
Review, 81(5), 1170-1188 October
Alesina, A., C. Favero, and F. Giavazzi Krugman P. and L. Taylor (1978), “Contrac-
(2015), “The Output Effect of Fiscal Consolida- tionary Effects of Devaluation”, Journal of In-
tion Plans”, Journal of International Economics, ternational Economics, 8(3), 445-456
96, S19-S42 Leeper E. M. (2010), “Monetary Science,
Alesina A., G. Azzalini, C. Favero, F. Gi- Fiscal Alchemy”, NBER WP 16510
avazzi and A. Miano (2017a), “Is it the “How” Long J.B. and C. Plosser (1983), “Real Busi-
or the “When” that Matters in Fiscal Adjust- ness Cycles ”, Journal of Political Economy,
ments” , NBER WP 22863, forthcoming in IMF 91(1), 39-69
Economic Review Perotti R. (2013), "The Austerity Myth: Gain
Alesina A., O. Barbiero, C. Favero, F. Gi- without Pain?" in Fiscal Policy After the Great
avazzi, and M. Paradisi (2017b), “The Effects Recession, eds. Alberto Alesina and Francesco
of Fiscal Consolidations: Theory and Evidence Giavazzi, University of Chicago Press and
”, NBER WP 23385 NBER, 307-354
Alesina A., C. Favero, and F. Giavazzi Ramey, V. A. (2016), “Macroeconomic
(forthcoming), “Austerity”, Princeton Univer- Shocks and Their Propagation” in Handbook of
sity Press Macroeconomics, eds. John B. Taylor and Har-VOL. VOL NO. ISSUE AUSTERITY 9 ald Uhlig, Amsterdam: Elsevier, Vol. 2, 71- 1628 Ramey, V. A. and S. Zubairy (2014), “Gov- ernment Spending Multipliers in Good Times and in Bad: Evidence from U.S. Historical Data ”, NBER WP 20719, forthcoming in Journal of Political Economy Romer C. and D. H. Romer (2010), “The Macroeconomic Effects of Tax Changes: Es- timates Based on a New Measure of Fiscal Shocks”, American Economic Review, 100(3), 763-801
You can also read