When to Release the Lockdown? A Wellbeing Framework for Analysing Costs and Benefits - IZA DP No. 13186 APRIL 2020
←
→
Page content transcription
If your browser does not render page correctly, please read the page content below
DISCUSSION PAPER SERIES

IZA DP No. 13186

When to Release the Lockdown?
A Wellbeing Framework for Analysing
Costs and Benefits

Richard Layard            Daisy Fancourt
Andrew Clark              Nancy Hey
Jan-Emmanuel De Neve      Gus O’Donnell
Christian Krekel

APRIL 2020
DISCUSSION PAPER SERIES

IZA DP No. 13186

When to Release the Lockdown?
A Wellbeing Framework for Analysing
Costs and Benefits
Richard Layard                                                 Daisy Fancourt
LSE, House of Lords and IZA                                    University College London
Andrew Clark                                                   Nancy Hey
LSE, Paris School of Economics and IZA                         What Works Centre for Wellbeing
Jan-Emmanuel De Neve                                           Gus O’Donnell
LSE and University of Oxford                                   LSE, House of Lords and Frontier
                                                               Economics
Christian Krekel
LSE

APRIL 2020

Any opinions expressed in this paper are those of the author(s) and not those of IZA. Research published in this series may
include views on policy, but IZA takes no institutional policy positions. The IZA research network is committed to the IZA
Guiding Principles of Research Integrity.
The IZA Institute of Labor Economics is an independent economic research institute that conducts research in labor economics
and offers evidence-based policy advice on labor market issues. Supported by the Deutsche Post Foundation, IZA runs the
world’s largest network of economists, whose research aims to provide answers to the global labor market challenges of our
time. Our key objective is to build bridges between academic research, policymakers and society.
IZA Discussion Papers often represent preliminary work and are circulated to encourage discussion. Citation of such a paper
should account for its provisional character. A revised version may be available directly from the author.

                                                     ISSN: 2365-9793

                                           IZA – Institute of Labor Economics
Schaumburg-Lippe-Straße 5–9                      Phone: +49-228-3894-0
53113 Bonn, Germany                             Email: publications@iza.org                                    www.iza.org
IZA DP No. 13186 APRIL 2020
ABSTRACT
When to Release the Lockdown?
A Wellbeing Framework for Analysing
Costs and Benefits*
It is politicians who have to decide when to release the lockdown, and in what way. In
doing so, they have to balance many considerations (as with any decision). Often the
different considerations appear incommensurable so that only the roughest of judgements
can be made. For example, in the case of COVID-19, one has to compare the economic
benefits of releasing the lockdown with the social and psychological benefits, and then
compare the total of these with the increase in deaths that would result from an early exit.
We here propose a way of doing this more systematically.
JEL Classification: H12, I18, I31
Keywords: well-being, COVID-19, lockdown
Corresponding author:
Richard Layard
London School of Economics
Houghton Street
London WC2A 2AE
United Kingdom
E-mail: R.Layard@lse.ac.uk
* We are grateful for help and feedback from Tim Besley, Paul Dolan, Andy Haldane, Neil Ferguson, John Helliwell,
Andrew Oswald, Nick Powdthavee, Jeffrey Sachs, Lucia Macchia, Ekaterina Oparina, George Ward, Michael Plant,
Caspar Kaiser, Sid Bhushan, and Jonathan Van Parys.SUMMARY
The time to release the lockdown is when the net benefits of doing so become positive.
1. The net benefits include many items, some positive and some negative, and their size varies over
time.
On the positive side, releasing the lockdown
(1) increases people’s incomes now and in the future.
(2) reduces unemployment now and in the future.
(3) improves mental health, suicide, domestic violence, addiction, and loneliness.
(4) maintains confidence in the government.
(5) restores schooling.
As time progresses, the positive effects will increase in magnitude.
On the negative side, releasing the lockdown
(1) increases the final number of deaths from the virus (as well as from other conditions which may
get undertreated if health services become overstretched with COVID-19 patients).
(2) increases road-deaths, commuting, CO2 emissions, and air pollution.
2. To compare the different effects requires a common metric. We propose as a metric the number of
Wellbeing Years (WELLBYs). This metric is analogous to the QALY metric which has been
successfully used in the NHS for 20 years. It should now be extended to all fields of public policy.
3. In this paper we show how the WELLBY metric can provide a framework for evaluating the net
benefits of releasing the lockdown in the UK month-by-month, applying the WELLBY metric to each
type of effect. The net benefits rise steadily as the lockdown proceeds, since the positive items increase
in magnitude. To conduct the analysis requires making many assumptions that are subject to great
uncertainty. The figures that we present in the following table are purely illustrative and each reader is
free to make other assumptions.
Net benefits of releasing the UK lockdown on the stated date rather than one month later (in
WELLBYs, 10k)
May 1 June 1 July 1 August 1
Benefits
Income (increase) 48 66 86 103
Unemployment (reduction) 79 82 84 86
Mental health (improvement) 20 23 26 30
Confidence in government 9 13 22 32
Schooling (more) 5 5 3 0
Costs
COVID-19 deaths (more) -158 -158 -158 -158
Road deaths (more) -5 -5 -5 -5
Commuting (more) -10 -10 -10 -10
CO2 emissions (more) -7 -7 -7 -7
Air quality (worse) -8 -8 -8 -8
Net benefits -27 1 33 63
21. The framework: measuring effects in Wellbeing-Years
It is politicians who have to decide when to release the lockdown, and in what way. In doing
so, they have to balance many considerations (as with any decision). Often the different considerations
appear incommensurable so that only the roughest of judgements can be made. For example, in the case
of COVID-19, one has to compare the economic benefits of releasing the lockdown with the social and
psychological benefits, and then compare the total of these with the increase in deaths that would result
from an early exit. How can this be done more systematically?
Fortunately, a new methodology exists which enables us to do just this. It involves two steps.
The first comes from the new science of “wellbeing” which enables us to evaluate all changes in human
experience in terms of a single metric: their impact on individuals’ satisfaction with their lives. The
UK’s official statistics now include the answers to a standard question on life satisfaction on a scale of
0-10 (0 not at all satisfied; 10 completely satisfied). This question has been asked by social scientists
for at least half a century and there are therefore now well-established estimates of how different factors
affect life-satisfaction.1 So we can make a serious attempt to evaluate how different policies on
lockdown would affect the overall quality of life of the population.
But, second, these estimates have to be combined with the impact of lockdown on the loss of
life. Fortunately, for the last 20 years the NHS has used a well-accepted method of combining the effects
on the quality of life with effects on the length of life. In this method the overall effect of any treatment
is evaluated in terms of its impact on the number of Quality-Adjusted Life-Years (or QALYs). In this
method the quality of a life-year is evaluated on a scale of 0-1 (0 meaning not worth living; 1 meaning
full health). So one year of healthy life counts as one QALY, whereas one year lived in depression
counts as only 0.8 QALYs.
In this paper we adopt the same procedure for comparing changes in the quality of life with
changes in its length. But as already explained, we measure the quality of life by “wellbeing”. Thus all
effects are measured in terms of Wellbeing-Years or WELLBYs for short. The advantage of this
procedure is that we can include in the quality of life a much greater range of effects than are usually
included in the measurement of QALYs. As average wellbeing in the UK is approximately 7.5 measured
on a scale of 0-102, we count the loss of one year’s life as 7.5 WELLBYs lost.3
The value of this analysis is that it allows experts and politicians to apply their own judgements,
modifying the assumptions we have used in order to come up with an answer to the key question of
when to end the lockdown. Our assumptions imply that it would be best to end it around mid-June. But
politicians might make different tradeoffs and come up with a different result. The key point is to use a
framework like this to ensure consistency and transparency to ensure the public understand why a
particular timing is chosen. We would encourage others to build on this work adding in factors that we
have omitted or simply altering our assumptions.
The purpose of this paper is to show how this methodology can provide a framework for
evaluating the overall net benefits of ending the lockdown at different dates. For each month we
examine the net benefits of ending the lockdown at the beginning of the month compared with the
beginning of the following month. Clearly the lockdown should end as soon as the net benefits of ending
the lockdown turn positive.
But what do we mean by releasing the lockdown?
32. Releasing the lockdown
There are clearly very many ways of releasing the lockdown and a gradual exit is surely likely.
But our aim in this paper is more to illustrate a method of analysis than to arrive at a specific
recommendation. We therefore take a crude definition of the “end” of lockdown. It means that all
normal commercial life is permitted and schools are re-opened, while physical distancing (2 metres)
continues to be required as far as possible, and the elderly and vulnerable continue to self-isolate.
Once lockdown ends, the key issue is how to prevent a second wave of the disease, requiring a
second lockdown. Until a vaccine is available, the key method is testing for the disease and tracing for
contacts who would then be quarantined. (Testing for immunity would also help but would matter less
once everyone is allowed to go back to work). Unfortunately, sufficient testing and tracing is only
possible once (i) the rate of infection is already low enough and (ii) the capacity for testing and tracing
is high enough. This consideration is reflected in our estimates of how many people die from ending
the lockdown at different dates.
In what follows we compare the effects of ending the UK lockdown on 1 May, 1 June, 1 July,
1 August, and 1 September.
3. Measuring the effects of releasing the lockdown in the UK
None of the effects are easy to measure. But any judgement between alternative policies is
always based upon implicit guesses about
(i) the effects of the decision on the level of each outcome, and
(ii) the relative importance of each outcome.
In what follows we assign explicit numbers to each of these elements – taking the different
outcomes one by one.
(1) Income
Clearly the lockdown has huge impact on different peoples’ incomes. For example, for those
employed in March and now on paid leave, 80% of their earnings are currently protected (to a maximum
of £2,500 a month). The self-employed will receive 80% of their average profits in the previous three
years. Clearly corporate profits are being severely hit but the largest part of the fall in income will fall
on taxpayers. It is, however, extremely difficult to forecast these different components separately, so
we simply focus on the loss of GDP.4 When weighing the economy against the loss of life, we do not
wish to exaggerate the losses to the economy and therefore make fairly conservative estimates of these.5
We assume that income during the present phase of the lockdown is 28% down on 2019 (see
Appendix 1), and we assume that this level of output will continue as long as the lockdown persists.
But after the lockdown ends, the pace of recovery will be slower the longer the lockdown has gone on
and the more businesses have had to close. Specifically, we assume that if the lockdown ended on 1
May, output would recover to its 2019 level within one year (in a linear trend). By contrast, if the
lockdown lasted to 1 September (i.e. just over 5 months), we assume output would not recover to its
2019 level for two years. (For dates in between we interpolate6).
4Using these assumptions, we can calculate the total loss of income which would occur from 1
May onwards for each date of leaving the lockdown. Table 1 shows this loss expressed as a proportion
of annual income in 2019.
Table 1. Total loss of income from 1 May 2020 onwards for each date of leaving
(as % of annual income in 2019)
Leave on % of income
1 May 14.0
1 June 17.7
1 July 22.8
1 August 29.4
1 September 37.3
For each date of leaving the loss is greater than for leaving one month earlier, and these
differences are what matter when we compare one date of leaving with another. These differences are
shown in Table 2.
Table 2. Gain in income from leaving at the date shown rather
than one month later (as % of annual income in 2019)
Leave on % of income
1 May 3.7
1 June 5.1
1 July 6.6
1 August 7.9
The next issue is how to value these gains in output from ending the lockdown earlier. There
have been literally thousands of studies of the relation between wellbeing and income. They yield
broadly similar results, which imply that a 1% gain in income increases wellbeing (measured 0-10) by
around 0.002 points.7 As we discuss in Appendix 1, this implies that to save one year of life we should
be willing to spend much more than the NICE cut-off of £25,000 - and indeed much more than is
allowed for in most cost-benefit analyses.8 Using our standard valuations of income we can immediately
reach the last stage of the argument. In Table 3 we take the percentage differences in annual income
from Table 2 and we multiply them by the coefficient of 0.002 times the UK population of 65 million.
Table 3. Gain in WELLBYs due to income gains from leaving at the date shown
rather than one month later
Leave on WELBYs (10k)
1 May 48
1 June 66
1 July 86
1 August 103
It is these figures that enter our final evaluation in Table 4, and figures like them for each other
effect.
5(2) Unemployment
As serious as the fall in output caused by the lockdown is so is the rise in unemployment. The
two are less closely related than in a normal business cycle. For the biggest part of the fall in output is
due to the furlough (paid leave) of workers who stop producing but retain their jobs.9 The biggest group
of newly unemployed people are self-employed workers who are prohibited from working. Many of
these will go out of business and they will be joined by former employees whose employers go bust or
lay them off. For most of them it will be a struggle to get back into work.
Unemployment will have risen from 1.2 million early in the year to 3.4 million by 1 May—a
10% rate of unemployment.10 This does not include workers on paid leave. We assume that, as long as
the lockdown lasts, unemployment will rise by 0.1 million each month. But as soon as lockdown is
lifted, it starts to fall until it returns to its original level of 1.2 million. The rate of fall is roughly the
same whenever this fall begins. As explained in Appendix 3, the number of extra months of
unemployment caused by continuing the COVID-19 lockdown through May is therefore 0.3 million
years, rising slightly in each subsequent month.
Unemployment matters not only because of the income loss (which has already been covered)
but also because of the impact on self-esteem and self-worth as well as the loss of social ties. In typical
studies the psychic cost of being unemployed for one year is 0.7 WELLBYs. At the same time, higher
unemployment generates widespread fear. It has a hugely unsettling effect on the employed, and on a
typical estimate the effect of one person’s unemployment for a year when aggregated across the rest of
the community is 2.1 WELLBYs.11 Table 4 at the end of our paper shows the effect of applying these
values to the forecast level of unemployment with a benefit of leaving on 1 May (rather than a month
later) of 790,000 WELLBYs.
(3) Mental Health
Self-isolation is a huge problem for many people. It is desperately lonely for many of those on
their own, while for those in overcrowded dwellings it can generate intolerable tension. There is clear
evidence of increased domestic violence.12 For many children, being cooped up is especially dangerous.
On top of all this, economic uncertainty causes increased anxiety to millions. It appears inevitable that
continued lockdown will increase mental illness, both among adults and children. The scale of this is
not easy to forecast.
There are altogether some 12 million adults and 1 million children in the UK who suffer from
diagnosable mental illnesses. These include mainly depression and anxiety disorders like PTSD, OCD,
panic attacks, phobias and ADHD but they also include in smaller numbers schizophrenia, personality
disorder and drug and alcohol dependence. On average NICE classify these 13 million people as
experiencing only 0.8 QALYs per year of life rather than 1.0 QALY for those who are well. The loss
through illness is thus 0.2 QALYs per person per year. We assume that, as long as the lockdown lasts,
the loss to these people is increased by 10 % in May rising to 15% in August. The cost of the first extra
month of lockdown is therefore 26,000 QALYs or 195,000 WELLBYs.
(4) Confidence in Government
The mental health of the people is one thing but something quite different is their morale – in
particular their faith in the government or their anger against it. This is well measured by the question
“Do you approve or disapprove of the Government’s record to date”. The figure in Appendix shows the
answer to this question. Approval of the government was very low during the Brexit deadlock in the
Summer of 2019 (with approval ratings as low as 10%). It then recovered and stabilized around 30% in
6the months before lockdown. But once lockdown occurred on March 23, government approval soared
to 52%. This is probably because demonstrating leadership and providing clear guidance are welcomed
in times of uncertainty. Indeed, Fetzer et al (2020) show how the UK lockdown directly reduced worries
and improved the perception of government response. However, as was observed in other crisis
situations in recent history, this spike in government approval will probably erode as the lockdown
proceeds even if the policy seems to be working. Frustration and social unrest are likely to rise at an
increasing rate. In fact, approval ratings have already started to erode gradually (see Appendix 4). For
our analyses, we assume that as the lockdown proceeds confidence in government drops at an increasing
rate by 4 % points in May, 6% in June, 10% in July, and 15% in August. Once lockdown ends, we
assume that confidence in government returns to its original level.
Trust in government is an important factor affecting the wellbeing of nations. Following
Macchia and Plagnol (2018), we run a regression analysis of life evaluation on confidence in national
institutions in the UK and Europe using the Gallup World Poll, 2009-2020. We use the survey item “In
‘your country’ do you have confidence in each of the following, or not? How about the national
government?” The answer is a binary yes or no response. The analysis shows that a 10% fall in
government confidence produces a reduction of 0.052 points in life evaluation (which runs on a scale
from 0 to 10). See the Appendix for details. Spread over 50 million adults, a 10% reduction in
government confidence for one month would amount to about 220,000 WELLBYs. Table 4 shows the
corresponding effects in terms of WELLBYs spread by month in line with our expected trajectory.
(5) Schooling
The final benefit from ending the lockdown is the re-opening of schools. School closure
damages the education of children. The degree of damage varies hugely, depending significantly on the
extent of distance learning. Education matters both for the increased productivity that results from it
and for the social and emotional training that occurs in school. The nation spends about £7 billion a
month on schools in each month of the school year.13 If we assume that the present value of benefits
equals double the costs but that half these benefits still accrue during lockdown, the benefits gained
from opening the schools a month earlier are £7 billion. This equals approximately 4% of monthly GDP
which raises average wellbeing across the population by 0.008 points for one month. Spread across 65
million people this is a gain of 52,000 WELBYs.
This concludes the main benefits of ending the lockdown. We turn now to the costs of doing
so. The first is the increased number of COVID-19 deaths.
(6) COVID-19 Deaths
If the lockdown ends on 1 May in the manner described earlier, the UK would experience some
150,000 deaths from COVID-19, mostly in a second wave occurring before a regime of testing and
tracing can be put in place.14 By contrast if the lockdown ends 1 September and there is a robust regime
of testing and tracing (as was observed in South Korea15), the number of subsequent deaths will be at
most 5,000.
How many deaths would occur at intermediate dates of ending the lockdown? It is difficult to
be sure and the neutral assumption is that the number would decline in a straight line from 150,000 to
5,000. So each extra month of lockdown saves some 35,000 lives.
We then assume that those who die would on average have lived another six years.16 Thus each
extra month of lockdown saves 1,575,000 WELLBYs.17
7These are deaths from COVID-19. However, it is quite possible that extending the lockdown
would increase the number of non-COVID-19 deaths. In the week ending 10 April there were some
2,300 “non-COVID-19” deaths in excess of the number expected based upon previous years’
experience. Most of them died outside hospital. A&E departments have experienced a sharp decrease
in attendance. However, it is difficult to say whether this was due to lockdown (“stay at home”) or
whether it was because of the risk of exposure from leaving home (which would be even worse if the
lockdown were ended). We therefore ignore this factor.
We end with a variety of beneficial side-effects of the lockdown which would be lost if it were
ended. Their cumulative impact on the lockdown decision would be small.
(7) Road Deaths
We assume a 73% reduction in road deaths (Cabinet Office, 2020)18 with 43 years of life saved
(calculated as average life expectancy minus median age, cf. ONS, 2016,19 201920) for each person not
killed. This yields a gain of about 47,000 WELLBYs for each extra month of the lockdown.
(8) Commuting
We assume that roughly 10 million people spend one hour less commuting per day. Since
having a daily commute of one hour reduces life satisfaction by 0.12 points,21 the decrease in commuting
generates in total a saving of 100,000 WELLBYs each month, assuming that there are on average 22
work days per month on which people commute to work.
(9) CO2 Emissions
We assume that CO2 emissions are reduced by just over a half due to reduced travel and
production, that is, by about 19 million tonnes (BEIS, 2020)22. If we value this at $60 (roughly £50) per
tonne, this reduction is worth about £950 million or 0.5% of monthly GDP. This increases average
wellbeing across the population by 0.001 points for one month. Spread over 65 million people, this is
an increase of roughly 7,000 WELLBYs each month.
(10) Air Quality
For similar reasons, air quality improves. We assume that about 23% of the population or
roughly 15 million people move from bad to good air quality (British Heart Foundation, 2020)23. This
raises wellbeing by about 0.06 points for each person affected (Rehdanz and Maddison, 2008)24. When
spread over 65 million people, this saves about 76,000 WELLBYs each month.
(11) Other factors and limitations
This analysis is not without its limitations. Many aspects are still missing and some variables
are difficult to forecast. For example, recorded crime has fallen25 but it is difficult to anticipate how it
might evolve as the lockdown proceeds. Furthermore, we have insufficient data on volunteering which
can be expressed in many different ways. For example, while some volunteering can be expected to go
down because of movement restrictions, we have seen an increase in other forms of volunteering. It is
also very difficult to forecast time use changes (except for commuting). For example, the impact of
changes in physical activity or exercise may go either way.
Another set of limitations is that our estimates are not accompanied by statistical confidence
intervals and sensitivity analyses and therefore need to be seen as rough valuations of the costs and
benefits of the lockdown in terms of wellbeing metrics. For example, if people who died of COVID-19
would otherwise have lived on average for 5 years rather than 6 (as we assume), then the net benefits
in Table 4 (bottom row) would need to be increased by 35 * 10k WELLBYs. Moreover, we tabulate
8average effects at population level but the COVID-19 virus and the lockdown policy impact different
parts of the population in very different ways.26 Disaggregating the data will reveal myriad ways in how
the lockdown policy is experienced.
4. Results
In Table 4 we aggregate the effects of future policy upon all the outcomes that we have
considered. To do this, we have expressed all effects in units of Wellbeing-Year or WELLBYs, using
the evidence of wellbeing science to value each outcome. Most of the effects are upon the quality of
life. But there is also the key effect upon the length of life, where, as explained, we value one year of
healthy life at 7.5 WELLBYs. There are clearly major uncertainties about each of our estimates – both
the forecasts of the outcome and the impact of the outcomes upon wellbeing. But judgement is a matter
of balancing one effect against another, and this becomes easier as we try to assign magnitudes to each
effect. This quantitative framework is the main contribution of this paper. The numbers in Table 4 are
purely illustrative.
As shown in Appendix 5, we are witnessing important changes in how people experience the
quality of their lives throughout this period. Such measures of wellbeing can capture the complexity of
the situation in a single set of metrics that can then be usefully applied to informing evidence-based
policy that is more holistic in nature. We invite other researchers to develop and refine this model and
we recommend that policy-makers adopt this approach in reaching their decision on when to end the
lockdown.
Table 4. Net benefits of releasing the UK lockdown on the stated date rather than one month
later (in WELLBYs, 10k)
May 1 June 1 July 1 August 1
Benefits
Income (increase) 48 66 86 103
Unemployment (reduction) 79 82 84 86
Mental health (improvement) 20 23 26 30
Confidence in government 9 13 22 32
Schooling (more) 5 5 3 0
Costs
COVID-19 deaths (more) -158 -158 -158 -158
Road deaths (more) -5 -5 -5 -5
Commuting (more) -10 -10 -10 -10
CO2 emissions (more) -7 -7 -7 -7
Air quality (worse) -8 -8 -8 -8
Net benefits -27 1 33 63
1
eg Clark et al (2018).
2
See ONS (2019).
3
See Dolan (2011). Some would argue that 7.5 is excessive. For there is some evidence that a life satisfaction of
2 is considered not worth living (Peasgood et al., 2018) in which case a year of life is worth less than 7.5
WELLBYs. But we do not assume this because we wish to give adequate weight to the cost of death.
94
The lockdown, of course, provided time for increased “home production” such as DIY which are not included
in GDP.
5
The OBR’s forecast of 14 April is even more optimistic. They assume that if the lockdown ends on 1 July output
reverts to normal in Q4. (OBR corona virus reference scenario 14 April 2020). By contrast the OBR assume a
current drop of 35% in Q2 compared with our 28%, which is explained in Appendix 1.
6
We assume that the delay rises at an increasing rate, thus 1 June 1.1 year; 1 July 1.3 years; 1 August 1.6 years.
We also assume that the date at which output returns to “normal” has no effect on the course of “super-normal”
output.
7
As examples, see Clark et al (2018) Table 16.2; De Neve et al (2018). The paper by Stevenson and Wolfers
(2008) has slightly higher estimates but these come from regressions with no other covariates. Moreover, if most
people’s incomes fall, the sense of common suffering may blunt the loss in wellbeing from an income loss (see
Clark et al 2008).
7
eg Thunstrom et al (2020).
9
See
https://www.ons.gov.uk/peoplepopulationandcommunity/healthandsocialcare/conditionsanddiseases/bulletins/co
ronavirustheukeconomyandsocietyfasterindicators/16april2020
10
See forecast for Q2 by The Office for Budget Responsibility (2020). They also give a forecast path for the
decline of unemployment conditional on lockdown ending on 1 July. We ignore comparison effects which might
reduce the pain of widespread unemployment, because these are small.
11
See Clark et al (2018) Table 16.2 We also include an allowance of 0.1 for scarring effects that are assumed to
last for one year after the end of the unemployment spell (see Clark et al., 2001).
12
See https://www.refuge.org.uk/refuge-response-to-home-secretary-announcement-of-support-for-domestic-
abuse-victims/
13
See Paul Bolton (2019) Education Spending in the UK.
14
Based on advice from Professor Neil Ferguson.
15
Normile, D. (March 17, 2020). Coronavirus cases have dropped sharply in South Korea. What’s the secret to
its success? Science. Available at: https://www.sciencemag.org/news/2020/03/coronavirus-cases-have-dropped-
sharply-south-korea-whats-secret-its-success
16
To estimate the average remaining life expectancy of those who die of COVID-19 we proceed as follows. First,
we calculate the average remaining life expectancy of people of each age (see ONS Life Tables). Then, we
calculate what percentage of those who die of COVID-19 are of each age (see ONS Deaths Involving COVID-
19) and use these weights to compute what the average remaining life expectancy would have been from those
who died of COVID-19. The resulting number is 11.3 years. However, those who die of COVID-19 have on
average substantially lower life expectancy than the average for their age group due to prior co-morbidities. We
assume that their life expectancy is approximately half of that 11.3 estimate and use a figure of 6 years. This is a
similar to the one used by Dolan and Jenkins (2020).
17
We do not include any economic benefits from avoiding a 2nd wave of deaths if the lockdown is lifted since it
would be politically difficult to impose a 2nd lockdown.
18
Source: Department for Transport. Statistical data set: Modal comparisons (TSGB01). Available at:
https://www.gov.uk/government/statistical-data-sets/tsgb01-modal-comparisons
19
Source: Office for National Statistics. Overview of the UK population: February 2016. Available at:
https://www.ons.gov.uk/peoplepopulationandcommunity/populationandmigration/populationestimates/articles/o
verviewoftheukpopulation/february2016
20
Source: Office for National Statistics. National life tables, UK: 2016 to 2018.
21
See Oguz, S. (2014)
22
Source: Department for Business, Energy & Industrial Strategy. Final UK greenhouse gas emissions national
statistics: 1990 to 2018.
23
Source: Blake, I. (February 4, 2020). Government must go further and faster on air pollution. British Heart
Foundation.
24
See Rehdanz, K., and Maddison, D. (2008)
25
See e.g. https://www.telegraph.co.uk/politics/2020/04/07/violent-crime-falls-40-per-cent-coronavirus-
lockdown/
26
See e.g. Oswald and Powdthavee (2020) and Adams-Prassl et al (2020)
10References
Adams-Prassl, A., Boneva, T., Golin, M. and Rauh C. (2020) Inequality in the Impact of the
Coronavirus Shock: Evidence from Real Time Surveys. Mimeo.
Blake, I. (February 4, 2020). Government must go further and faster on air pollution. British Heart
Foundation.https://www.bhf.org.uk/what-we-do/news-from-the-bhf/news-
archive/2020/february/government-must-go-further-and-faster-on-air-pollution
Bolton, P. (2019) Education Spending in the UK. https://commonslibrary.parliament.uk/research-
briefings/sn01078/
Clark, A.E., Flèche, S., Layard, R., Powdthavee, N., and Ward, G. (2018). The Origins of Happiness:
The Science of Well-Being over the Life-Course. Princeton NJ: Princeton University Press.
Clark, A.E., Frijters, P., and Shields, M. (2008). Relative Income, Happiness and Utility: An
Explanation for the Easterlin Paradox and Other Puzzles. Journal of Economic Literature, 46, 95-144.
Clark, A.E., Georgellis, Y., and Sanfey, P. (2001). Scarring: the Psychological Impact of Past
Unemployment. Economica, 68, 221-241.
De Neve, J.-E., Ward, G., De Keulenaer, F., Van Landeghem, B., Kavetsos, G., and Norton, M. I.
(2018). The Asymmetric Experience of Positive and Negative Economic Growth: Global Evidence
Using Subjective Well-Being Data. The Review of Economics and Statistics, 100(2), 362–375.
Department for Transport. Statistical data set: Modal comparisons (TSGB01). Available at:
https://www.gov.uk/government/statistical-data-sets/tsgb01-modal-comparisons
Department for Business, Energy & Industrial Strategy. Final UK greenhouse gas emissions national
statistics: 1990 to 2018. Available at: https://www.gov.uk/government/statistics/final-uk-greenhouse-
gas-emissions-national-statistics-1990-to-2018
Dolan, P. (2011) Using happiness to value health. Office of Health Economics.
Dolan, P., and Jenkins, P. (2020). Estimating the monetary value of the deaths prevented from the UK
Covid-19 lockdown – and the value of “flattening the curve”. Mimeo.
Ferguson, N.M., Laydon, D., Nedjati-Gilani, G., Imai, N., Ainslie, K., Baguelin, M., … et al. (2020).
Report 9: Impact of non-pharmaceutical interventions (NPIs) to reduce COVID-19 mortality and
healthcare demand. Imperial College COVID-19 Response Team. Available at:
https://www.imperial.ac.uk/media/imperial-college/medicine/sph/ide/gida-fellowships/Imperial-
College-COVID19-NPI-modelling-16-03-2020.pdf
Fetzer, T., Witte, M., Hensel, L., Jachimowicz, J., Haushofer, J., Ivchenko, A., … Yoeli, E. (2020).
Global Behaviors and Perceptions in the COVID-19-19 Pandemic. Retrieved from psyarxiv.com/3kfmh
HM Treasury (2020) The Green Book: appraisal and evaluation in central government. Available here:
https://www.gov.uk/government/publications/the-green-book-appraisal-and-evaluation-in-central-
governent
Macchia, L., and Plagnol, A. C. (2018). Life Satisfaction and Confidence in National Institutions:
Evidence from South America. Applied Research Quality Life, 14, 721–736.
Normile, D. (March 17, 2020). Coronavirus cases have dropped sharply in South Korea. What’s the
secret to its success? Science. Available at: https://www.sciencemag.org/news/2020/03/coronavirus-
cases-have-dropped-sharply-south-korea-whats-secret-its-success
11Office for Budget Responsibility (April 14, 2020). Commentary on the OBR coronavirus reference
scenario.
Office for National Statistics. Personal and economic well-being in the UK: August 2019
https://www.ons.gov.uk/peoplepopulationandcommunity/wellbeing/bulletins/personalandeconomicwe
llbeingintheuk/august2019
Office for National Statistics. Overview of the UK population: February 2016. Available at:
https://www.ons.gov.uk/peoplepopulationandcommunity/populationandmigration/populationestimates
/articles/overviewoftheukpopulation/february2016
Office for National Statistics. National life tables, UK: 2016 to 2018. Available at:
https://www.ons.gov.uk/peoplepopulationandcommunity/birthsdeathsandmarriages/lifeexpectancies/b
ulletins/nationallifetablesunitedkingdom/2016to2018
Office for National Statistics. Deaths involving COVID-19, England and Wales: deaths occurring in
March 2020. Available at:
https://www.ons.gov.uk/peoplepopulationandcommunity/birthsdeathsandmarriages/deaths/bulletins/d
eathsinvolvingcovid19englandandwales/deathsoccurringinmarch2020
Oguz, S. (2014) Commuting and Personal Well-being, 2014. Office for National Statistics.
Oswald, A.J. and Powdthavee, N. (2020) The Case for Releasing the Young from Lockdown: A
Briefing Paper for Policymakers. IZA DP No. 13113
Peasgood, T., Mukuria, C., Karimi, M., & J. Brazier (2018). Eliciting preference weights for life
satisfaction: A feasibility study. Mimeo.
Rehdanz, K., and Maddison, D. (2008). Local environmental quality and life-satisfaction in Germany.
Ecological Economics, 64(4), 787–797.
Stevenson, B., and Wolfers, J. (2008). Economic Growth and Happiness: Reassessing the Easterlin
Paradox. Brookings Papers on Economic Activity, spring, pp. 1–87
Thunstrom, L., Newbold, S.C., Finnoff, D., Ashworth, M., and J.F. Shogren (2020) The benefits and
costs of flattening the curve for COVID-19. (April 14, 2020). Forthcoming Journal of Benefit-Cost
Analysis. Available at SSRN: https://ssrn.com/abstract=3561934
12APPENDICES
1. GDP cost of lockdown
2. The monetary value of Life-Years
3. Unemployment
4. Confidence in government
5. Trends in life satisfaction and happiness before and after the lockdown on March 23
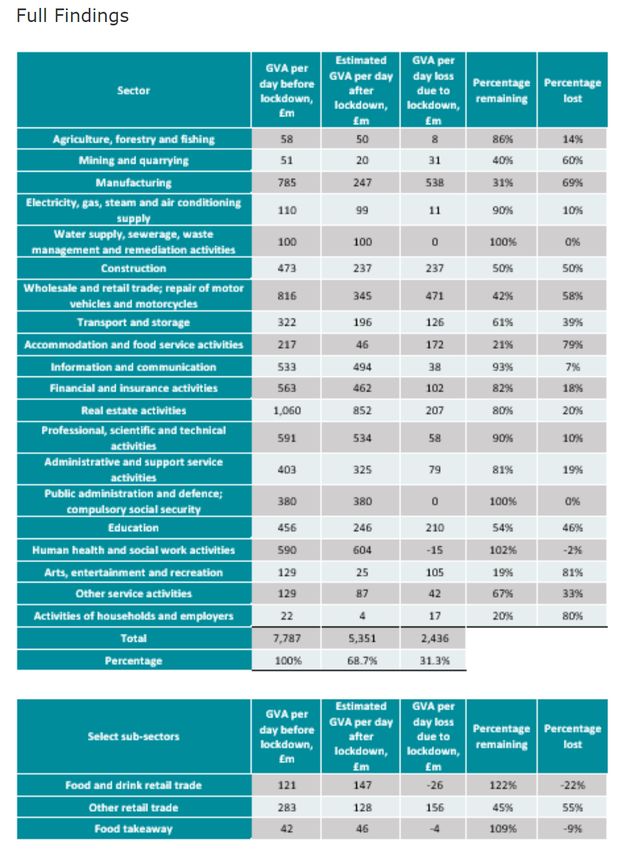
131. GDP cost of lockdown
• UK GDP in 2019 was £2.2 trillion or just under £6.1 billion per day.
• The policies introduced by the UK Government on 23 March have, from surveys, clearly had a
dramatic impact on production and spending decisions in the economy.
• For the second quarter, many external economists are forecasting double-digit falls in UK GDP,
after a more modest fall in the first.
• At this stage of the data cycle, the uncertainty around any quantification of these GDP effects is
still enormous.
Output-Based Estimates
• One way of gauging these effects is by looking at how much disruption there will be to the
production decisions of various sectors – in other words, looking at the output side of the National
Accounts.
• The Centre for Economics and Business Research (CEBR) recently did this, on a sector by sector
basis (summarised below).
• Taking into account the sectors’ share of value-added, the sectors contributing most to the hit to
output are manufacturing, wholesale and retail trade, and construction.
• All in all, the CEBR arrive at a loss of just less than a third of GDP. This is equivalent to a loss of
around £1.7 billion for each day the social distancing policies are in place.
• (NB: This is a scaled-down estimate of the CEBR’s because we have used actual rather than
working days, the former which seems more appropriate.)
Expenditure-Based Estimates
• Another way to scale the GDP hit is by looking at the expenditure side of the National Accounts.
• For consumers, you can classify spending four ways: social consumption; delayable consumption;
work-related consumption; and consumption of staples. These represent, respectively, 11%, 14%,
5% and 32% of GDP.
• We would expect the first category to be hardest hit by the social distancing measures, with large
hits to the second and third too.
• There could be some small partial offset from higher spending on staple items, as recent
supermarket data suggest.
• Assume that social consumption is reduced by 100% and delayable and work-related consumption
are each reduced by 90%, with a 5% offset from higher spending on essentials during the period of
lockdown.
• As we know the import penetration of these different types of consumption, we can measure the
effect on GDP of each category.
• Exploiting that information translates into a GDP hit of almost 20%, or £1.2 billion per day, from
lower spending by households.
• In addition, we would expect companies to delay their capital spending for the duration of the social
distancing policies (at least).
• If we assume investment net of depreciation is zero, such that the capital stock is flat, that is
equivalent to business investment being around £55 million per day lower.
So, whether looked at from the production or expenditure side of the economy, we might expect a hit
to GDP of between around £1.3-1.7 billion per day. In this paper we use the higher estimate which is
28% of GDP.
1415
2. The monetary value of Life-Years

Suppose that we use NICE’s £25,000 per QALY and we accept the estimate of Ferguson et al (2020,
page 16) that no general lockdown (as opposed to mitigation) would have produced 250,000 more
deaths. Suppose, too, that these people would otherwise have lived 6 more years. This implies a loss of
under £40b or under 2% of one year’s GDP. Since the lockdown costs hugely more than that, we should
never have done it—if we accept the figure of £25,000 per QALY or even £60,000 per QALY as is
commonly advocated2. By contrast, the public supported and still support the lockdown. This implies
that the NICE cut-off is too low relative to the public’s valuation of life-years.

The NICE cut-off is also inconsistent with what we know about the impact of income on human welfare.
Research shows that, when a person has 1% more income their wellbeing is 0.002 points higher. So an
extra £1 of income produces 0.2/Y additional WELLBYs where Y is the person’s annual income.
Furthermore, since average life satisfaction is 7.5, an extra year of life produces 7.5 more WELLBYs.
To value these we ask the following question: what is the amount of money £x that when £x/N is taken
from each of N people their total WELLBYs fall by 7.5? That £x is the maximum amount of money
that society should be willing to pay for securing one extra year of life. It is given by

                                         (x/N)*(0.2/Y)*N = 7.5

since (0.2/Y) is the extra wellbeing per £1 and N people are affected. Thus,

                                              x = 7.5Y/0.2

If Y = £20,000, x = £750,000. That is the cost per QALY implicit in this paper. However, it does not
mean that, when public expenditure is constrained, it would be right for the NHS to use this figure,
since there are many other competing forms of cost-effective public expenditure.

2
  See HM Treasury Green Book. Whereas the £25,000 reflects the finance available to the NHS. The £60,000
reflects an unconstrained valuation.

                                                    16
3. Unemployment
We assume a level of unemployment on May 1st of 3.4 million, in line with the OBR predictions (Office
for Budget Responsibility, 2020). The “natural” level of unemployment is taken to be 1.2 million,
corresponding to the number of unemployed in the UK at the end of 2019: lockdown is then associated
with a rise in unemployment of 2.2 million. Every additional month of lockdown is assumed to add 0.1
million to this figure.
Excess COVID-19 unemployment is then 2.2 million in May, and rises 0.1 million each month to 2.6
million in September.
There are two elements to the unemployment cost of extending the lockdown for a month: i) the cost of
keeping the stock of the excess unemployed out of work one additional month, and ii) what subsequently
happens as a result of the extra 100k people unemployed each month.
For i), the WELLBY cost of a stock N of excess unemployed who remain out of work one additional
month is (N/12)*2.8. For extending the lockdown from May to June, the excess unemployment figure
is 2.2 million, then 2.3 million for extension from June to July, and so on. Analogous calculations are
made for each additional month of extension.
For ii), the additional 0.1 million unemployed each month generate subsequently 0.1 million additional
years of unemployment. This results in an additional cost of 100k*2.8 WELLBYs.
The total WELLBY cost of unemployment due to delay is thus as follows (in million WELLBYs).
Excess COVID Cost of keeping excess stock Cost of extra 100k
Unemployment Unemployment unemployed one month more unemployed for one year
(Millions) (Millions) (=(stock/12)*2.8) (=0.1*2.8) Total Cost
May 3.4 2.2 0.51 0.28 0.79
June 3.5 2.3 0.54 0.28 0.82
July 3.6 2.4 0.56 0.28 0.84
August 3.7 2.5 0.58 0.28 0.86
It is interesting to compare our forecast path of unemployment for an exit date of 1 July with the
equivalent forecast by the OBR (2020). They turn out to be almost identical.
174. Confidence in government
Trend in UK government approval rating before and after the lockdown on March 23d (YouGov)
Regression of life evaluation on confidence in government in the UK and Europe, Gallup World Poll,
2009-2020.
Dependent variable: Life evaluation (0-10)
UK Europe
(1) (2)
Confidence in government (0, 1) 0.520*** 0.454***
(0.033) (0.008)
Constant 5.880*** 6.102***
(0.187) (0.050)
Observations 11,219 206,798
R2 0.081 0.241
Adjusted R2 0.079 0.240
Residual Std. Error 1.687 (df = 11191) 1.640 (df = 206748)
F Statistic 36.767*** (df = 27; 11191) 1,336.388*** (df = 49; 206748)
Notes: * p < 0.05, ** p < 0.01, *** p < 0.001. Models show unstandardized regression coefficients with standard
errors in parentheses. Model 1 includes year fixed effects only and model 2 includes country-year fixed effects.
Model 2 includes the following countries: Austria, Belgium, Denmark, Estonia, Finland, France, Germany,
Iceland, Israel, Italy, Latvia, Lithuania, Luxembourg, Malta, Moldova, Netherlands, Norway, Portugal, Spain,
Sweden, Switzerland. The dependent variable represents Cantril’s Ladder of Life (0-10). All models include
gender, age, age squared, level of education, marital and employment status, number of children under 15 in the
household and log of personal income as controls.
185. Trends in happiness3 and life satisfaction4 before/after the UK lockdown on March
23, 2020 (sources: YouGov and UCL COVID-19 Social Study)
3
The happiness item is derived from the YouGov weekly survey of a representative sample of about 2,000 UK
residents. It represents the percentage of survey participants indicating “Happy” to the following question:
“Broadly speaking, which of the following best describe your mood and/or how you have felt in the past week.”
4
The life satisfaction item is obtained from the UCL COVID-19 Social Study. The weekly survey asks
“Overall, in the past week, how satisfied have you been with your life?” where 0 represents “not at all” and 10
represents “completely”. The UCL COVID-19 Social Study is a large panel study of the psychological and
social experiences of over 75,000 adults (aged 18+) in the UK during the COVID-19 pandemic. The study
commenced on 21st March 2020 and involves online weekly data collection from participants for the duration of
the COVID-19 pandemic in the UK. The study is not random and therefore is not representative of the UK
population. But it does contain a well-stratified sample that was recruited using three primary approaches. First,
snowballing was used, including promoting the study through existing networks and mailing lists (including
large databases of adults who had previously consented to be involved in health research across the UK), print
and digital media coverage, and social media. Second, more targeted recruitment was undertaken focusing on (i)
individuals from a low-income background, (ii) individuals with no or few educational qualifications, and (iii)
individuals who were unemployed. Third, the study was promoted via partnerships with third sector
organisations to vulnerable groups, including adults with pre-existing mental health conditions, older adults,
carers, and people experiencing domestic violence or abuse. The study was approved by the UCL Research
Ethics Committee [12467/005] and all participants gave informed consent.
19You can also read