01 Leading The Way - Media Corporate IR Net
←
→
Page content transcription
If your browser does not render page correctly, please read the page content below
’01   Leading The Way

                 C A R N I VA L
                   CORPORATION

               World’s Leading Cruise Lines

                  2001 A   N N UA L   R   E P O R T
®

   www.carnival.com                                          www.leaderships.com

                           Carnival Corporation is the most profitable and has the strongest financial posi-
                           tion of any cruise company in the world. We are a global vacation and leisure travel
                           provider that offers holidays that appeal to a wide range of lifestyles and budgets.
                           We own and operate six cruise lines under the brand names Carnival Cruise Lines,
                           Costa Cruises, Cunard Line, Holland America Line, Seabourn Cruise Line and
                           Windstar Cruises. Our cruise lines operate 43 ships that travel to a wide variety of
 www.costacruises.com      exciting destinations around the world. In addition, we currently have 14 new ships
                           scheduled for delivery during the next four years.

                           We also own a tour company that operates hotels, motor coaches, rail cars and
                           excursion vessels primarily in Alaska and the Canadian Yukon.
                      TM

                           Carnival Cruise Lines is the most popular and most profitable cruise line in the world.
                           The leader in the contemporary cruise sector, Carnival operates 16 ships, including its
                           newest ship, the Carnival Pride. The line currently has five new ships at an estimated
   www.cunard.com          cost of $2.3 billion scheduled for delivery during the next three years. Carnival ships
                           cruise to destinations in the Bahamas, Canada, the Caribbean, Mexico, New England,
                           the Panama Canal, Alaska and Hawaii.

                           Costa Cruises is Europe’s leading cruise line. Headquartered in Italy, Costa offers
                           guests on its eight ships a multi-ethnic, multi-cultural and multi-lingual ambiance. The
                           line currently has three new ships at an estimated cost of $1.1 billion slated to enter
                           service during the next three years. Costa ships, including its newest, the popular
                           Costa Atlantica, sail to destinations in Europe, South America and the Caribbean.

                           Cunard Line offers the only regular transatlantic crossings aboard the Queen Elizabeth 2,
                           and has recently repositioned the Caronia to service the growing U.K. market with
                           round-trip cruises from Southampton. The line currently has two new ships at an esti-
                           mated cost of $1.2 billion scheduled for delivery in December 2003 and early 2005,
www.hollandamerica.com     including the $780 million ocean liner, Queen Mary 2.

                           Holland America Line is a leader in the premium cruise sector. Holland America oper-
                           ates a five-star fleet of ten ships, including its two newest ships, the Zaandam and the
                           Amsterdam. The line currently has four new ships at an estimated cost of $1.6 billion
                      TM
                           scheduled for delivery during the next four years. Primary Holland America destina-
                           tions include Alaska, the Caribbean, the Panama Canal and Europe.

                           Seabourn Cruise Line epitomizes luxury cruising aboard each of its three intimate all
                           suite ships. The Yachts of Seabourn are lavishly appointed with virtually one staff
                           member for every guest, which assures superlative award-winning service as they sail
                           to destinations around the world.
   www.seabourn.com
                           Windstar Cruises is one of the world’s highest rated cruise lines. A leader in the luxury
                           sail/cruise sector, Windstar offers travelers five-star accommodations and service
                           aboard four computer-controlled sailing vessels. Windstar’s ships cruise to destinations
                           in Europe, the Caribbean, Central America and Tahiti.

                           Holland America Tours is the largest cruise/tour operator in Alaska and the Canadian
                           Yukon. Tours owns and/or manages 12 hotels; more than 300 motor coaches; 13 private,
                      ®    domed rail cars and two luxury dayboats. Tours also markets sightseeing packages to
                           Holland America Line passengers and to the public.

www.windstarcruises.com
Financial Highlights
Carnival Corporation

                (In millions of dollars, except Earnings Per Share)            2001    2000     1999      1998     1997

                Revenues . . . . . . . . . . . . . . . . . . . . . . .     $ 4,536     $3,779   $3,497   $3,009   $2,447

                Net Income . . . . . . . . . . . . . . . . . . . . . .     $     926   $ 965    $1,027   $ 836    $ 666

                Earnings Per Share . . . . . . . . . . . . . . . .         $    1.58   $ 1.60   $ 1.66   $ 1.40   $ 1.12

                Cash From Operations . . . . . . . . . . . . . .           $ 1,239     $1,280   $1,330   $1,092   $ 878

                Total Assets . . . . . . . . . . . . . . . . . . . . . .   $11,564     $9,831   $8,286   $7,179   $5,427

                                                                                                                           Carnival Corporation 2001 Annual Report

                                                                                                                           1
To Our Shareholders:

                  I’ve always believed that the skills of a ship’s captain are best tested in rough waters. Likewise, the most telling test of a

                  company’s strength is its response to adversity. In 2001, our Company and our management teams were mightily tested by

                  a range of challenges that affected the entire leisure travel industry, including a global economic slowdown, a U.S. recession,

                  a struggling stock market and rising unemployment. Then, during our fourth fiscal quarter, we along with our nation were

                  dealt a heavy blow by the terrorist attacks of September 11th, after which many travelers chose not to fly, postponed vacations

                  they had not yet booked, and cancelled advance cruise bookings and other vacation plans. These were rough waters indeed,

                  and unlike any that we had ever navigated.

                  I am proud to report that Carnival Corporation’s solid, long-standing strategy and our strong balance sheet positioned us

                  exceedingly well to address these unexpected adversities, and our management teams overcame them with enormous skill

                  and determination.

                  During the year, we undertook several long-term strategic measures to bolster our competitive position. We transferred two

                  vessels from our North American brands to Costa Cruises to accelerate our near-term growth in the European vacation market

                  and maximize demand for cruise travel. We reduced our exposure to the higher-priced luxury segment by selling two small

                  ships and rationalizing our shoreside operations. We also fortified our balance sheet, selling our 25 percent investment in

                  Airtours plc for $500 million and opportunistically issuing two convertible debt offerings, using $1.1 billion in proceeds to

                  strengthen our financial position.

                                               We also engaged in several tactical moves to improve our position in the challenging post-

                                               September 11th travel environment. Guest safety and security has always been Carnival’s top
    “In light of the enormous
                                               priority, and we moved swiftly to institute even more intensive security measures. We furthered

    challenges that Carnival                   our strategy to position vessels in home ports close to vacationers, making it more convenient

                                               and affordable to take a cruise. We stimulated cruise bookings with aggressive price promotions
    faced in 2001, we are proud                that resulted in occupancy levels of nearly 98 percent in our fourth quarter, a powerful testament

    that we were the most                      to the attractiveness of our vacation offerings. We also worked to manage down our non-

                                               essential capital expenditures, even scaling back our 2001 Annual Report to generate savings.
    profitable company in the
                                               These concerted efforts permitted us to close the year with results that, once again, signifi-
    leisure travel business.”                  cantly outperformed the leisure travel industry. Revenues for the fiscal year rose to $4.54 billion,

                                               compared with $3.78 billion in 2000. Earnings per share were $1.58, nearly equal to the $1.60

                  we delivered in 2000. In light of the enormous challenges that Carnival faced in 2001, we are proud that we were the most

                  profitable company in the leisure travel business. Our ability to post these achievements is the direct result of prompt

                  actions taken at crucial moments during the year by our management teams and by our employees.

2
We also faced another major issue at year-end when we engaged in a heated battle

for control of P&O Princess Cruises plc. P&O Princess has long held appeal for

Carnival, and we viewed the potential acquisition as a one-time strategic opportunity         “As our industry continues
to secure two well-known brands and broaden Carnival’s diverse brand portfolio. We            to regain its strength, our
are pleased to report that we were successful in achieving a shareholder adjourn-             primary goals at Carnival
ment of the P&O Princess Extraordinary General Meeting on February 14, 2002,                  Corporation will be focused
which will allow us to continue our efforts to acquire P&O Princess. While the out-           on enhancing the onboard
come of our efforts cannot yet be determined, we are still moving ahead at full               experience of our guests,
steam to execute our other short- and long-term growth strategies, positioning our-           while maintaining our indus-
selves, as always, to perform at optimum levels.                                              try leadership by applying
                                                                                              a disciplined management
Steadiness and consistency are Carnival hallmarks, and despite the turbulent times
                                                                                              approach to our business.”
we faced in 2001, our growth strategies remain as focused as ever. We maintain our

strong commitment to our $6.2 billion new shipbuilding program, under which we

are constructing 14 exciting new vessels through 2005. In North America, our development program consists of five new

ships for Carnival Cruise Lines, including the first 2,974-berth Conquest-class ship—Carnival’s largest—which is slated for

launch in late 2002. It also encompasses four next-generation ships for Holland America Line that, at 1,848 berths each,

offer more than 25 percent greater guest capacity than any vessel ever built for Holland America Line.

Europe continues to offer significant growth opportunities for Carnival Corporation, and we are capitalizing on Costa’s

powerful brand recognition in Italy, France and Spain through the introduction of three new vessels specifically designed for

the European vacation market. We are also expanding Costa’s presence in Europe by offering a cruise product created to

appeal to the preferences of our German guests.

Cunard Line Limited also has two new ships under development. The Queen Mary 2, the first transatlantic ocean liner built

in more than 30 years, is scheduled to enter service in early fiscal 2004. The second vessel, ordered recently, will serve

British vacationers, and is slated for delivery approximately one year after the Queen Mary 2 is launched.

Carnival’s brands, which are the World’s Leading Cruise Lines, are the most diverse in our industry, and this positions us to

attract a larger share of the vacation market. We are greatly encouraged by the recovery in booking trends, and we are grat-    Carnival Corporation 2001 Annual Report

ified that our promotional activity has stimulated demand for cruising and attracted customers from other vacation choices.

As our industry continues to regain its strength, our primary goals at Carnival Corporation will be focused on enhancing the

onboard experience of our guests, while maintaining our industry leadership by applying a disciplined management approach

to our business.

                                                                                                                                3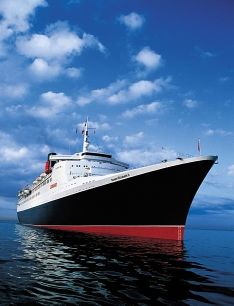
Shareholders’ Letter                                  (continued)

    Carnival is a company with a vast array of inherent strengths and for this reason we are confident and enthusiastic about our

    future. Our innovative new ships will provide a host of exciting amenities to meet the ever-increasing demands of our

    guests and attract a broad range of vacationers. Our cruises are a superior vacation option in every way, compared with land-

    based alternatives. We have a proven operating strategy and strong management teams to implement it. We are the most

    efficient, profitable and cost-effective company in the cruise industry, with the strongest operating and financial record, the

    best margins and the highest credit ratings. What’s more, we have delivered investor returns that are superior to any com-

    pany in our industry. The plain fact is that Carnival leads in every single way that counts—a status that we aim to maintain

    not just in 2002, but in the years to come.

    I began by saying that adversity is the test of a strong company and a skilled management—a test that Carnival and our peo-

    ple clearly passed with flying colors in 2001. However, adversity does more than merely test people. It also produces lead-

    ers, and I am proud to say that we have many at Carnival: Our management teams, who guided us well in difficult times; our

    shoreside employees, who extended their best efforts to mitigate the challenges of 2001; and our shipboard personnel, who

    worked diligently to make cruising on one of Carnival Corporation’s six brands the ultimate enjoyable and memorable vaca-

    tion experience. To all, we say a heartfelt thank you. We look forward to a rewarding and prosperous 2002.

                                                                                                       Micky Arison
                                                                                                       Chairman and Chief Executive Officer
                                                                                                       February 15, 2002

    Shareholder Benefit

    Carnival Corporation is pleased to extend the following benefit to our Shareholders:

    $250 Onboard credit per stateroom on sailings of 14 days or longer
    $100 Onboard credit per stateroom on sailings of 7–13 days
    $ 50 Onboard credit per stateroom on sailings of 6 days or less

    This benefit is applicable on sailings through July 31, 2003 aboard Carnival Cruise Lines, Costa Cruises, Cunard Line, Holland
    America Line, Seabourn Cruise Line and Windstar Cruises.
             This benefit is available to shareholders holding a minimum of 100 shares. Employees, travel agents cruising at travel
    agent rates, tour conductors or anyone cruising on a reduced-rate or complimentary basis are excluded from this offer. This
    benefit is not transferable, not combinable with any other shipboard offer and cannot be used for casino credits/charges and
    tips charged to your onboard account. Only one onboard credit per shareholder-occupied stateroom. Reservations must be
    made by February 28, 2003.
             Please provide your name, reservation number, ship and sailing date, along with proof of ownership of Carnival
    Corporation stock (i.e., photocopy of shareholder proxy card or a current brokerage statement) and the initial deposit to your
    travel agent or to the cruise line you have selected.

    C A R N I VA L C R U I S E L I N E S              H O L L A N D A M E R I C A L I N E / W I N D S TA R   C O S TA C R U I S E S         CUNARD LINE/SEABOURN
    Research Supervisor, Reservation Administration   Reservation Administration Agent                       Director, Passenger Services   Supervisor, Guest Services
    3655 N.W. 87th Avenue                             300 Elliott Avenue West                                200 S. Park Road, Suite 200    6100 Blue Lagoon Drive, #400
    Miami, FL 33178                                   Seattle, WA 98119                                      Hollywood, FL 33021            Miami, FL 33126
    Tel 800-438-6744 ext. 70041                       Tel 800-426-0327 ext. 4042                             Tel 800-462-6782               Tel 800-528-6273 ext. 1214
    Fax 305-406-5882                                  Fax 206-298-3059                                       Fax 954-266-2100               Fax 305-463-3038
4
Consolidated Balance Sheets
Carnival Corporation
November 30,
(in thousands, except par value) 2001 2000
ASSETS
Current Assets
Cash and cash equivalents . . . . . . . . . . . . . . . . . . . . . . . . . . . . . . . . . . . . . $ 1,421,300 $ 189,282
Short-term investments. . . . . . . . . . . . . . . . . . . . . . . . . . . . . . . . . . . . . . . . 36,784 5,470
Accounts receivable, net . . . . . . . . . . . . . . . . . . . . . . . . . . . . . . . . . . . . . . . 90,763 95,361
Inventories . . . . . . . . . . . . . . . . . . . . . . . . . . . . . . . . . . . . . . . . . . . . . . . . . 91,996 100,451
Prepaid expenses and other . . . . . . . . . . . . . . . . . . . . . . . . . . . . . . . . . . . . 113,798 158,918
Fair value of hedged firm commitments . . . . . . . . . . . . . . . . . . . . . . . . . . . 204,347
Total current assets . . . . . . . . . . . . . . . . . . . . . . . . . . . . . . . . . . . . . . . . . 1,958,988 549,482
Property and Equipment, Net. . . . . . . . . . . . . . . . . . . . . . . . . . . . . . . . . . . . 8,390,230 8,001,318
Investments in and Advances to Affiliates . . . . . . . . . . . . . . . . . . . . . . . . . 437,391
Goodwill, less Accumulated Amortization of $117,791 and $99,670 . . . . . 651,814 701,385
Other Assets . . . . . . . . . . . . . . . . . . . . . . . . . . . . . . . . . . . . . . . . . . . . . . . . . 188,915 141,744
Fair Value of Hedged Firm Commitments . . . . . . . . . . . . . . . . . . . . . . . . . . 373,605
$ 11,563,552 $9,831,320
LIABILITIES AND SHAREHOLDERS’ EQUITY
Current Liabilities
Current portion of long-term debt . . . . . . . . . . . . . . . . . . . . . . . . . . . . . . . . $ 21,764 $ 248,219
Accounts payable . . . . . . . . . . . . . . . . . . . . . . . . . . . . . . . . . . . . . . . . . . . . 269,467 332,694
Accrued liabilities . . . . . . . . . . . . . . . . . . . . . . . . . . . . . . . . . . . . . . . . . . . . 298,032 302,585
Customer deposits . . . . . . . . . . . . . . . . . . . . . . . . . . . . . . . . . . . . . . . . . . . 627,698 770,425
Dividends payable . . . . . . . . . . . . . . . . . . . . . . . . . . . . . . . . . . . . . . . . . . . . 61,548 61,371
Fair value of derivative contracts . . . . . . . . . . . . . . . . . . . . . . . . . . . . . . . . . 201,731
Total current liabilities . . . . . . . . . . . . . . . . . . . . . . . . . . . . . . . . . . . . . . . 1,480,240 1,715,294
Long-Term Debt . . . . . . . . . . . . . . . . . . . . . . . . . . . . . . . . . . . . . . . . . . . . . . 2,954,854 2,099,077
Deferred Income and Other Long-Term Liabilities. . . . . . . . . . . . . . . . . . . . 157,998 146,332
Fair Value of Derivative Contracts . . . . . . . . . . . . . . . . . . . . . . . . . . . . . . . . 379,683
Commitments and Contingencies (Notes 7 and 8)
Shareholders’ Equity
Common stock; $.01 par value; 960,000 shares authorized;
620,019 and 617,568 shares issued. . . . . . . . . . . . . . . . . . . . . . . . . . . .. 6,200 6,176
Carnival Corporation 2001 Annual Report
Additional paid-in capital . . . . . . . . . . . . . . . . . . . . . . . . . . . . . . . . . . . . . .. 1,805,248 1,772,897
Retained earnings . . . . . . . . . . . . . . . . . . . . . . . . . . . . . . . . . . . . . . . . . . .. 5,556,296 4,884,023
Unearned stock compensation . . . . . . . . . . . . . . . . . . . . . . . . . . . . . . . . .. (12,398) (12,283)
Accumulated other comprehensive loss . . . . . . . . . . . . . . . . . . . . . . . . . .. (36,932) (75,059)
Treasury stock; 33,848 and 33,087 shares at cost . . . . . . . . . . . . . . . . . . .. (727,637) (705,137)
Total shareholders’ equity . . . . . . . . . . . . . . . . . . . . . . . . . . . . . . . . . . . . 6,590,777 5,870,617
$11,563,552 $9,831,320
The accompanying notes are an integral part of these consolidated financial statements.
5Consolidated Statements of Operations
Carnival Corporation
Years Ended November 30,
(in thousands, except earnings per share) 2001 2000 1999
Revenues . . . . . . . . . . . . . . . . . . . . . . . . . . . . . . . . . . . . . . . . . . $4,535,751 $3,778,542 $3,497,470
Costs and Expenses
Operating . . . . . . . . . . . . . . . . . . . . . . . . . . . . . . . . . . . . . . . . 2,468,730 2,058,342 1,862,636
Selling and administrative . . . . . . . . . . . . . . . . . . . . . . . . . . . . 618,664 487,403 447,235
Depreciation and amortization . . . . . . . . . . . . . . . . . . . . . . . . . 372,224 287,667 243,658
Impairment charge . . . . . . . . . . . . . . . . . . . . . . . . . . . . . . . . . . 140,378
3,599,996 2,833,412 2,553,529
Operating Income Before (Loss) Income From
Affiliated Operations . . . . . . . . . . . . . . . . . . . . . . . . . . . . . . . 935,755 945,130 943,941
(Loss) Income From Affiliated Operations, Net . . . . . . . . . . . . (44,024) 37,828 75,758
Operating Income . . . . . . . . . . . . . . . . . . . . . . . . . . . . . . . . . . . 891,731 982,958 1,019,699
Nonoperating Income (Expense)
Interest income . . . . . . . . . . . . . . . . . . . . . . . . . . . . . . . . . . . . 34,255 16,506 41,932
Interest expense, net of capitalized interest . . . . . . . . . . . . . . . (120,692) (41,372) (46,956)
Other income, net . . . . . . . . . . . . . . . . . . . . . . . . . . . . . . . . . . 108,649 8,460 29,357
Income tax benefit (expense) . . . . . . . . . . . . . . . . . . . . . . . . . . 12,257 (1,094) (2,778)
Minority interest . . . . . . . . . . . . . . . . . . . . . . . . . . . . . . . . . . . (14,014)
34,469 (17,500) 7,541
Net Income . . . . . . . . . . . . . . . . . . . . . . . . . . . . . . . . . . . . . . . . $ 926,200 $ 965,458 $1,027,240
Earnings Per Share:
Basic . . . . . . . . . . . . . . . . . . . . . . . . . . . . . . . . . . . . . . . . . . . . $ 1.58 $ 1.61 $ 1.68
Diluted . . . . . . . . . . . . . . . . . . . . . . . . . . . . . . . . . . . . . . . . . . . $ 1.58 $ 1.60 $ 1.66
The accompanying notes are an integral part of these consolidated financial statements.
6Consolidated Statements of Cash Flows
Carnival Corporation
Years Ended November 30,
(in thousands) 2001 2000 1999
OPERATING ACTIVITIES
Net income . . . . . . . . . . . . . . . . . . . . . . . . . . . . . . .......... $ 926,200 $ 965,458 $1,027,240
Operating items not requiring cash:
Depreciation and amortization . . . . . . . . . . . . . .......... 372,224 287,667 243,658
Impairment charge . . . . . . . . . . . . . . . . . . . . .......... 140,378
Gain on sale of investments in affiliates, net . . .......... (116,698)
Loss (income) from affiliated operations
and dividends received . . . . . . . . . . . . . . . . .......... 56,910 (21,362) (60,671)
Minority interest . . . . . . . . . . . . . . . . . . . . . . . .......... 14,014
Other . . . . . . . . . . . . . . . . . . . . . . . . . . . . . . . .......... 21,199 (14,689) 4,007
Changes in operating assets and liabilities,
excluding businesses acquired and consolidated:
(Increase) decrease in:
Receivables . . . . . . . . . . . . . . . . . . . . . . . . .......... (7,134) (15,132) (3,271)
Inventories . . . . . . . . . . . . . . . . . . . . . . . . . .......... 8,455 (8,205) (8,570)
Prepaid expenses and other . . . . . . . . . . . . .......... 43,691 (21,972) (9,465)
(Decrease) increase in:
Accounts payable . . . . . . . . . . . . . . . . . . . . .......... (63,227) 58,133 27,333
Accrued and other liabilities . . . . . . . . . . . . .......... (335) (5,977) 58,016
Customer deposits . . . . . . . . . . . . . . . . . . . .......... (142,727) 55,614 37,433
Net cash provided by operating activities . . . . . . . . . . 1,238,936 1,279,535 1,329,724
INVESTING ACTIVITIES
Additions to property and equipment, net . . . . . . . . . . . . . . . . . . (826,568) (1,003,348) (872,984)
Proceeds from sale of investments in affiliates . . . . . . . . . . . . . . 531,225
Proceeds from sale of ships . . . . . . . . . . . . . . . . . . . . . . . . . . . . 15,000 51,350
Acquisition of consolidated subsidiaries, net . . . . . . . . . . . . . . . . (383,640) (54,715)
(Purchase of) proceeds from sale of
short-term investments, net . . . . . . . . . . . . .............. (33,395) 22,170 (11,890)
Other, net . . . . . . . . . . . . . . . . . . . . . . . . . . . .............. (28,178) 21,441 29,209
Net cash used in investing activities . . . . . . . . . . . . . . (341,916) (1,292,027) (910,380)
FINANCING ACTIVITIES
Proceeds from issuance of long-term debt . . . . . . . .......... 2,574,281 1,020,091 7,772
Purchase of treasury stock . . . . . . . . . . . . . . . . . . . .......... (705,137)
Principal repayments of long-term debt . . . . . . . . . .......... (1,971,026) (388,429) (564,838)
Dividends paid . . . . . . . . . . . . . . . . . . . . . . . . . . . . .......... (245,844) (254,333) (219,179)
Proceeds from issuance of common stock, net . . . .......... 5,274 7,811 741,575
Debt issuance costs . . . . . . . . . . . . . . . . . . . . . . . . .......... (25,531) (176)
Carnival Corporation 2001 Annual Report
Net cash provided by (used in) financing activities . . . . 337,154 (319,997) (34,846)
Effect of exchange rate changes on cash and
cash equivalents . . . . . . . . . . . . . . . . . . . . . . . . . . . . . . . . . . (2,156)
Net increase (decrease) in cash and
cash equivalents . . . . . . . . . . . . . . . . . . . . . . . . . . . 1,232,018 (332,489) 384,498
Cash and cash equivalents at beginning of year . . . . . . . . . . . . . 189,282 521,771 137,273
Cash and cash equivalents at end of year . . . . . . . . . . . . . . . . . . $ 1,421,300 $ 189,282 $ 521,771
The accompanying notes are an integral part of these consolidated financial statements.
7Consolidated Statements of Shareholders’ Equity
Carnival Corporation
Unearned Accumulated Total
Compre- Additional stock other share-
hensive Common paid-in Retained compen- comprehensive Treasury holders’
(in thousands) income stock capital earnings sation income (loss) stock equity
Balances at November 30, 1998 . . . . . $5,955 $ 880,488 $3,379,628 $ (5,294) $ 24,699 $ 1 $4,285,476
Comprehensive income:
Net income . . . . . . . . . . . . . . . . . $1,027,240 1,027,240 1,027,240
Foreign currency
translation adjustment . . . . . . . (19,209) (19,209) (19,209)
Changes in securities
valuation allowance . . . . . . . . . (4,374) (4,374) (4,374)
Total comprehensive income . . . $1,003,657
Cash dividends . . . . . . . . . . . . . . . . (230,370) (230,370)
Issuance of stock in
public offering, net . . . . . . . . . . . 170 725,062 725,232
Issuance of stock to acquire
minority interest in
Cunard Line Limited . . . . . . . . . . 32 127,037 127,069
Issuance of stock under
stock plans . . . . . . . . . . . . . . . . . 13 24,821 (7,326) 17,508
Amortization of unearned stock
compensation . . . . . . . . . . . . . . . 2,675 2,675
Balances at November 30, 1999 . . . . . 6,170 1,757,408 4,176,498 (9,945) 1,116 5,931,247
Comprehensive income:
Net income . . . . . . . . . . . . . . . . . $ 965,458 965,458 965,458
Foreign currency
translation adjustment . . . . . . . (73,943) (73,943) (73,943)
Changes in securities
valuation allowance, net . . . . . . (2,232) (2,232) (2,232)
Total comprehensive income . . . $ 889,283
Cash dividends . . . . . . . . . . . . . . . . (250,923) (250,923)
Issuance of stock under
stock plans . . . . . . . . . . . . . . . . . 6 15,489 (5,977) 9,518
Amortization of unearned stock
compensation . . . . . . . . . . . . . . . 3,639 3,639
Effect of conforming Costa’s
reporting period . . . . . . . . . . . . . . (7,010) (7,010)
Purchase of treasury stock . . . . . . . (705,137) (705,137)
Balances at November 30, 2000 . . . . . 6,176 1,772,897 4,884,023 (12,283) (75,059) (705,137) 5,870,617
Comprehensive income:
Net income . . . . . . . . . . . . . . . . . $ 926,200 926,200 926,200
Foreign currency
translation adjustment, net . . . 45,781 45,781 45,781
Changes in securities
valuation allowance, net . . . . . . 6,411 6,411 6,411
Minimum pension liability
adjustment . . . . . . . . . . . . . . . (5,521) (5,521) (5,521)
Changes related to cash flow
derivative hedges, net . . . . . . . (4,330) (4,330) (4,330)
Transition adjustment for
cash flow derivative hedges . . . (4,214) (4,214) (4,214)
Total comprehensive income . . . $ 964,327
Cash dividends . . . . . . . . . . . . . . . . (246,021) (246,021)
Issuance of stock under
stock plans . . . . . . . . . . . . . . . . . 24 32,351 (4,601) (22,500) 5,274
Amortization of unearned stock
compensation . . . . . . . . . . . . . . . 4,486 4,486
Effect of conforming Airtours’
reporting period . . . . . . . . . . . . . . (7,906) (7,906)
Balances at November 30, 2001 . . . . $6,200 $1,805,248 $5,556,296 $(12,398) $(36,932) $(727,637) $6,590,777
The accompanying notes are an integral part of these consolidated financial statements.
8Notes to Consolidated Financial Statements
Carnival Corporation
Note 1—General July, August and September, 2000, respectively, using
the equity method. As of November 30, 2000, we
Description of Business changed how we report Costa’s operating results from
Carnival Corporation is a Panamanian corporation and a two-month lag basis to reporting on Costa’s current
along with its consolidated subsidiaries is referred to month’s results. At that time, Costa’s operating results
collectively in these consolidated financial statements for the months of October and November 2000 were
and elsewhere in this 2001 Annual Report as “we,” recorded as a direct charge to retained earnings in our
“our” and “us.” We are a global vacation and leisure November 30, 2000 consolidated balance sheet and our
travel provider that operates six cruise lines under the November 30, 2000 consolidated balance sheet included
brand names Carnival Cruise Lines (“Carnival”), Costa Costa’s November 30, 2000 balance sheet. The impact
Cruises (“Costa”), Cunard Line (“Cunard”), Holland of conforming Costa’s reporting period on our fiscal
America Line (“Holland America”), Seabourn Cruise 2000 revenues, operating income and net income was
Line (“Seabourn”) and Windstar Cruises (“Windstar”) not material. Commencing in fiscal 2001, Costa’s results
and a tour business, Holland America Tours (“Tours”). of operations were consolidated on a current month
Carnival operates fifteen cruise ships with destinations basis in the same manner as our other wholly-owned
primarily to the Caribbean, the Bahamas and the Mexi- subsidiaries. See Note 17.
can Riviera. Holland America operates ten cruise ships
with destinations primarily to Alaska, the Caribbean and Cash and Cash Equivalents and
Europe. Costa operates seven cruise ships with desti- Short-Term Investments
nations primarily to Europe, the Caribbean and South Cash and cash equivalents include investments with
America. Cunard operates two premium/luxury cruise original maturities of three months or less and are
ships and Seabourn and Windstar each operate four stated at cost. At November 30, 2001 and 2000, cash
luxury ships with destinations to the Caribbean, Europe, and cash equivalents included $1.38 billion and $157
Central America and other worldwide locations. Tours is million of investments, respectively, primarily comprised
the largest cruise/tour operator in Alaska and the Canadi- of strong investment grade asset-backed debt obliga-
an Yukon. Tours also markets sightseeing packages tions and money market funds in 2001 and time deposits
both separately and as part of its cruise/tour packages. in 2000.
Short-term investments are comprised of marketable
Preparation of Financial Statements debt and equity securities which are categorized as
The preparation of our consolidated financial state- available for sale and, accordingly, are stated at their
ments in accordance with accounting principles generally fair values. Unrealized gains and losses are included
accepted in the United States of America requires us as a component of accumulated other comprehensive
to make estimates and assumptions that affect the income (loss) within shareholders’ equity (“AOCI”) until
amounts reported and disclosed in our financial state- realized. The specific identification method is used to
ments. Actual results could differ from these estimates. determine realized gains or losses.
All material intercompany accounts, transactions and
unrealized profits and losses on transactions within our Inventories
consolidated group and with affiliates are eliminated Inventories consist primarily of provisions, spare parts,
in consolidation. supplies and fuel carried at the lower of our weighted-
average cost or market.
Note 2—Summary of Significant Property and Equipment
Accounting Policies Property and equipment are stated at cost. Deprecia-
Basis of Presentation tion and amortization was computed using the straight-
We consolidate subsidiaries over which we have line method over our estimate of average useful lives
control, as typically evidenced by a direct ownership as follows:
Carnival Corporation 2001 Annual Report
interest of greater than 50%. For affiliates where sig- Years
nificant influence over financial and operating policies
Ships . . . . . . . . . . . . . . . . . . . . . . . . . 30
exists, as typically evidenced by a direct ownership
Buildings and improvements . . . . . . . 10-40
interest from 20% to 50%, the investment is accounted
Transportation equipment and other . . 2-20
for using the equity method. See Note 5. Leasehold improvements . . . . . . . . . Shorter of lease term
Prior to our acquisition of Costa in late fiscal 2000, or related asset life
we accounted for our 50% interest in Costa using the
equity method and recorded our portion of Costa’s We review our long-lived assets and goodwill for
operating results as earnings from affiliated operations impairment whenever events or changes in circum-
on a two-month lag basis. For September, October and stances indicate that the carrying amount of these
November, 2000, we continued to record our 50% assets may not be fully recoverable. The assessment
interest in Costa’s operating results for the months of of possible impairment is based on our ability to recover
9Notes to Consolidated Financial Statements (continued)
Carnival Corporation
the carrying value of our asset based on our estimate instruments be recorded on our balance sheet at their
of its undiscounted future cash flows. If these estimated fair values. Derivatives that are not hedges must be
future cash flows are less than the carrying value of the recorded at fair value and the changes in fair value
asset, an impairment charge is recognized for the dif- must be immediately included in earnings. If a deriva-
ference between the asset’s estimated fair value and tive is a fair value hedge, then changes in the fair value
its carrying value (see Notes 4 and 16). of the derivative are offset against the changes in the
Drydock costs are included in prepaid expenses and fair value of the underlying hedged firm commitment.
are amortized to operating expenses using the straight- If a derivative is a cash flow hedge, then changes in the
line method generally over one or two years. fair value of the derivative are recognized as a compo-
Ship improvement costs that we believe add value to nent of AOCI until the underlying hedged item is recog-
our ships are capitalized to the ships, and depreciated nized in earnings. The ineffective portion of a hedge
over the improvements’ estimated useful lives, while derivative’s change in fair value is immediately recog-
costs of repairs and maintenance are charged to expense nized in earnings. We formally document all relation-
as incurred. We capitalize interest on ships and other ships between hedging instruments and hedged items,
capital projects during the construction period. Upon as well as our risk management objectives and strate-
the replacement or refurbishment of previously capital- gies for undertaking our hedge transactions.
ized ship components, these assets’ estimated cost The total $578 million of current and long-term
and accumulated depreciation are written-off and any fair value of hedged firm commitment assets on our
resulting gain or loss is recognized in operations. No November 30, 2001 balance sheet, principally includes
material gains or losses were recognized in fiscal 2001, $567 million of unrealized gains on our shipbuilding
2000 or 1999. See Note 3. commitments denominated in foreign currencies
because of the strengthening of the dollar compared
Investments in Affiliates
to the euro. In addition, the total $581 million of fair
At November 30, 2000, the costs in excess of the
value of derivative contract liabilities on our November 30,
net assets acquired (“goodwill”) of our affiliate, Airtours
2001 balance sheet, principally includes $567 million of
plc (“Airtours”), was $195 million. Goodwill was amor-
unrealized losses on our forward foreign currency con-
tized using the straight-line method, principally over
tracts relating to those same shipbuilding commitments,
40 years and was recorded as “(Loss) Income from
which are used to fix the cost of our shipbuilding com-
Affiliated Operations, Net” in the accompanying state-
mitments in U.S. dollars, and effectively offsets the
ments of operations (see Notes 5 and 16).
related hedged firm commitment assets.
Goodwill We classify the fair value of our derivative contracts
Goodwill was amortized using the straight-line method and the offsetting fair value of our hedged firm commit-
over 40 years. At November 30, 2001, goodwill con- ments as either current or long-term liabilities and
sisted of $275 million from our acquisition of HAL assets depending on whether the maturity date of the
Antillen, N.V., the parent company of Holland America, derivative contract is within or beyond one year from
Windstar and Tours, $235 million from our acquisition our balance sheet date, respectively. The cash flows
of Cunard and $260 million from our fiscal 2000 acqui- from derivatives treated as hedges are classified in our
sition of Costa (see Notes 4 and 16). statements of cash flows in the same category as the
item being hedged.
Derivative Instruments and Hedging Activities
Upon adoption of SFAS No. 133 on December 1,
We utilize derivative instruments, currently forward
2000, our recorded assets and liabilities each increased
and swap contracts, to limit our exposure to fluctua-
by approximately $540 million. This increase in assets
tions in foreign currency exchange rates, to manage
and liabilities primarily represented the recording of off-
our interest rate exposure, and to achieve a desired
setting unrealized gains and losses on our shipbuilding
proportion of variable and fixed rate debt (see Note 11).
contracts and related foreign currency forward con-
Our most significant contracts to buy foreign cur-
tracts, respectively. In accordance with the transition
rency are forward contracts entered into to fix the cost
provisions of SFAS No. 133, we recorded an adjust-
in United States (“U.S.”) dollars of ten of our foreign
ment of $4.2 million in AOCI to record the unrealized
currency denominated shipbuilding commitments (see
net losses from our cash flow hedges that existed on
Note 7). If our shipbuilding contract is denominated in
December 1, 2000.
the functional currency of the cruise line that is expected
Derivative gains and losses included in AOCI are
to be operating the ship, we do not enter into a forward
reclassified into earnings at the same time the underly-
contract to hedge that commitment.
ing hedged transaction is recorded in earnings. During
Effective December 1, 2000, we adopted Statement
fiscal 2001, all net changes in the fair value of both our
of Financial Accounting Standards (“SFAS”) No. 133, as
fair value hedges and the offsetting hedged firm com-
amended, “Accounting for Derivative Instruments and
mitments and our cash flow hedges were immaterial,
Hedging Activities,” which requires that all derivative
as were any ineffective portions of these hedges. No
10fair value hedges or cash flow hedges were derecog- Foreign Currency Translations and Transactions
nized or discontinued in fiscal 2001, and the amount of For our foreign subsidiaries and affiliates using the
estimated unrealized net losses which are expected local currency as their functional currency, assets and
to be reclassified to earnings in the next twelve months liabilities are translated at exchange rates in effect at
is not material. At November 30, 2001, AOCI included the balance sheet dates. Translation adjustments result-
$8.5 million of unrealized net losses from cash flow ing from this process are reported in AOCI. Revenues
hedge derivatives, which were substantially all variable and expenses of these foreign subsidiaries and affili-
to fixed interest rate swap agreements. ates are translated at weighted-average exchange rates
Finally, if any of the three shipyards with which we for the period. Exchange gains and losses arising from
have contracted to build our ships is unable to perform, transactions denominated in a currency other than the
we would still be required to perform under our foreign functional currency of the entity involved are immedi-
currency forward contracts related to that shipyard’s ately included in our earnings.
shipbuilding contracts. Accordingly, based upon the
Earnings Per Share
circumstances, we may have to discontinue the account-
Basic earnings per share is computed by dividing net
ing for those forward contracts as hedges, if the ship-
income by the weighted-average number of shares of
yard can not perform.
common stock outstanding during each period. Diluted
Prior to fiscal 2001, changes in the fair values of and
earnings per share is computed by dividing net income,
any discounts or premiums on, our shipbuilding forward
as adjusted, by the weighted-average number of shares
foreign currency contract hedges were recorded at
of common stock, common stock equivalents and other
maturity, which coincided with the dates when the
potentially dilutive securities outstanding during each
related foreign currency payments were to be made,
period. See Note 14.
with any resulting gains or losses recorded as a decrease
or increase, respectively, to the cost paid for our ships. Stock-Based Compensation
Prior to fiscal 2001, the fair values of our interest rate We account for our employee and director stock-
swap agreements were not recorded in our financial based compensation using the intrinsic value method
statements. Any differences paid or received on interest and disclose fair value pro forma information (see
rate swap hedges were recognized as adjustments to Note 13).
interest expense over the life of the swap, thereby adjust-
Concentrations of Credit Risk
ing the effective interest rate on our underlying debt.
As part of our ongoing control procedures, we moni-
Revenue and Expense Recognition tor concentrations of credit risk associated with finan-
Guest cruise deposits represent unearned revenues cial and other institutions with which we conduct
and are initially recorded as customer deposit liabilities significant business. Credit risk, including counterparty
on our balance sheet when received. Customer depos- nonperformance under derivative instruments, contin-
its are subsequently recognized as cruise revenues, gent obligations and new ship progress payment guar-
together with revenues from onboard activities and all antees, is considered minimal, as we primarily conduct
associated direct costs of a voyage, generally upon business with large, well-established financial institu-
completion of voyages with durations of ten days or tions who have long-term credit ratings of A or above.
less and on a pro rata basis for voyages in excess of In addition, we have established guidelines regarding
ten days. Revenues and expenses from our tour and credit ratings and investment maturities that seek to
related services are recognized at the time the services maintain safety and liquidity.
are performed or expenses are incurred. We also monitor the creditworthiness of our cus-
In fiscal 2001, we adopted Staff Accounting Bulletin tomers to which we grant credit terms in the normal
(“SAB”) 101, “Revenue Recognition in Financial State- course of our business. Concentrations of credit risk
ments” which provides guidance on the recognition, associated with these receivables are considered mini-
Carnival Corporation 2001 Annual Report
presentation and disclosure of revenues in financial mal primarily due to their short maturities. We have
statements. Our adoption of this SAB did not have a experienced only minimal credit losses on our trade
material impact on our financial statements. receivables. We do not normally require collateral or
other security to support normal credit sales. However,
Advertising Costs
we do normally require collateral and/or guarantees to
Substantially all of our advertising costs are charged
support notes receivable on significant asset sales and
to expense as incurred, except costs which result in
new ship progress payments to shipyards.
tangible assets, such as brochures, which are recorded
as prepaid expenses and charged to expense as con- Reclassifications
sumed. Advertising expenses totaled $214 million in Reclassifications have been made to prior year
fiscal 2001, $181 million in fiscal 2000 and $178 million amounts to conform to the current year presentation.
in fiscal 1999. At November 30, 2001 and 2000, the
amount of advertising related costs included in prepaid
expenses was not material.
11Notes to Consolidated Financial Statements (continued)
Carnival Corporation
Note 3—Property and Equipment The note receivable and ship fair values were based
on third party appraisals or negotiations with unrelated
Property and equipment consisted of the following third parties, and the fair values of the goodwill and
(in thousands): hotels were based on our estimates of discounted
November 30,
future cash flows.
2001 2000
Ships . . . . . . . . . . . . . . . . . . . $ 8,892,412 $ 8,575,563 Note 5—Investments In and
Ships under construction . . . . 592,781 320,480
Advances to Affiliates
9,485,193 8,896,043
Land, buildings and On June 1, 2001, we sold our investment in Airtours,
improvements . . . . . . . . . . . 264,294 275,203 which resulted in a nonoperating net gain of $101 mil-
Transportation equipment lion and net cash proceeds of $492 million. Cumulative
and other . . . . . . . . . . . . . . 349,188 314,417 foreign currency translation losses of $59 million were
Total property and equipment . . 10,098,675 9,485,663 reclassified from AOCI and included in determining
Less accumulated depreciation this 2001 net gain. We also recorded a direct charge
and amortization . . . . . . . . . (1,708,445) (1,484,345) of $8 million to our retained earnings in fiscal 2001,
$ 8,390,230 $ 8,001,318
which represented our share of Airtours’ losses for
April and May 2001, since Airtours’ results were
Capitalized interest, primarily on our ships under reported on a two-month lag.
construction, amounted to $29 million in fiscal 2001 In fiscal 2001, we sold our interest in CRC Holdings,
and $41 million in both fiscal 2000 and fiscal 1999. Inc. (“CRC”) to an unrelated third party, which resulted
Ships under construction include progress payments in a nonoperating net gain of $16 million and net cash
for the construction of the ship, as well as design and proceeds of $39 million. One of the members of our
engineering fees, capitalized interest, construction Board of Directors was a principal shareholder in CRC.
oversight costs and various owner supplied items. At Dividends received from affiliates were $13 million,
November 30, 2001, two ships with an aggregate net $16 million and $15 million in fiscal 2001, 2000 and
book value of $617 million were pledged as collateral 1999, respectively, which reduced the carrying value
pursuant to a $126 million note and a $430 million of our investments in affiliates in accordance with the
contingent obligation (see Notes 6 and 8). equity method of accounting.
Maintenance and repair expenses and drydock amor- At November 30, 2000, affiliated companies that
tization were $160 million, $132 million and $113 million we accounted for using the equity method, excluding
in fiscal 2001, 2000 and 1999, respectively. Costa, had current assets, long-term assets, current
liabilities, long-term liabilities and shareholders’ equity
Note 4—Impairment Charge of $2.27 billion, $1.98 billion, $1.85 billion, $1.53 billion
and $870 million, respectively.
During fiscal 2001, we reviewed our long-lived assets Income statement and segment information for our
and goodwill for which there were indications of possi- affiliated companies accounted for using the equity
ble impairment. The assets we reviewed were primarily method, including Airtours and Costa, was as follows
from our Cunard and Seabourn brands, since we had (in thousands):
experienced continued losses from these brands and
Fiscal Years Ended
had recently restructured their operations and made
2000 1999
changes to their senior management. In addition, we
reviewed a Holland America note receivable collateral- Revenues . . . . . . . . . . . . . . . ... $6,669,052 $5,963,425
Gross margin . . . . . . . . . . . . ... $1,345,593 $1,265,614
ized by a ship, the former Nieuw Amsterdam, which
Operating income . . . . . . . . . ... $ 5,114 $ 359,953
we sold to a company whose parent declared bank-
Depreciation and amortization ... $ 152,123 $ 133,302
ruptcy in the fourth quarter of fiscal 2001. Based on Net income . . . . . . . . . . . . . ... $ 19,770 $ 255,146
these reviews, we recorded an impairment charge, Capital expenditures . . . . . . . ... $ 650,098 $ 356,267
including a loss on the sale of two Seabourn ships,
of approximately $140 million in fiscal 2001, including Since we sold our interest in Airtours and CRC during
$39 million in the fourth quarter of 2001. This charge fiscal 2001, no data has been presented for fiscal 2001.
included a $36 million write-off of Seabourn’s goodwill
balance; a $71 million reduction in the carrying value of
ships, primarily those operated by Cunard and Seabourn;
a $15 million write-down of the Holland America note
receivable; an $11 million loss from the sale of the
Seabourn Goddess I and II; and a $6 million write-down
of the carrying value of two of Tours’ hotel properties.
12Note 6 —Long-Term Debt redeem all or a portion of the notes at their face value
plus any unpaid accrued interest. In addition, on April 15
Long-term debt consisted of the following of 2005, 2008 and 2011 the noteholders may require
(in thousands): us to repurchase all or a portion of the outstanding notes
November 30, at their face value plus any unpaid accrued interest.
2001(a) 2000(a) Upon conversion, redemption or repurchase of the
Euro note, secured by one ship, notes we may choose to deliver common stock, cash
bearing interest at euribor or a combination of cash and common stock with a
plus 0.5% (4.8% and 5.7% total value equal to the value of the consideration other-
at November 30, 2001 and wise deliverable. See Note 14.
2000, respectively), due In October 2001, we received net proceeds of $489
through 2008 . . . . . . . . . . . . . $ 125,770 $ 141,628 million from the issuance of zero-coupon convertible
Unsecured notes, bearing notes. These notes have a yield to maturity of 3.75%
interest at rates ranging
and are convertible commencing on March 1, 2002 into
from 6.15% to 7.7%, due
17.4 million shares of our common stock, based on a
through 2028(b) . . . . . . . . . . . 848,779 848,657
Unsecured euro notes, bearing
conversion rate, subject to adjustment, of 16.5964
interest at rates ranging from shares for each $1,000 principal amount at maturity of
euribor plus 0.19% to euribor notes. The conversion feature is contingent upon the
plus 1.0% (3.9% to 4.9% and price of our common stock reaching certain targeted
5.2% to 6.1% at November 30, levels, also subject to adjustment. These levels com-
2001 and 2000, respectively), mence at a low of $31.94 per share in fiscal 2002 and
due 2005 and 2006 . . . . . . . . 604,068 814,076 increase quarterly to $65.92 per share in fiscal 2021.
Unsecured euro notes, Subsequent to October 23, 2008, we may redeem all
bearing interest at 5.57%, or a portion of the notes at their accreted values. In
due in 2006 . . . . . . . . . . . . . . 266,223
addition, on October 24 of 2006, 2008, 2011 and 2016
Unsecured 2% convertible
the noteholders may require us to repurchase all or a
notes, due in 2021 . . . . . . . . . 600,000
Unsecured zero-coupon portion of the outstanding notes at their accreted values.
convertible notes, net of Upon conversion, redemption or repurchase of the
discount, with a face value notes we may choose to deliver common stock, cash
of $1.05 billion, due in 2021 . . 501,945 or a combination of cash and common stock with a
Commercial paper, bearing total value equal to the value of the consideration
interest at 6.6% . . . . . . . . . . 342,846 otherwise deliverable. See Note 14.
$200 million multi-currency In May 2001, Costa entered into a five-year $231
revolving credit facility million unsecured euro denominated revolving credit
drawn in euros, bearing
facility of which $137 million was available at Novem-
interest at 5.3% at
ber 30, 2001.
November 30, 2000 . . . . . . . . 160,862
Other . . . . . . . . . . . . . . . . . . . . 29,833 39,227
Effective July 2001, we replaced our $1 billion
unsecured revolving credit facility and our $200 million
2,976,618 2,347,296
unsecured multi-currency revolving credit facility with
Less portion due within
a $1.4 billion unsecured multi-currency revolving credit
one year . . . . . . . . . . . . . . . . (21,764) (248,219)
facility, due June 2006. The new revolving credit facility
$2,954,854 $2,099,077 bears interest at libor/euribor plus 17 basis points
(“BPS”), which will vary based on changes to our sen-
(a) All borrowings are in U.S. dollars unless otherwise noted.
ior unsecured long-term debt ratings, and provides for
Euro denominated notes have been translated to U.S.
Carnival Corporation 2001 Annual Report
dollars at the period end exchange rate. At November 30,
an undrawn facility fee of eight BPS. Our commercial
2001 and 2000, approximately 66% and 52% of our debt paper program is supported by this revolving credit
was U.S. dollar denominated and 34% and 48% was euro facility and, accordingly, any amounts outstanding under
denominated, respectively. our commercial paper program reduce the aggregate
(b) These notes are not redeemable prior to maturity. amount available under this facility. Since our commer-
cial paper was backed by our long-term revolving credit
In April 2001, we issued $600 million of unsecured facilities, balances outstanding under our commercial
2% notes that are convertible into 15.3 million shares paper programs were classified as long-term in our
of our common stock at a conversion price of $39.14 November 30, 2000 balance sheet. At November 30,
per share, subject to adjustment, contingent upon the 2001, our entire $1.4 billion facility was available. This
price of our common stock being greater than 110% of facility and other of our loan agreements contain cove-
the conversion price. This condition was not met during nants that require us, among other things, to maintain
fiscal 2001. Subsequent to April 14, 2008, we may a minimum debt service coverage and limit our debt to
13Notes to Consolidated Financial Statements (continued)
Carnival Corporation
tangible capital ratio. In addition, our ability to draw Debt issuance costs are generally amortized to inter-
upon the then available portion of our $1.4 billion credit est expense using the straight-line method over the
facility could be terminated if our business suffers a term of the notes or to the noteholders first put option
material adverse change. At November 30, 2001, we date, whichever is earlier. In addition, all loan issue
were in compliance with all of our debt covenants. discounts are amortized to interest expense using the
At November 30, 2001, the scheduled annual maturi- effective interest method over the term of the notes.
ties of our long-term debt was as follows (in thousands):
Fiscal
2002 . . . . . . . . . . . . . . . . . . . . . . . . . . . . . . . . $ 21,764
2003 . . . . . . . . . . . . . . . . . . . . . . . . . . . . . . . . 145,897
2004 . . . . . . . . . . . . . . . . . . . . . . . . . . . . . . . . 140,209
2005 . . . . . . . . . . . . . . . . . . . . . . . . . . . . . . . . 885,365(a)
2006 . . . . . . . . . . . . . . . . . . . . . . . . . . . . . . . . 1,226,860(a)
Thereafter . . . . . . . . . . . . . . . . . . . . . . . . . . . . 556,523
$2,976,618
(a) Includes our 2% convertible notes in 2005 and our zero-
coupon convertible notes in 2006 based on the date of the
noteholders first put option.
Note 7—Commitments
Ship Commitments
A description of our ships under contract for construction at November 30, 2001 was as follows (in millions, except
passenger capacity data):
Expected Estimated
Service Passenger Total
Ship Date(1) Shipyard Capacity(2) Cost(3)
Carnival:
Carnival Pride(4) . . . . . . . . . . . . . . . . . . . . . . . . . . . . . . . . . . . . . . . . . . . . . 12/01 Masa-Yards(5) 2,124 $ 375
Carnival Legend . . . . . . . . . . . . . . . . . . . . . . . . . . . . . . . . . . . . . . . . . . . . 8/02 Masa-Yards(5) 2,124 375
Carnival Conquest . . . . . . . . . . . . . . . . . . . . . . . . . . . . . . . . . . . . . . . . . . . 12/02 Fincantieri 2,974 500
Carnival Glory . . . . . . . . . . . . . . . . . . . . . . . . . . . . . . . . . . . . . . . . . . . . . . 8/03 Fincantieri 2,974 500
Carnival Miracle . . . . . . . . . . . . . . . . . . . . . . . . . . . . . . . . . . . . . . . . . . . . 4/04 Masa-Yards(5) 2,124 375
Carnival Valor . . . . . . . . . . . . . . . . . . . . . . . . . . . . . . . . . . . . . . . . . . . . . . 11/04 Fincantieri(5) 2,974 500
Total Carnival . . . . . . . . . . . . . . . . . . . . . . . . . . . . . . . . . . . . . . . . . . . . . 15,294 2,625
Holland America:
Zuiderdam . . . . . . . . . . . . . . . . . . . . . . . . . . . . . . . . . . . . . . . . . . . . . . . . 12/02 Fincantieri(5) 1,848 410
Oosterdam . . . . . . . . . . . . . . . . . . . . . . . . . . . . . . . . . . . . . . . . . . . . . . . . 7/03 Fincantieri(5) 1,848 410
Newbuild . . . . . . . . . . . . . . . . . . . . . . . . . . . . . . . . . . . . . . . . . . . . . . . . . 5/04 Fincantieri(5) 1,848 410
Newbuild . . . . . . . . . . . . . . . . . . . . . . . . . . . . . . . . . . . . . . . . . . . . . . . . . 11/05 Fincantieri(5) 1,848 410
Total Holland America . . . . . . . . . . . . . . . . . . . . . . . . . . . . . . . . . . . . . . 7,392 1,640
Costa:
Costa Mediterranea . . . . . . . . . . . . . . . . . . . . . . . . . . . . . . . . . . . . . . . . . 7/03 Masa-Yards(6) 2,114 335
Costa Fortuna . . . . . . . . . . . . . . . . . . . . . . . . . . . . . . . . . . . . . . . . . . . . . . 1/04 Fincantieri(6) 2,720 390
Costa Magica . . . . . . . . . . . . . . . . . . . . . . . . . . . . . . . . . . . . . . . . . . . . . . 12/04 Fincantieri(6) 2,720 390
Total Costa . . . . . . . . . . . . . . . . . . . . . . . . . . . . . . . . . . . . . . . . . . . . . . 7,554 1,115
Cunard:
Queen Mary 2 . . . . . . . . . . . . . . . . . . . . . . . . . . . . . . . . . . . . . . . . . . . . . 12/03 Chantiers de
l’Atlantique(5) 2,620 780
Newbuild(7) . . . . . . . . . . . . . . . . . . . . . . . . . . . . . . . . . . . . . . . . . . . . . . . . 2/05 Fincantieri(5) 1,968 410
Total Cunard . . . . . . . . . . . . . . . . . . . . . . . . . . . . . . . . . . . . . . . . . . . . . 4,588 1,190
Total . . . . . . . . . . . . . . . . . . . . . . . . . . . . . . . . . . . . . . . . . . . . . . . . . 34,828 $6,570
14(1) The expected service date is the date the ship is currently Operating Leases
expected to begin its first revenue generating cruise. Rent expense under our operating leases, primarily
(2) In accordance with cruise industry practice, passenger for office and warehouse space, was $13 million in
capacity is calculated based on two passengers per cabin fiscal 2001 and $10 million in both fiscal 2000 and fiscal
even though some cabins can accommodate three or
1999. At November 30, 2001, minimum annual rentals
four passengers.
for our operating leases, with initial or remaining terms
(3) Estimated total cost of the completed ship includes the
contract price with the shipyard, design and engineering in excess of one year, were as follows (in thousands):
fees, capitalized interest, various owner supplied items and
construction oversight costs. Fiscal
(4) On December 14, 2001, we accepted delivery of the 2002 . . . . . . . . . . . . . . . . . . . . . . . . . . . . . . . . . . . $10,100
Carnival Pride. 2003 . . . . . . . . . . . . . . . . . . . . . . . . . . . . . . . . . . . 8,600
(5) These construction contracts are denominated in euros and 2004 . . . . . . . . . . . . . . . . . . . . . . . . . . . . . . . . . . . 7,700
have been fixed into U.S. dollars through the utilization of 2005 . . . . . . . . . . . . . . . . . . . . . . . . . . . . . . . . . . . 7,600
forward foreign currency contracts. At November 30, 2001, 2006 . . . . . . . . . . . . . . . . . . . . . . . . . . . . . . . . . . . 7,500
the $567 million of unrealized losses from these forward Thereafter . . . . . . . . . . . . . . . . . . . . . . . . . . . . . . . 22,300
contracts has been recorded as fair value of derivative con-
$63,800
tract liabilities on our November 30, 2001 balance sheet
and are also included in the above estimated total cost of
these construction contracts. Note 8—Contingencies
(6) These construction contracts are denominated in euros,
which is Costa’s functional currency. The estimated total Litigation
costs have been translated into U.S. dollars using the Several actions have been filed against Costa, Cunard
November 30, 2001 exchange rate. and Tours alleging that they violated the Americans
(7) This construction contract and related forward contracts with Disabilities Act (“ADA”) by failing to make certain
were transferred from Holland America to Cunard in cruise ships accessible to individuals with disabilities
December 2001.
(collectively the “ADA Complaints”). Plaintiffs seek
injunctive relief and fees and costs. These actions
In addition to these ship construction contracts, in are proceeding.
December 2001, we entered into one shipbuilding Several actions filed in the U.S. District Court for the
option with Fincantieri for a May 2006 delivery date. Southern District of Florida against us and four of our
No assurance can be given as to whether we will exer- executive officers on behalf of a purported class of pur-
cise this option. chasers of our common stock were consolidated into
In connection with our ships under contract for con- one action in Florida (the “Stock Purchase Complaint”).
struction, we have paid approximately $593 million The plaintiffs have claimed that statements we made in
through November 30, 2001 and anticipate paying the public filings violated federal securities laws and seek
remaining estimated total cost as follows (in millions): unspecified compensatory damages and attorney and
expert fees and costs. This action is proceeding.
Fiscal
The ultimate outcomes of the pending ADA and Stock
2002 . . . . . . . . . . . . . . . . . . . . . . . . . . . . . . . . . . . . $1,751 Purchase Complaints cannot be determined at this time.
2003 . . . . . . . . . . . . . . . . . . . . . . . . . . . . . . . . . . . . 1,501 We believe that we and our executive officers have
2004 . . . . . . . . . . . . . . . . . . . . . . . . . . . . . . . . . . . . 2,037
meritorious defenses to these claims and, accordingly,
2005 . . . . . . . . . . . . . . . . . . . . . . . . . . . . . . . . . . . . 688
we intend to vigorously defend against these actions.
$5,977 In August 2000, we received a grand jury subpoena
requesting that we produce documents and records
Port Facilities concerning environmental matters. We produced docu-
Carnival Corporation 2001 Annual Report
At November 30, 2001, we had commitments through ments in response to the subpoena and are engaged
2023, with initial or remaining terms in excess of one in settlement discussions with the Office of the U.S.
year, to pay minimum amounts for our annual usage of Attorney for the Southern District of Florida. No charges
port facilities as follows (in thousands): have been lodged against us. In the event that the
investigation results in adverse findings with regard to
Fiscal our compliance with U.S. laws pertaining to the envi-
2002 . . . . . . . . . . . . . . . . . . . . . . . . . . . . . . . . . . $ 21,831 ronment, a judgment could include fines and mandatory
2003 . . . . . . . . . . . . . . . . . . . . . . . . . . . . . . . . . . 18,947 provisions relating to future compliance practices, among
2004 . . . . . . . . . . . . . . . . . . . . . . . . . . . . . . . . . . 19,318 other forms of relief. However, the ultimate outcome
2005 . . . . . . . . . . . . . . . . . . . . . . . . . . . . . . . . . . 20,667 of this matter cannot be determined at this time.
2006 . . . . . . . . . . . . . . . . . . . . . . . . . . . . . . . . . . 19,211
Thereafter . . . . . . . . . . . . . . . . . . . . . . . . . . . . . . 178,405
$278,379
15You can also read