Who Votes Right-Wing Populist? Geographical and Individual Factors in Seven German State Elections 14/2018 - Bibliothek der Friedrich-Ebert-Stiftung
←
→
Page content transcription
If your browser does not render page correctly, please read the page content below

D I S K U R S
14/ 2018
Heiko Giebler and Sven Regel

Who Votes Right-Wing Populist?
Geographical and Individual Factors
in Seven German State Elections

WISO DISKURS
14 / 2018

Friedrich-Ebert-Stiftung
The Friedrich-Ebert-Stiftung (FES) is the oldest political foundation in Germany with
a rich tradition dating back to its foundation in 1925. Today, it remains loyal to
the legacy of its namesake and campaigns for the core ideas and values of social
democracy: freedom, justice and solidarity. It has a close connection to social
democracy and free trade unions.

FES promotes the advancement of social democracy, in particular by:
– political educational work to strengthen civil society;
– think tanks;
– international cooperation with our international network of offices
   in more than 100 countries;
– support for talented young people;
– maintaining the collective memory of social democracy with archives,
   libraries and more.

The Division for Economic and Social Policy
The Division for Economic and Social Policy of the Friedrich-Ebert-Stiftung advises
and informs politics and society in Germany about important current issues and
policy making concerning social, economic and environmental developments.

WISO Diskurs
WISO Diskurs are detailed analyses examining political issues and questions,
containing sound policy recommendations and contributing to scientifically based
policy consultation.

About the authors
Dr. Heiko Giebler is a researcher in the Democracy and Democratisation Depart-
ment at the WZB Berlin Social Science Center. His research interests include elections
and attitudes. In 2017 he became co-head of the WZB project “Against Elites,
Against Outsiders: Sources of Democracy Critique, Immigration Critique, and Right-
Wing Populism”.
Sven Regel is a researcher in the Democracy and Democratisation Department
at the WZB Berlin Social Science Center. His research interests include parties and
representatives, and electoral geography.

Persons responsible in the FES for this publication
Dr. Philipp Fink is head of the climate, environment, energy and structural policy
desk in the Division for Economic and Social Policy at Friedrich-Ebert-Stiftung.
14/ 2018                                                            WISO DISKURS

Heiko Giebler and Sven Regel

Who Votes Right-Wing Populist?
Geographical and Individual Factors
in Seven German State Elections

 3          FOREWORD

 4          SUMMARY

 5    1     INTRODUCTION

 6    2     BACKGROUND AND OBJECTIVES
 8    3     VOTING BEHAVIOUR MODELS AND RIGHT-WING POPULISM

11    4     METHODOLOGY

12    5     REGIONAL DISPARITIES AND THE AFD VOTE AT DISTRICT LEVEL
12    5.1   Regional disparities at district level
14    5.2   Explaining the AfD vote at district level

17    6     DETERMINANTS OF INDIVIDUAL VOTE CHOICE
17    6.1   General patterns of individual vote choice
18    6.2   Specific patterns of vote choice in the states

22    7     CONCLUSIONS

24    8     APPENDIX
24    8.1   Data, methodology and detailed findings for chapter 5
25    8.2   Data, methodology and detailed findings for chapter 6

28          List of Figures
28          List of Tables
29          References
30          Datasets and Sources
FRIEDRICH-EBERT-STIFTUNG – Wirtschafts- und Sozialpolitik
WHO VOTES RIGHT-WING POPULIST?                                                                     WISO DISKURS   3

FOREWORD

Recent years have seen the rise of right-wing populist parties       DR. PHILIPP FINK
and movements in the Netherlands, the UK and France. Germany,        Division for Economic and Social Policy
too, has experienced a sharp uptick in popular support for the       Friedrich-Ebert-Stiftung
right-wing populist spectrum. The right-wing populist Alter-
native für Deutschland (AfD) entered the German Bundestag
in 2017, and is now represented in fourteen state legislatures.
    Various explanations are offered for these developments.
Sometimes it is argued that voters turn to right-wing populist
parties to express their frustration with the established poli-
tical parties. Or they are dissatisfied with their government,
especially over its handling of the refugee question. Or they
feel their own worries and concerns are not being taken seri-
ously. Sometimes it is also argued that support for right-wing
populism is concentrated in depopulating, structurally weak
regions with high unemployment. And that authoritarian,
chauvinistic and xenophobic attitudes are now finding ex-
pression at the polling station. But how much of this stands
the test of empirical scrutiny? And which aspects contribute
most to explaining the phenomenon?
    In the research presented here, Dr. Heiko Giebler and Sven
Regel from WZB Berlin Social Science Center present answers
to these questions based on their analysis of the results of
recent state elections. They include socio-economic and de-
mographic data in order to arrive at a complete picture of
the social and economic situation of the right-wing populist
support base, and compare these findings with survey data
on individual political attitudes.
    Their most important conclusion is that we should be wary
of generalisations. Right-wing populist voters are not in fact
“poor, uneducated, male eastern Germans”, nor is this the
“revenge of the left-behinds”. Instead the reasons driving the
phenomenon are more complex.
    This presents our democratic culture with a double chal-
lenge: On the one hand to deepen the dialogue between
the public and politicians and intensify political education work.
On the other, new structural responses need to be devel-
oped, aiming both to improve the social and economic situa-
tion and to strengthen social cohesion on the ground.
FRIEDRICH-EBERT-STIFTUNG – Wirtschafts- und Sozialpolitik 4 SUMMARY – In all German state elections held since the European Par- liament election in 2014 the right-wing populist AfD has passed the electoral threshold and won seats. The same applies to the Bundestag election in 2017. This study in- vestigates the influence of socio-demographics, attitudes and evaluations on the party’s success in seven state elections between 2014 and 2016, using both state-level survey data and aggregated socio-economic data at dis- trict level. – At district level systematic associations are found between certain socio-demographic characteristics and electoral support for the AfD. Higher unemployment, a low propor- tion of foreign nationals and a smaller proportion of highly educated persons are all associated with greater support for the AfD. – In relation to individual vote choice, attitudes and opinions are in general more relevant than socio-demographic characteristics. The strongest effects are found for dissat- isfaction with the performance of the (state) government and for right-wing socio-cultural attitudes. Moreover, socio- demographic factors are also significant: women are less likely to vote for the AfD, as are the highly educated. – Clearer patterns can be identified for state elections held in 2016 than for earlier elections. This suggests that a degree of structuring of the political competition has oc- curred and a homogenisation of the AfD’s voters. This development coincided with a period where political de- bate has been dominated by socio-cultural issues, first and foremost the so-called refugee question. – Relevant spatial differences are also identified at both lev- els of analysis. Taken as a whole, support for the AfD is rooted in complex and context-dependent patterns. Sim- plifications like “male, poor, uneducated and politically disillusioned” fail to do the issue justice in the context of Germany as a whole.
WHO VOTES RIGHT-WING POPULIST?                                                                      WISO DISKURS                  5

1

INTRODUCTION

Within just a few years the Alternative for Germany (AfD) has        vote. Chapter 6 turns to individual voting behaviour, examining
carved itself a space in Germany’s party-political spectrum.         the question of whether general patterns can be identified
Founded in 2013, it quickly achieved respectable showings,           across all seven state elections, and what these might be. Sub-
and has passed the 5 percent threshold in all national and           sequently, we analyse the state elections individually and dis-
state elections since 2014. The party’s greatest success to date     cuss the differences between them. Chapter 7 summarises
was undoubtedly the September 2017 Bundestag election:               the findings and draws conclusions.
A national list vote of 12.6 percent and three seats won directly
have made the AfD a force to be reckoned with at national
level. If we are to find the best strategy for dealing with the
AfD’s success, we need to identify which sections of the popu-
lation feel attracted to its right-wing populism and what it is
that motivates them.
     In the present study we explore these questions in relation
to seven state elections held between 2014 and 2016. As
well as allowing us to retrace the party’s development in the
lead-up to the 2017 Bundestag election, this approach also
opens a perspective on geographical differences – which were
also very striking in the Bundestag election. Our investigation
is based on data pertaining to the level of administrative dis-
tricts, supplemented by opinion surveys. We take account of
political attitudes and the influence of socio-demographic re-
alities on voters’ decisions to support or oppose the AfD. The
research objectives also encompass identifying possible simi-
larities and differences between the state elections. The central
finding is this: simplifications like “poor, male, uneducated
and politically disillusioned” fail to do the issue justice in the
context of Germany as a whole. A more differentiated per-
spective is required.
     Before we turn to the factors influencing vote choice for
the AfD, Chapter 2 briefly summarises the current phenome-
non of right-wing populism and outlines the concrete objec-
tives of this study. The integrative approach upon which the
explanatory model is based is described in Chapter 3, while
the empirical methodology is addressed in Chapter 4.
     Chapters 5 and 6 go into detail on the multitude of factors
that influence vote choice for or against the AfD. Chapter 5
analyses socio-demographic and socio-economic factors in
two steps. After first identifying regional differences in AfD
support and regional socio-demographic and socio-economic
disparities, we use multivariate analysis to explore the con-
nection between these contextual conditions and the AfD’s
FRIEDRICH-EBERT-STIFTUNG – Wirtschafts- und Sozialpolitik 6
2
BACKGROUND AND OBJECTIVES
The British referendum vote to leave the European Union and rule (Arzheimer 2015). Although right-wing parties have ap-
Donald Trump’s election as 45th President of the United peared at intervals throughout the post-war period, and
States represent the most important and globally most sig- scored short-lived successes in individual states, the trajecto-
nificant recent successes of right-wing populist parties and ry of the AfD – as matters currently stand – appears to repre-
movements. But they are only the most obvious of a series sent a new and different quality. Just a few months after its
of massive shifts across many (established) democracies. creation the AfD was achieving comparatively strong results
Right-wing populist parties have become established forces for a new party (see Figure 1).
in Austria, Switzerland and the Netherlands, while Hungary’s After narrowly failing to pass the 5 percent threshold in
Viktor Orbán is forging ahead with measures designed to the 2013 Bundestag election (and the simultaneous state
undermine democracy. And in Germany a right-wing populist election in Hesse), the AfD has won seats in all subsequent
party appears to be establishing itself in the Bundestag and state and national elections. In seven of the eleven elections
the state parliaments. As the 2017 Bundestag election demon- held between 2014 and 2016 it returned more than 10 percent.
strated, the AfD is now capable of gaining seats at the na- Almost all these contests took place after the political reori-
tional level. Never since the appearance of the green parties entation marked by the departure of Bernd Lucke in July 2015.
in the 1980s has a new party-political current risen to such Since then the AfD has further increased its share of the
prominence so rapidly. vote, twice exceeding 20 percent. Although momentum was
To a certain extent right-wing populism reflects a zeitgeist certainly a factor, the principal driver of electoral success was
– at least among parts of the population – of opposition to the intense political and media discussion of the “refugee
the open society and the existing form of representative de- question” triggered by the sharp rise in refugee numbers in
mocracy. Differences naturally exist between the different 2015. This rapidly propelled the AfD into a position of politi-
right-wing populist parties and movements in terms of their cal relevance in Germany – further reinforced by its media
specific orientation (Taggart 2000: 5), not least through the presence and its central role in setting the political agenda.
inherent logic of their self-definition as champions and de- This culminated not least in the dubious prioritisation of issues
fenders of “the people” against internal and external threats in the televised debate held before the Bundestag election.
(Mudde 2007; Zick et al. 2016). The definitions of both the In this study we seek to identify the factors responsible for
homogeneous collective and the threats to it are context-re- the electoral success of the AfD. Ours is naturally not the first
lated, with space for relevant differences between right-wing piece of research to pursue that question. But our approach
populist parties. But in essence they share a “thin ideology” introduces a number of novel aspects. Firstly we examine the
(Mudde 2007) dedicated to generating identity through ex- party’s vote across a number of state elections, providing both
clusion. They purport to defend “the people” against “ the geographical and temporal comparisons. Secondly we present
establishment” (political elites, the media, the courts and su- analyses at both the aggregate level (concretely administrative
pranational institutions) and against “outsiders” (such as mi- districts),1 and at the level of individual vote choice. In other
grants, other religions and sexual minorities) (Lewandowsky words, the spatial perspective is complemented by the per-
et al. 2016). Vertical exclusion represents the populist dimen- spective of survey research. Thirdly, our study takes account of
sion, while horizontal exclusion corresponds to a right-wing the observation that vote choices are shaped by a multitude of
socio-cultural belief system. While there are intersections be- different factors. Alongside socio-demographic influences, we
tween the (political) opponents of right-wing populist par- therefore also take account of attitudes and opinions that may
ties, these are ultimately strongly determined by the concrete mitigate for or against voting for the AfD. This new and more
context of each country. comprehensive approach also permits us to identify and evaluate
Right-wing populism was slow to take hold in Germany, the geographical disparities. We believe this represents a signi-
undoubtedly on account of the country’s experience with Nazi ficant contribution to understanding the success of the AfD.WHO VOTES RIGHT-WING POPULIST? WISO DISKURS 7
Figure 1
AfD vote share 2013–2016 (percent)
30
AfD founded Lucke leaves
25
20
15
10
5
0
HE SA BB TH HH BR BW RP ST MV BE
2013 2014 2015 2016 2017
Explanation of Figure 1:
– AfD achieves success comparatively quickly, winning seats
in all elections since 2014. National European State
– After founder Bernd Lucke’s departure leads to a political
reorientation in the party and the refugee debate occurs, the now
clearly right-wing populist party strongly increases its vote share.
Note: Height of bars represents AfD vote share (in elections with more than one ballot paper, the share of the party list vote). State abbreviations: Hesse (HE), Saxony (SA), Brandenburg (BB), Thuringia (TH), Hamburg (HH), Bre-
men (BR), Baden-Württemberg (BW), Rhineland-Palatinate (RP), Saxony-Anhalt (ST), Mecklenburg-Vorpommern (MV) and Berlin (BE). To assist legibility elections occurring simultaneously are slightly separated in the depiction.
1
1 In this study the term “district” also includes
urban municipalities (kreisfreie Städte).FRIEDRICH-EBERT-STIFTUNG – Wirtschafts- und Sozialpolitik 8
3
VOTING BEHAVIOUR MODELS AND
RIGHT-WING POPULISM
Election research is one of the oldest disciplines of (political) bedded in a specific context that is created by typical political
behavioural research. So it is unsurprising that we find our- conditions such as election campaigns or coalition promises
selves confronted today with a historical accumulation of and in turn influences individual factors within the model
theories and competing assumptions concerning the motiva- (above all attitudes and opinions).
tions driving vote choice. Chronologically speaking, the ap- The central questions in this study are the role played by
proaches span the sociological, the (social) psychological and socio-demographic factors and political attitudes, and the
rationalistic. 2 Recent years have seen attention returning to con- extent to which regional differences can be identified. For
textual factors, for example in the form of the institutions of theoretical and practical reasons, a number of factors named
the election system or of the campaigns (Stone/Buttice 2010). in Figure 2 are omitted from our analyses. For theoretical
As society becomes increasingly differentiated and indi- reasons it did not appear very useful to include historical pat-
vidualisation intensifies, a growing heterogenisation of voter terns and long-term partisanship when dealing with a party
motivations can be observed (Weßels et al. 2014). Not only as young as the AfD. And valid, comparable data on value
do motivations differ between individuals; even for a single orientations, campaign activities and media reporting during
person, voter choice is no longer monocausal. In the overall the lead-up to state elections is simply not available for all
picture, factors that once strongly influenced voters – like party seven states. Nevertheless, we do take account of the widest
identification trade union membership and religion – are less possible range of explanations; these are indicated in bold
important today. Like the historical political divides they in Figure 2.
reflect, they have faded or at least lost their defining power. Socio-demographics is located on the left-hand side of the
Space for a new and more individualised agenda has funnel of causality, and relates to both the micro- and the
emerged. macro-sociological explanatory approaches: the influences on
Election research was quick to respond to this trend, with “downstream” factors – and on actual vote choice – can be
various proposals for an integrative approach to explain vot- attributed to individual socio-demographic factors, such as age,
ing behaviour (Miller/Shanks 1996: Chapter 8; Weßels et al. education or economic situation, while demographic struc-
2014). The present study hews to that strategy, not least be- tures and environments at the macro level play a role too. In
cause the reasons for voting for right-wing populist parties in essence we assume that individual characteristics and con-
general and the AfD in particular are associated with a multi- textual disparities come together in deciding the success or
tude of factors. The funnel of causality for voter choice, as failure of the AfD.
one integrative approach, is presented in Figure 2. This mod- Voting behaviour theories take into account politicians’
el assumes that various factors that influence voter choice attitudes and opinions, as well as political issues, acts and
also influence one another, but may be brought into some events. These approaches are based on the assumption that
kind of order. The further one moves from the narrow end of citizens possess particular preferences and vote in represent-
the funnel, the closer the factors are to actual vote choice. ative democracies with the objective of realising these to the
In this model “upstream” factors such as socio-demographics greatest possible extent. At the same time the cyclical nature
influence voting behaviour to a smaller extent directly and of elections creates the possibility to judge the work of political
to a greater extent indirectly – in the sense that they influence actors and reward or punish them on election day. The effects
other factors further to the right in the funnel, which then of attitudes and opinions on vote choice for the AfD are un-
have an effect on vote choice. The decision model is thus em- disputed, so they flow into the analyses below. But, in a typical
case of indirect influence, the origination of attitudes and
2 For further detail see the standard works of election research such as
opinions is also heavily affected by socio-demographic factors.
Falter and Schoen (2014), which offers a deeper discussion of the strengths So which socio-demographic factors, attitudes and opin-
and weaknesses of the different approaches. ions are of relevance to right-wing populist electoral support?WHO VOTES RIGHT-WING POPULIST? WISO DISKURS 9
Figure 2
Funnel of causality of vote choice
Context
election
campaign
economic
situation
socio-
demographics group
loyalty
attitudes
social value party
Voter choice
division orientation loyalty
opinions
group
historical membership
pattern
political
decisions
media
reporting
Context
Explanation of Figure 2:
– Vote choices are the outcome of many different factors and
are influenced by context.
– Socio-economic and socio-demographic factors in particular
influence attitudes and opinions, which are closer to vote choice
in the funnel of causality.
– Socio-economic and socio-demographic factors thus exert both
direct and indirect influence.
Source: based on Weßels et al. (2014). Elements included in this study are indicated in bold.
Out of the broad existing literature (including Decker/Lewan- so-called autochthonous population has little possibility for
dowsky 2011; Häusler 2013; Schmitt-Beck 2014; Arzheimer contact with persons with a migration background (Asbrock
2015; Bebnowski 2015; Berbuir et al. 2015; Lewandowsky 2015; et al. 2012).
Wagner et al. 2015; Giebler/Regel 2016; Leininger 2016) we A range of different attitude- and opinion-related moti-
identify a number of central explanatory factors for investi- vations are also reported to be associated with electoral sup-
gation. In relation to socio-demographics it is widely noted port for right-wing populist parties. These factors can be di-
that women and older people are less likely to vote for the vided into two main groups, each of which includes elements
AfD, while the party gains disproportionate support among of the aforementioned aspects of vertical and horizontal ex-
the less educated and in rural areas. There are various argu- clusion inherent to right-wing populism. Firstly, a vote for a
ments for the influence of socio-economic situation: on the right-wing populist party represents an (expressive) protest
one side it is argued that precarity (low income, insecure em- against established political actors, their activities, or the po-
ployment or unemployment) makes it more likely that a per- litical system itself. In this respect the theory of second-order
son will vote for a right-wing populist party. On the other, elections (Reif/Schmitt 1980; Giebler 2014) may be of rele-
the fear of loss of social status can also increase the likelihood vance. In second-order elections – meaning all elections not
of voting AfD; in other words, the middle class could support involving the highest offices of a political system – protest
the party for that reason. Finally, the AfD appears to be most materialises as the influence of first-order factors in the voters’
successful in eastern Germany, likely on the basis of an uneven decision on how to vote in the second-order election. If voters
east/west distribution of these characteristics. Uneven distri- in a state election make their choice on the basis of the situ-
bution of underlying characteristics has already been shown ation at the national rather than the state level, it can be as-
to explain the difference in xenophobic attitudes (Müller 2016). sumed that the AfD will profit from a protest vote. Negative
The proportion of the population with a migration background attitudes towards the democratic system itself, and negative
plays a prominent role in the difference between eastern and opinions about that system, future economic prospects or
western Germany: the AfD is especially successful where the the work of the government also play an important role inFRIEDRICH-EBERT-STIFTUNG – Division for Economic and Social Policy 10 motivating vote choice. Secondly, support for right-wing popu- list parties may be based on concrete policy issues (Wagner et al. 2015) in the sense of an expectation that they will tend to represent particular political preferences better than the other parties. This applies principally to right-wing socio-cultural attitudes: rejection of people with migration background and sexual minorities, strong nationalism and scepticism towards the European Union. Finally, socio-economic attitudes – typically concerning redistribution by means of welfare benefits and tax rates – also play an important role in elections. But in this respect the AfD is difficult to classify (Franzmann 2014): While it poses as the champion of ordinary people and glo- balisation losers, its political programme still bears neoliberal traits dating from the era of Bernd Lucke’s leadership. But before we explore how these diverse factors diversely influ- ence vote choice for the AfD, we first outline our concrete empirical methodology.
WHO VOTES RIGHT-WING POPULIST?                                                                       WISO DISKURS                  11

4

METHODOLOGY

In this study we explore the factors behind the AfD’s electoral       What both perspectives share is that they permit the identifi-
success from two different perspectives. Firstly we investi-          cation of general patterns and trends across all geographical
gate potential influence in the context of spatial units, con-        units and all seven elections, as well as specific differences
cretely at the level of administrative districts. This allows us to   between units and elections. This opens the door to new and
isolate the influence of different settings on the level of sup-      fuller insights into the reasons for the AfD’s electoral success
port for right-wing populist parties. This type of election re-       in Germany, and can also serve as a starting point for future
search, known as “election geography” or “political ecology”,         research on the 2017 Bundestag election where similar geo-
has a very long history dating back to before the First World         graphical differences were observed.
War (Falter/Winkler 2014).
    As we show in Chapter 5, relevant differences in vote
share are found not only between the seven states, but also
between districts within a state. This is not surprising, given
that – as outlined above – factors that may positively or neg-
atively influence the AfD’s vote are very unevenly distributed
among the investigated units. Alongside socio-demographic
factors, these are principally socio-economic disparities – as
outlined for example in FES’s 2015 Disparities Report (Albrech
et al. 2016). In light of the findings of the Disparities Report
one could argue that it would be astonishing if major elec-
toral differences between regions were not found.
    Secondly we draw on survey data relating to the seven state
elections to examine individual behaviour. This perspective
allows statements pertaining to causality to be made while
avoiding ecological misconceptions, and permits inclusion of
other factors that play a central role in election research (above
and beyond socio-demographics). In this study we concentrate
on attitudes and opinions about politics. So we are analysing
not only differences between geographical units – the seven
states – but also the relative importance of socio-demographic
factors compared to attitudes and opinions. In the funnel of
causality presented in Chapter 2 socio-demographic factors
clearly precede attitudes and opinions; in other words they
influence them. For that reason we apply a specific statistical
technique to measure the actual effect of socio-demographic
factors. 3

3   The method is described in the appendix.
FRIEDRICH-EBERT-STIFTUNG – Division for Economic and Social Policy 12
5
REGIONAL DISPARITIES AND THE
AFD VOTE AT DISTRICT LEVEL
The socio-demographic and socio-economic contextual con- with the highest vote for AfD were in Saxony-Anhalt, the ex-
ditions of the AfD’s support at district level are analysed in ceptions being Vorpommern-Greifswald in Mecklenburg-
two stages. We begin by examining district-level geographical Vorpommern and Pforzheim in Baden-Württemberg. Within
differences in AfD vote share and socio-demographic and the states no coherent geographical pattern can be identi-
socio-economic indicators. The second stage centres on a multi- fied in terms of region or size of district. High vote shares in
variate analysis of the links between these contextual condi- cities like Pforzheim, Ludwigshafen and Frankfurt (Oder) and
tions and the AfD vote. The study investigates the state elec- comparatively low (but nonetheless significant) shares in cities
tions in seven states: Saxony, Brandenburg, Thuringia, Baden- like Freiburg (8.7 percent) and Tübingen (10.6 percent) sug-
Württemberg, Rhineland-Palatinate, Saxony-Anhalt and gest that we are not dealing with a simple urban/rural dicho-
Mecklenburg-Vorpommern. Together they account for 156 of tomy. That impression is confirmed by the heterogeneity of
the total of 402 districts in Germany. Districts (Kreise) are vote share figures in rural districts.
administrative entities that generally contain several munici- As a step towards explaining the spatial variation in the
palities. Because their boundaries are drawn by the state in success of the AfD, we conducted an analysis of the so-
which they lie, the districts investigated here exhibit a very broad cio-demographic and socio-economic characteristics of the
range of geographical area and population. The populations districts. As already mentioned in Chapter 3, a multitude
of the 82 rural and 74 urban districts range from 34,084 of factors potentially contribute to explaining the AfD vote
(Zweibrücken) to 604,297 (Stuttgart); the mean is about share. The macro-analysis at district level concentrates on
150,000. The largest by area is Mecklenburgische Seenplatte four factors: unemployment rate, proportion of foreign natio-
with about 5,500 square kilometres – more than one hundred nals, proportion highly educated, and household income. 4
times the size of the smallest, Speyer. The districts permit a much All the indicators comprised 2014 data. High unemploy-
finer geographical analysis than states, but are still often large ment is frequently associated with an elevated vote share for
and internally heterogeneous units. As Figure 1 shows, the AfD right-wing populist parties. Firstly, high unemployment may
achieved varying degrees of success in past state elections, have a direct influence through the larger number (and pro-
although the overall trend is clearly upward. The AfD vote in portion) of unemployed persons who may potentially them-
the elections covered by this study ranged between 9.7 percent selves vote for the AfD. But it may also have indirect contextual
in Saxony 2014 and 24.3 percent in Saxony-Anhalt 2016. effects as an indicator of economic disadvantage. The contact
hypothesis predicts that attitudes towards foreign nationals
will be more positive where the proportion of foreigners and
5.1 REGIONAL DISPARITIES AT migrants is higher (Zick et al. 2016). That should mean poor-
DISTRICT LEVEL er prospects for parties like the AfD. This is not a linear effect
however, so for the purpose of our analysis we converted
The AfD vote obviously differs between states. Figure 3 offers the proportion of foreign nationals into an indicator for “low
a more granular perspective at district level. Although the proportion of non-Germans”, given the value 1 where the
underlying differences between the state elections are clearly proportion of foreign nationals is smaller than 3 percent. 5
reflected at the level of the districts, relevant differences be- People with more education are known to be less likely to
tween districts within each state are also found. The maximum
difference between districts within a state ranges between 4 Other potential micro-level factors (such as proportion of women, po-
6 percentage points in Saxony and 16.5 percentage points in litical attitudes and age) had to be excluded for reasons including: lack of
variance at district level; lack of data (for example on political attitudes);
Baden-Württemberg. The lowest vote for the AfD was in and a methodologically driven concentration on the most plausible influ-
Leipzig with 7.3 percent, the highest in Burgenlandkreis in encing factors, because the small number of cases at district level limits
Saxony-Anhalt with 29.4 percent. Eight of the ten districts the number of influencing factors included in the analysis.WHO VOTES RIGHT-WING POPULIST? WISO DISKURS 13
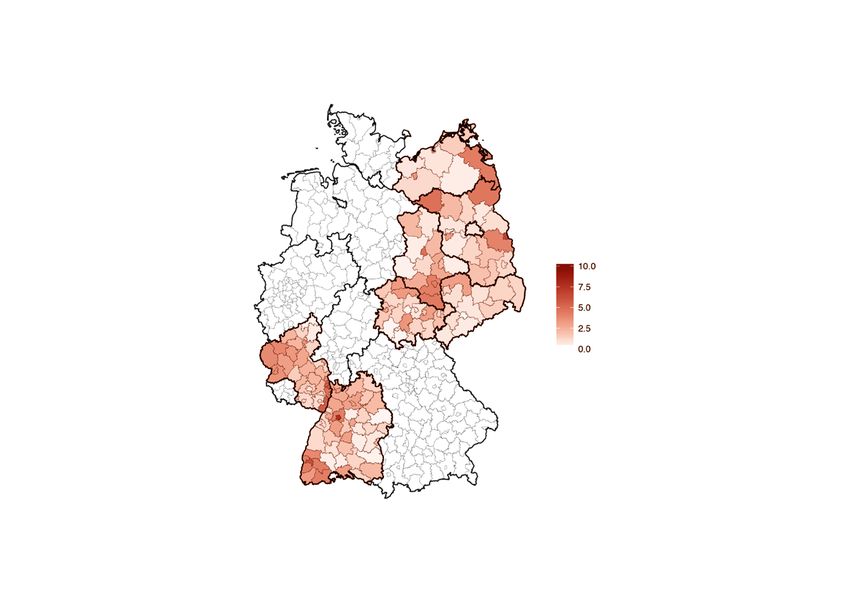
Figure 3
AfD vote share in selected state elections 2014–2016 (percent)
30
20
10
0
Explanation of Figure 3:
– AfD vote share differs widely strongly between and within
the seven states.
– At district level AfD vote share ranges between 7.3 percent (Leipzig)
and 29.4 percent (Burgenlandkreis).
– No clear geographical pattern or urban/rural distinction.
Note: The map shows districts within states. The lighter the colour of the district, the higher AfD vote share at the last state election (in elections with more than
one ballot paper, the share of the party list vote).
vote for right-wing parties. Here we used the proportion of ally in recent years, there is considerable geographical variation,
the economically active population with university entrance 5 with the state average ranging between 4 percent in Baden-
qualifications (Fachabitur or higher), because education data Württemberg and 11 percent in Mecklenburg-Vorpommern.
for the population in general is not available at district level. Generally it is higher in the eastern than in the western states,
In the case of income, two contradictory theories can be pro- although the difference between Rhineland-Palatinate and
posed. On the one hand, right-wing populist parties are fre- Thuringia – 2.1 percentage points – is not huge. The differ-
quently supported by people with low incomes. But income ences between individual districts are larger. While the lowest
could also have the opposite effect: namely, if the AfD is district unemployment rate was just 2.6 percent (Biberach), the
supported in particular by those who fear loss of income. highest was 15.4 percent (Uckermark). Only Pirmasens, Kaisers-
Like the AfD’s election results, the district-level socio-demo- lautern, Ludwigshafen and Worms in Rhineland-Palatinate join
graphic factors are regionally heterogeneous, with consider- the mass of eastern districts in the top third of the unemploy-
able geographical disparities both between and within states ment statistics. An opposite east/west trend is found for pro-
(Albrech et al. 2016). Figure 4 shows the state-level means portion of foreign nationals. At state level the average for
and standard deviations of the indicators used in the study eastern states is between 2.5 and 2.7 percent, while Rhineland-
(standard deviations as a measure of heterogeneity within Palatinate has 8 percent and Baden-Württemberg more than
states). 6 Although the unemployment rate has fallen nation- 12 percent foreign nationals. The latter two states also exhibit
great heterogeneity between individual districts, with differ-
ences of up to 19.1 percentage points: in Südwestpfalz only
5 Lack of availability of up-to-date data on the proportion of the popu- 3.1 percent of the population are foreign nationals, while the
lation with a migration background forces us to use instead the propor-
figure for Ludwigshafen is 22.2 percent. In the eastern states
tion of foreign nationals in this study.
6 For the mean proportions of foreign nationals in Figure 4 we used
only a handful of the larger cities exceed 5 percent.
not the final binary operationalisation but the more intuitive and continu- The east-west differences are smaller in relation to educa-
ous original scale. tion. All the states contain districts with high and low values,FRIEDRICH-EBERT-STIFTUNG – Division for Economic and Social Policy 14
with the widest differences found in Rhineland-Palatinate, ment, “low proportion of non-Germans” and proportion
Baden-Württemberg and Saxony-Anhalt. Household income, highly educated are all significant at 10 percent level or better.
on the other hand, exhibits strong east-west differences: there These three indicators thus exhibit a small probability of error
is no eastern district in the top third and only one western and their influence on the AfD vote share can be described
district (Ludwigshafen) in the bottom third. The states exhibit as robust and systematic.
different degrees of internal disparity: in the eastern states The effect of the individual variables represents the per-
the household income of the lowest-ranked district represents centage point change in the AfD vote share when the re-
between 82 and 88 percent of the figure for the highest- spective factor increases by one unit. For both unemployment
ranked in the same state; the equivalent figure for Rhineland- rate and proportion highly educated, that means an increase
Palatinate is 70 percent and Baden-Württemberg just 48 percent. by 1 percentage point. For “low proportion of non-Germans”
it means a change from more than 3 percent proportion of
foreign nationals to less than 3 percent, and for household
5.2 EXPLAINING THE AFD VOTE income an increase of €1,000/month. Out of the four indica-
AT DISTRICT LEVEL tors, the strongest effects are found for unemployment rate
and “low proportion of non-Germans”. If the unemployment
So how well do these district-level socio-demographic and rate increases by 1 percentage point the AfD vote share
socio-economic factors explain the AfD vote in state elections? increases by 0.4 percentage points. A “low proportion of
As the funnel of causality shows (Figure 2), vote choices are non-Germans” increases the AfD vote share by 1.4 percentage
not made on the basis of a single factor. Figure 5 therefore points, which would appear to confirm the contact hypothesis.
presents the results of a multivariate model that integrates These two identified effects support the findings of other
all four investigated factors, and also controls for state. The spatial macro-analyses of the AfD vote in Berlin (Giebler/
latter ensures that we can also measure differences between Regel 2016) and Hamburg (Leininger 2016). As in other inves-
states that are not covered by the four factors. Unemploy- tigations of the characteristics of AfD voters (Niedermayer/
Figure 4
Socio-demographic factors at state level
Unemployment rate Proportion of foreign nationals Proportion highly educated Household income
SA
TH
BB
BW
RP
ST
MV
0 5 10 0 5 10 15 0 2 4 6 0 1,000 2,000
Explanation of Figure 4:
– As with AfD vote share, considerable regional disparities are found
both between and within states.
– Clear (and expected) east/west differences in unemployment rate,
proportion of foreign nationals and household income.
Note: Dots indicate mean for district figures within state. Lines represent standard deviation, indicating size of span within state. State abbreviations: Saxony (SA), Thuringia (TH),
Brandenburg (BB), Baden-Württemberg (BW), Rhineland-Palatinate (RP), Saxony-Anhalt (ST) and Mecklenburg-Vorpommern (MV).WHO VOTES RIGHT-WING POPULIST? WISO DISKURS 15
Hofrichter 2016), a higher proportion of highly educated per- With the small number of cases and indicators – and especially
sons corresponds with a smaller AfD vote share. If the pro- the latter being exclusively socio-demographic and socio-
portion of highly educated increases by 1 percentage point, economic in nature – the model is naturally unable to explain
the AfD vote share decreases by 0.4 percentage points. As all cases perfectly. But its fundamental explanatory power is
suggested by the loss of status theory, household income good. For various reasons the model’s ability to explain district
has a positive effect on the AfD result. An increase of €1,000 results varies. Figure 6 shows the geographical distribution
in household income increases the AfD vote share by 1.7 percen- of the model’s explanatory power, with darker red indicating
tage points. After controlling for other factors, the AfD tends larger absolute deviation. All the states include cases where
to be more successful in regions that are better off in terms the model performs especially well or especially badly. The two
of income, although the effect is not statistically significant. extreme cases are Pforzheim and Frankfurt (Oder), where the
The effects of the control variables for the states indicate gap exceeds 7.5 percentage points. In both cases the AfD
additional state-specific patterns. The model shows that the vote is underestimated. The reasons for such differences in-
AfD vote share in Baden-Württemberg, Rhineland-Palatinate, clude patterns of political attitudes that elude the indicators
Saxony-Anhalt and Mecklenburg-Vorpommern was signifi- and changes in the political supply (such as major policy shifts
cantly higher than in Saxony, Thuringia and Brandenburg. and candidate effects) of the AfD or its rivals. There are also
This difference is amplified if separate models are calculated regional peculiarities that cannot be captured by the indicators
for the state elections in 2014 and in 2016. The results re- used. Moreover, while districts represent a much finer geo-
ported above are clearly confirmed for the state elections in graphical unit than states, they still sometimes exhibit con-
2016, while for the state elections in 2014 the factors are not siderable internal variation in their socio-demographics, socio-
significant and the explanatory power of the model as a whole economics and AfD vote share.
is dramatically reduced.7 What this suggests is that AfD voting Altogether we find strong geographical differences be-
behaviour appears to have evolved within the space of two tween and within states – in socio-demographics, in socio-
years from a diffuse support that is not attributable to the economics and in AfD vote share. We also find that higher
four socio-demographic indicators into a systematic pattern. unemployment, a low proportion of foreign nationals and a
lower proportion of highly educated people are all associat-
ed with a larger AfD vote share. This finding is confirmed
when the 2016 state elections are modelled individually, but
7 The explanatory power of statistical models represents the extent to the associations are weaker and less systematic for the 2014
which the explanatory factors can actually explain the differences in the
dependent variables. If the explanatory power is small, this suggests that
state elections. The identification of regional disparities (Al-
important explanatory factors have been omitted or that differences in brech et al. 2016) thus supplies useful instruments for under-
the variables are random rather than systematic. standing – and in principle also predicting – election results.
Figure 5
Socio-demographic factors and AfD vote share at district level
Unemployment rate
Low proportion of non-Germans
Proportion highly educated
Household income
0 2 4
Explanation of Figure 5:
– Higher unemployment is associated with higher AfD vote share;
“low proportion of non-Germans” is associated with a 1.4 percentage
point increase in AfD vote share.
– Higher proportion of highly educated is associated with lower AfD
vote share.
– No robust relationship is found for household income.
Note: The dots indicate the calculated effect of the indicators on AfD vote share; the lines indicate 90 percent confidence intervals. If the confidence interval crosses the
vertical red line (null) the probability of error is high and it cannot be excluded that the observed effect is merely random.FRIEDRICH-EBERT-STIFTUNG – Division for Economic and Social Policy 16
Figure 6
Explanatory power of model at district level (percent)
10.0
7.5
5.0
2.5
0.0
Explanation of Figure 6:
– The model is fundamentally good, but the quality of its predictions
varies between districts.
– No clear geographical pattern; districts with larger deviations are
found in all states.
– This suggests an effect of specific local factors.
Note: The map shows the difference between model and real value for each district. The darker the red, the larger the absolute deviation between the actual AfD vote share and the
predicted share. The figure shows absolute deviation, without distinguishing between underestimation and overestimation of the AfD vote share.WHO VOTES RIGHT-WING POPULIST? WISO DISKURS 17
6
DETERMINANTS OF
INDIVIDUAL VOTE CHOICE
Examination of district-level socio-demographic and socio- Altogether, however, the explanatory power of the model is rather
economic data revealed significant differences that explain small. All the factors examined trend as expected, but are
part of the differences in AfD vote in the seven state elec- only reliably generalisable in the cases of education and settle-
tions. Having identified relevant patterns in our exploration ment type town. This suggests that additional factors need to
of the electoral geography, we now turn to an analysis of be included if the AfD vote is to be explained systematically.
individual voting behaviour. Our data originates from surveys A second model adds attitudes and opinions that are
prepared for the German Longitudinal Election Study (GLES). known to affect voting for right-wing populists (see Chapter 3).
These representative online surveys conducted in the run-up In order to avoid underestimating the actual influence of socio-
to state elections cover a multitude of relevant factors and demographic factors, the indicators for measuring attitudes
thus offer the possibility to investigate political attitudes and and opinions are corrected. This is necessary because, as well
opinions – in addition to socio-demographic characteristics – as influencing vote choice directly, socio-demographic factors
and as such to better represent the funnel of causality. themselves also influence attitudes and opinions. If a regres-
sion model estimates this set of factors simultaneously, a
part of the effect of socio-demographics will be incorrectly
6.1 GENERAL PATTERN OF attributed. For example conservative and right-wing socio-
INDIVIDUAL VOTE CHOICE cultural attitudes are more likely to be found among older
people and less likely among those with more education
What general patterns can be identified across all seven state (Zick et al. 2016: Chapter 3). If one neglects to correct the so-
elections? To answer this question we calculate two regres- cio-cultural attitudes, a lack of significant influence of age
sion models predicting vote choice in a cumulative dataset of or education could result solely from an inadequate under-
the seven surveys. Details of the models and results in table standing of the funnel of causality of vote choice (Figure 2).
form can be found in the Appendix. The model depicted in Figure 8 is considerably better able
If one only considers the influence of socio-demographic to predict individual vote choice for the AfD. The explanatory
factors, few robust effects on vote choice are found. 8 These power is five times greater than in the version using only so-
are shown in Figure 7 as change in probability of voting AfD. cio-demographic factors. We find clear evidence that – even
The expected direction of influence is found for gender, house- after the correction of socio-demographic effects on attitu-
hold income (in €1,000/month) and age (although none are des – the determinism of statements like “uneducated young
statistically significant). On the other hand more education men vote AfD” are oversimplifications.
(university entrance qualification) reduces the probability of Two socio-demographic factors do exhibit robust influ-
voting AfD by almost 11 percentage points (significant). As well ence, however. More education still clearly reduces the likelihood
as representing a strong effect in its own right, this also echoes of voting AfD. While the effect of settlement size found
the findings of the district analysis. Interestingly settlement when socio-demographic factors were considered exclusively
type also plays a role, with residents of towns (but not of cities) is no longer significant after controlling attitudes and opinions,
less likely to vote AfD than those living in rural areas. we now find a (modest) gender effect. Women are less likely
to vote for the AfD than men, with the difference amounting
8 Regrettably it was not possible to include unemployment. The absolute to almost 4 percentage points. Right-wing socio-cultural
number of unemployed persons in the survey sample is relatively small, attitudes and dissatisfaction with the state government are
corresponding to the proportion of the total electorate who are unem- of greater relevance. Those who are completely dissatisfied
ployed (about 4.3 percent). The number of usable cases is further reduced
by the generally demobilising effect of unemployment (Faas 2010: ch. VI.3),
with the work of the state government are about 14 percen-
which means that in this group vote choices are less likely to be supplied, tage points more likely to vote AfD than those with a neutral
and therefore fewer are available for analysis. position. The equivalent change in socio-cultural attitudes fromFRIEDRICH-EBERT-STIFTUNG – Division for Economic and Social Policy 18
Figure 7
Socio-demographic model for all states
Female
Household income
Age (vs. 18–25)
26–30
31–50
51–65
65 +
Education (vs. low)
medium
high
Settlement type (vs. rural)
town
city
–15 –10 –5 0 5 10
Explanation of Figure 7:
– Socio-demographic factors play only a small role in individual
choices to vote AfD.
– Nonetheless, across the seven state elections education and
settlement type are found to play a role; more education and
living in a town or a city are associated with smaller probability
of voting AfD.
Note: The dots represent the effects of the indicators on the AfD vote as percentage point change. The lines represent 95-percent confidence intervals. If the confidence interval
crosses the vertical red line (null) the probability of error is high and it cannot be excluded that the observed effect is merely random.
the lowest to the highest possible score produces an in- ture of Bernd Lucke. It must be assumed that the diverging
crease of more than 20 percentage points. One may thus gene- results in the present study are a direct consequence of the
ralise that typical AfD voters tend to be male and less edu- application of the funnel of causality. We must therefore reit-
cated, dissatisfied with their state government and right-wing erate the importance of a theoretically grounded analysis of
in their socio-cultural attitudes. If one combines this finding influencing factors taking into account the direct and indirect
with the observation that central socio-cultural issues such as effects of socio-demographic factors.
immigration, Islam and treatment of refugees were especially
hot topics in 2015 and 2016, and the way they were handled
therefore played a large part in assessments of the work of 6.2 SPECIFIC PATTERNS OF
the state governments, then neither the results nor the rising VOTE CHOICE IN THE STATES
trend in AfD election results comes as any surprise.
Interestingly, the analysis combining all seven states finds After revealing general patterns of voting behaviours at the
no significant effect for various other attitudes and opinions individual level, we conclude by examining the individual state
that are generally held to be associated with support for right- elections separately. Comparative studies on state elections
wing populism. Neither socio-economic factors nor attitudes show that there may be differences in voting behaviour (Völkl
generally associated with protest voting (dissatisfaction with et al. 2008; Giebler 2017), and the concrete context in which
democracy and supporting extremist parties to send a mes- an election takes place is naturally of general significance. It can
sage in second-order elections) play any role. be assumed that such differences will also be found in the
The same applies, incidentally, to weak attachment to the AfD vote.
European Union – although the importance of European poli- Table 1 shows the results of a state-by-state analysis – in
tics within the party has receded noticeably since the depar- comparison to the general pattern – across all seven electionsWHO VOTES RIGHT-WING POPULIST? WISO DISKURS 19
Figure 8
Combined model for all states
Female
Household income
Age (vs. 18–25)
26–30
31–50
51–65
65 +
Education (vs. low)
medium
high
Settlement type (vs. rural)
town
city
Second-order election
Dissatisfaction with democracy
Negative economic expectations
Dissatisfaction with government
Socio-economically right-wing
Socio-culturally right-wing
Weak attachment to EU
–15 –10 –5 0 5 10
Explanation of Figure 8:
– Including attitudes and opinions greatly improves the explanation of
vote choice for the AfD.
– Women and the highly educated are considerably less likely to vote
AfD, but dissatisfaction with the state government and a socio-cultural
right-wing attitude are found to be considerably more relevant.
Note: The dots represent the effects of the indicators on the AfD vote as percentage point change. The lines represent 95-percent confidence intervals. If the confidence interval
crosses the vertical red line (null) the probability of error is high and it cannot be excluded that the observed effect is merely random.
9
in simplified form. The changes in probability of voting AfD
are indicated in percentage points. 9 Significant factors are 9 The models were calculated in the same way as those in Figure 9.
Comparing non-linear regression coefficients is not unproblematic meth-
identified by background colour, with blue representing reduc- odologically. But this applies to effect sizes and not probability of error.
tion and red increase. The state elections are listed chrono- The interpretation here therefore concentrates on the direction of the in-
logically from left to right. fluences and statistically robust influences, rather than differences in
Three things are obvious at first glance. Firstly the four probability change. The magnitude of the latter – for example in Table 1
for Saxony-Anhalt – depends among other things on whether the explan-
identified general influencing factors also play an identifiable atory factors exhibit strong positive or negative effects and how well the
role in many of the seven state elections, although the effect model as a whole is able to explain the dependent variable (see also
is limited in the case of the socio-demographic indicators. Giebler 2017).FRIEDRICH-EBERT-STIFTUNG – Division for Economic and Social Policy 20
Table 1
Socio-demographic factors, attitudes and voting intention
SA TH BB ST BW RP MV All
Female –0.05 5.46 –0.34 –9.84 –4.55 –10.02 –9.10 –3.95
Household income –7.54 1.03 1.81 –6.30 –8.07 –2.69 2.51 –2.75
Age (vs. 18–25)
26–30 12.66 –14.28 –16.93 22.93 –8.24 –9.55 –9.36 –0.69
31–50 9.48 –11.34 –5.14 5.21 2.57 –16.89 –7.76 0.14
51–65 3.72 –7.79 0.51 12.46 –11.09 –15.64 –6.96 0.12
65 + 19.74 –20.31 –15.86 24.03 –11.70 –20.11 –5.37 –2.69
Education (vs. low)
medium –6.80 0.48 –6.80 –4.97 –14.15 0.84 –3.04 –5.35
high –9.65 –12.39 –13.81 –38.75 –18.91 –0.68 –0.98 –10.83
Settlement type (vs. rural)
town –19.57 –2.97 –13.03 –14.19 –4.78 8.92 6.19 –5.11
city –13.45 6.42 –2.76 –43.81 2.04 10.22 1.41 –3.55
Second-order election 4.16 –1.60 2.59 –92.80 1.95 8.46 0.79 –6.16
Dissatisfaction with democracy –1.07 9.98 5.37 –2.00 3.91 13.58 –14.18 –1.26
Negative economic expectations –4.67 –5.91 –8.01 5.12 5.10 6.30 –5.38 –0.29
Dissatisfaction with government 2.61 2.64 1.09 3.85 0.15 0.66 3.80 2.76
Socio-economically right-wing –4.06 0.00 –0.38 0.11 –0.04 –3.00 1.63 –0.55
Socio-culturally right-wing 2.23 1.36 1.77 5.48 5.15 1.88 5.21 3.50
Weak attachment to EU 0.73 –3.80 5.50 10.61 16.31 4.19 –0.25 0.32
Explanatory power (pseudo-R 2) 0.31 0.32 0.16 0.60 0.58 0.55 0.54 0.24
Explanation of Table 1:
– Considerable differences in explanatory factors for vote choice are found between states.
– Attitudes and opinions are much more important overall, in particular right-wing socio-
cultural attitudes.
– Clear patterns of AfD voter choice are found for elections in 2016, after Bernd Lucke left;
this is not the case for elections in 2014.
Note: The figures represent the effects of the indicators on the AfD vote as percentage point change. For the overall model the 95 percent level was used to determine significance;
for the individual state models 90 percent. The difference results from the different sample sizes. State abbreviations: Saxony (SA), Thuringia (TH), Brandenburg (BB), Saxony-Anhalt (ST),
Baden-Württemberg (BW), Rhineland-Palatinate (RP) and Mecklenburg-Vorpommern (MV).You can also read