1Q 2019 RESULT PRESENTATION
←
→
Page content transcription
If your browser does not render page correctly, please read the page content below
1Q 2019 RESULT PRESENTATION

                              1
COMPANY
         BACKGROUND

                       1Q/2019                  BUSINESS
                      HIGHLIGHTS                 LINES

                                   INDUSTRIAL
                                    OUTLOOK

                                                           1
May 6th, 2019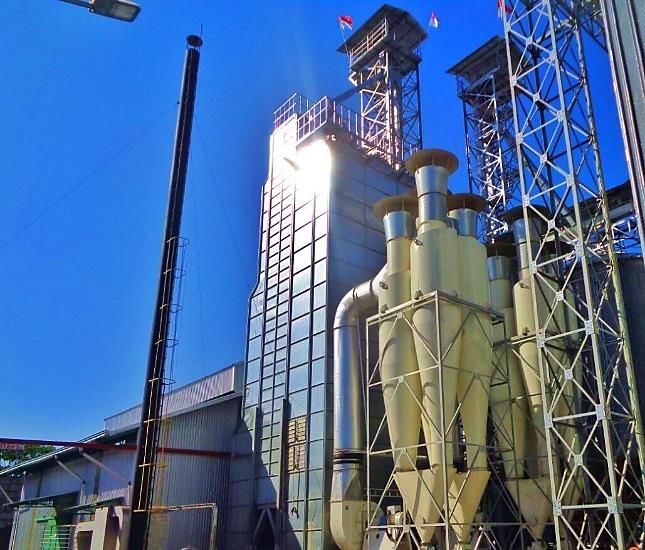
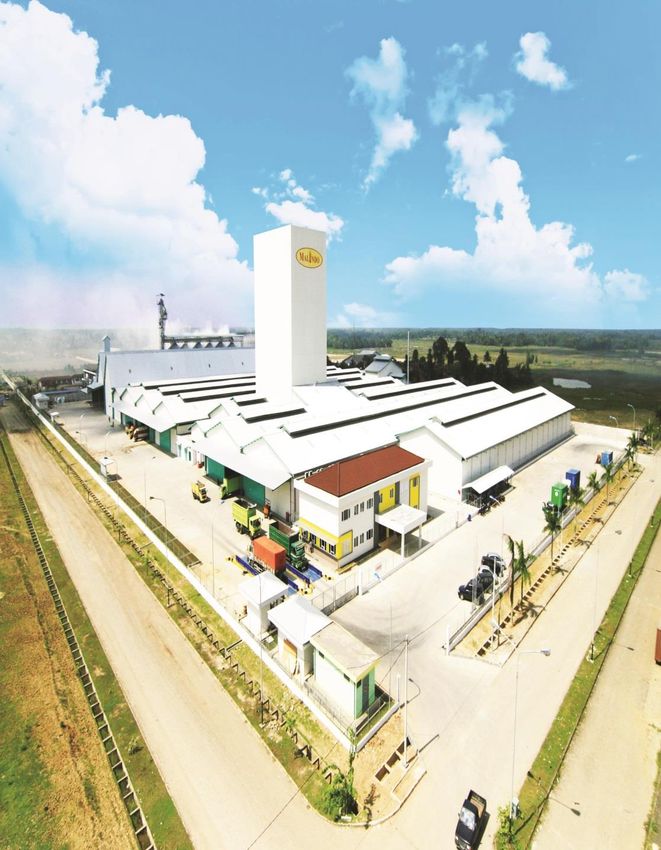
COMPANY BACKGROUND

                            More than 20 years as a leading livestock company
                                             in Indonesia.

                                                        Improvement in many aspects from
    Built significant milestones with
                                                        HR competencies to utilization of
    numerous achievements in the
                                                        modern technology
    agribusiness     industry   which
    producing high quality of chicken
    and eggs with IDR 3Tri of market                    Healthy financial position     with
    cap.                                                gearing ratio (net) of 0,72x

                                                                                              2
            May 6th, 2019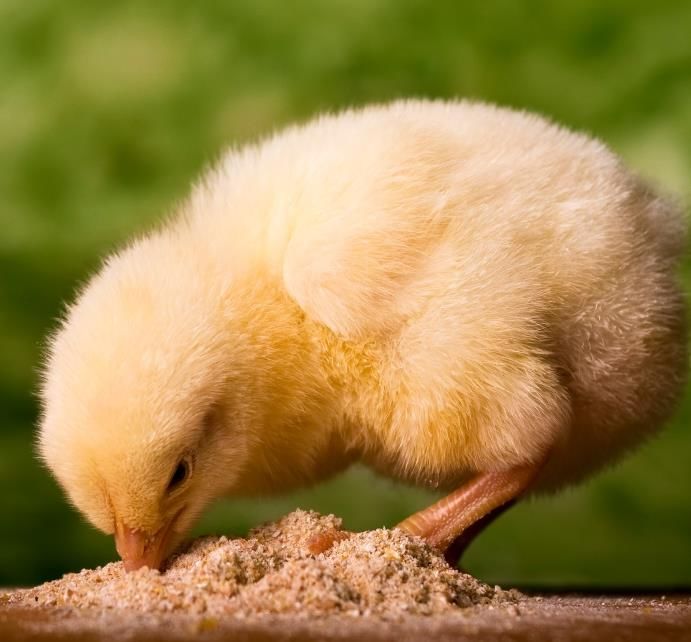
KEY FINANCIAL HIGHLIGHTS

         Attractive, Fast Growing Industry
                                                                          GDP growth – 2018: 5.17%;
         Amongst the lowest poultry      The preferred protein due to
                                                                          2017: 5.07% on higher
         consumption in SE Asia at 7     its cultural & religious fit and
                                                                          Government spending of
         kg vs Malaysia at 46 kg         affordability
                                                                          4.56% YoY

          Top-3 Integrated Player
                                         Strong position in feed,
                                                                        Reputation as high quality
          Vertically integrated player   breeder and broiler with
                                                                        producer, solid track record
          with 7-8% market share         growing branded consumer
                                                                        with diverse customer base
                                         food products

                                                                                                       3
         May 6th, 2019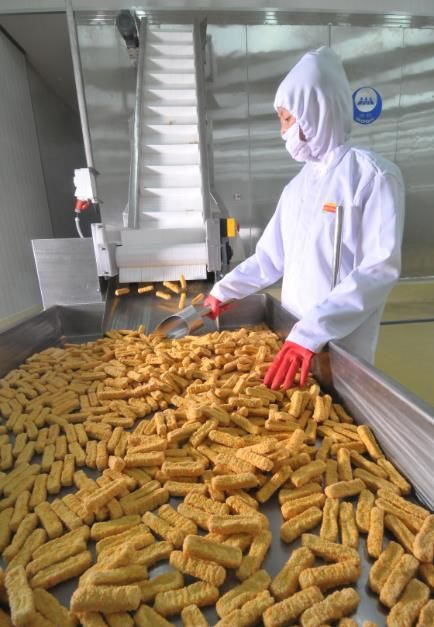
KEY FINANCIAL HIGHLIGHTS

         Secured Capex Budget

         Capex plan in place to sustain 32% annual Further scale anticipated to improve EBITDA
         revenue growth                            margins

          Quality Management & Governance

          The founding shareholder Professional managers,         Historical dividend payout
          has 40+ years of industry independent board, best-      ratio in the range of 15-30%
          experience in SE Asia     in-class policies             of net income

                                                                                                 4
         May 6th, 2019
1Q/2019 HIGHLIGHTS

    DOC & Broiler Average Selling Price                 Consumer demand projected to improve with
 Government initiatives ensuring stable DOC                 strong support by macro conditions
    & chicken prices and supply-demand                     GDP growth: 2018 5.2% (2017 c. 5.1%)
                  dynamics

                                              Q1/2019

  Feed margins to benefit from volume
                                                        Consumer food volume continues increasing
 growth, particularly expanding to swine
                                                         by boosting the sales through social media
           feed and duck feed

                                                                                              5
                     May 6th, 2019
FINANCIAL PERFORMANCE
  TOTAL SALES                   2,500.0

                                                           1,944.8
                                2,000.0

                                            1,473.8
                                1,500.0

                                1,000.0

                                 500.0

                                      -
                                           Q1/2018        Q1/2019

  EBITDA

                                450.0

                                           11.5%                     15.0%
                                350.0                  10.6%
                                                                     10.0%
                                250.0                  206.3
                                           169.1                     5.0%
                                150.0
                                                                     0.0%
                                  50.0                               -5.0%

                                 (50.0)   Q1/2018     Q1/2019        -10.0%

                                                                              6
                May 6th, 2019
SEGMENT PERFORMANCE
  FEED             SALES            37 %
                                                               BREEDER
                                                                                        SALES      44%
                                                                                                             19.0%    20.0%
                                                                                                    413.9             18.0%
                                                                  430.0
    1400.0                            1,215.0 8.7%      8.8%
                                                                                                                      16.0%
    1200.0                                              8.6%      330.0        287.6                                  14.0%
    1000.0      884.7                                   8.4%                                                          12.0%
     800.0                                              8.2%      230.0                   10.6%                       10.0%
     600.0                                              8.0%                                                          8.0%
                           7.9%                                   130.0                                       78.8
     400.0                                              7.8%                                                          6.0%
                        70.24501               105.6                                     30.6
     200.0                                              7.6%       30.0                                               4.0%
       0.0                                              7.4%                                                          2.0%
                 Q1/2018                   Q1/2019                -70.0          Q1/2018              Q1/2019         0.0%

  BROILER                                                      FOOD
                   SALES            7%                                50.0               SALES     -9%               -70.0%
                                                                                  35.7               32.5
     300.0                7.0%        283.5            8.0%           30.0                                           -60.0%
                265.9
     250.0                                             6.0%           10.0
                                                                                                                     -50.0%
     200.0                                             4.0%           (10.0)
                                                       2.0%                                (7.7)             (7.7)   -40.0%
     150.0                                                            (30.0)
                                                       0.0%                                                          -30.0%
     100.0                                                            (50.0)           -21.5%            -23.6%
                                                       -2.0%
         50.0             18.6                         -4.0%          (70.0)                                         -20.0%
           -                                           -6.0%
                                             -7.0%                    (90.0)                                         -10.0%
     (50.0)       Q1/2018                Q1/2019
                                             (19.8)    -8.0%                       Q1/2018           Q1/2019

                                                                                                                              7
                    May 6th, 2019
CAPEX PLANS
                                                                                                                           Capex (IDR bn)

  Feed capacity (MT)                                                    Broiler capacity (MT)

                                                                                                         CAGR
                                                                                                         23,3%

           23                64                262                              57              79               116

   DOC capacity (Mn birds)
                                                                          Consumer Foods capacity (MT)

                                        CAGR
                                        2,3%

           244               167               77                              2                5                0

     Projected Capex of IDR 455 bn in 2019 will enable Malindo to capture increased demand as the general economy & market grows

                                                                                                                                      8
                        May 6th, 2019
PROFIT FORECAST

                         9
         May 6th, 2019
STRATEGIC LOCATIONS
10
May 6th, 2019INDUSTRY OUTLOOK
Source: OECD/FAO, 2018
Consumption of poultry increases in all region and income level.
Consumption per capital will grow, but growth rates will remain higher for developing regions.
12
May 6th, 2019INDUSTRY OUTLOOK
SE ASIA POULTRY CONSUMPTION
(KG/ CAPITA IN MILLIONS)
60
50
40
30
20
10
0
2014 2015 2016 2017 2018 2019 2020 2021 2022 2023 2024 2025 2026 2027
China Indonesia Malaysia Philippines Thailand Vietnam
Source: OECD, 2019
Indonesia has the lowest poultry consumption among the other South East Asia countries,
which this means there is a large growth opportunity for Indonesia poultry business.
11
May 6th, 2019INDUSTRY OUTLOOK
13
May 6th, 2019INDUSTRY OUTLOOK
('000)
300,000
264,000 265,000 271,000
242,500
250,000
217,500
200,000
150,000
100,000 80,000
58,080 60,000
45,000
50,000
15,225
-
2002 2010 2017 2018 2020
Indonesia total population Middle class population
Source: Badan Pusat Statistik (2018) and Indonesia Finance Ministry (2019)
Indonesian middle class expected to reach 80 Million in 2020
13
May 6th, 2019BUSINESS LINES
Emerging Market Leader in Poultry
Indonesia feed production capacity share (2018) Indonesia DOC production capacity share (2018)
20%
25%
35% CPIN
JPFA 38% CPIN
MAIN JPFA
8%
NEW HOPE MAIN
CJ 5% NEW HOPE
4%
Others Others
7%
8%
25%
25%
Malindo is well-positioned to capture market share from the overall growth
in the poultry industry, including the growing branded processed poultry segment
Source: Company (2018)
14
May 6th, 2019FEED UPDATES
Installation of additional corn dryers & silos in
2018 to increased utilization of local corn
Additional 1 line drier in Makassar of 500
tonnes/day of capacity
Malindo is able to secured more corn during the
harvest period, thus the cost of corn is coming
down.
Malindo is able to manage price and FX volatility
of imported raw materials over time due to its
scale and favorable industry dynamics
Maximize the production utilization is expected to
improve EBIT margin through economies of scale
(target utilization in FY2019 : 75%-80% of optimal
capacity)
15
May 6th, 2019BREEDER UPDATES
High Quality DOC
➢ Efficient Feed Conversion Ratio (FCR) low mortality rates,
high uniformity and fast weight gain
➢ Technical expertise and strict sanitation and biosecurity
standards results on low-mortality rate
➢ Efficient and proven farm house management techniques
➢ Strong R&D capabilities ensures continued improvements
and quality control
Strong customer relationships and extensive distribution
network
➢ 20 years of experience on the ground, dedicated customer
support team
➢ Offer a full range of products and services
➢ Provide technical assistance and support to farmers
16
May 6th, 2019BREEDER UPDATES
Expanding production capacity with a target of 270Mio
chicks in FY2019
➢ Malindo expects to add 7% - 10% production volume per
annum beyond 2018 to support projected market recovery.
17
May 6th, 2019BROILER UPDATES
• High quality DOC and best-in-class farm management ensures
high-quality broiler
• Diverse geographic location limits disease outbreaks
• Expanding capacity to 77,500 tons in FY2019 to support the
growth in processed food & chicken consumption
• Expanding to Sumatera (on progress)
• Focus on supplying internal processed food division to ensure
high quality chickens for its branded consumer products
18
May 6th, 2019PROCESSED FOOD UPDATES
2 main brands, targeting diverse customer base
➢ Sunny Gold
Premium brand targeting modern trade, estimated to
generate 40% of revenues. Available at major
supermarket chains e.g. Lottemart, Hero, Giant,
Superindo, Hypermart, Carrefour.
➢ CikiWiki
Mass brand targeting traditional market, estimated to
generate 60% of sales
TV Commercial
We are now focusing on below the line and
extensification areas of Java and outside Java.
19
May 6th, 2019PROCESSED FOOD UPDATES
CUSTOMER AND OUTLET GROWTH DISTRIBUTION MAP
20
May 6th, 2019INVESTOR RELATION
THANK YOU
www.malindofeedmill.com
Sunny Gold
@sunnygoldid
@sunnygoldidYou can also read